Sun Belt Apartment Transaction Activity Accelerates Into Post-COVID Recovery

- The Southeast and Southwest (the Sun Belt) are proving to be the engines of new apartment investment activity in the U.S., collectively accounting for 59.7% of all deal volume.
- Palm Beach County, Nashville, Raleigh/Durham, Phoenix and other Sun Belt metros are leading the post-pandemic expansion, posting apartment transaction volume totals well above their 2019 levels.
- Top-performing markets in the Sun Belt share strong population growth and labor market figures while gateway metros are behind the recovery curve.
Key Findings
Real estate investors do not like uncertainty. It impedes frictionless transaction activity, creating gaps between what a buyer and seller consider fair market value. In periods of hyper-uncertainty, much as the U.S. was in spring 2020, markets can slow to a standstill. Now, with a full of year of post-shutdown recovery in the rearview, the scope of uncertainty is shrinking, and the pace of apartment transaction activity is picking up steam.
However, while some U.S. regions and markets are quickly returning to health and resuming normal deal activity, others are just starting to regain their footing. Here we explore which parts of the country are seeing the most activity in the post-COVID cycle and discuss the economic drivers that are capturing investors’ attention and supporting fundamentals.
National Apartment Transaction Activity Gains Momentum
In 2019, Real Capital Analytics (RCA) tracked $191.9 billion worth of apartment transaction activity, beating 2018’s total by a solid 8.0% and setting a new all-time high. The deal tape in 2020 was, to put it mildly, not quite as full. The shutdown and broader COVID-induced recession caused transaction volumes to crater, especially during the second quarter of last year.
Thus far in 2021, deal activity remains well below the pre-COVID pace, though there is momentum as the economic rebound continues. Through May, RCA has tracked $62.9 billion worth of apartment transaction volume this year, underperforming 2019’s January-May total by $4.3 billion (down 6.4%) but exceeding 2020’s total through the same period by $12.0 billion (up 23.6%).
Breaking the data down regionally, there are significant differences in the pace of recovery across the country. The Southeast and the Southwest (collectively the Sun Belt) are on a tear. Together, these two regions account for 59.7% of all 2021 apartment transaction volume in the U.S. through May.
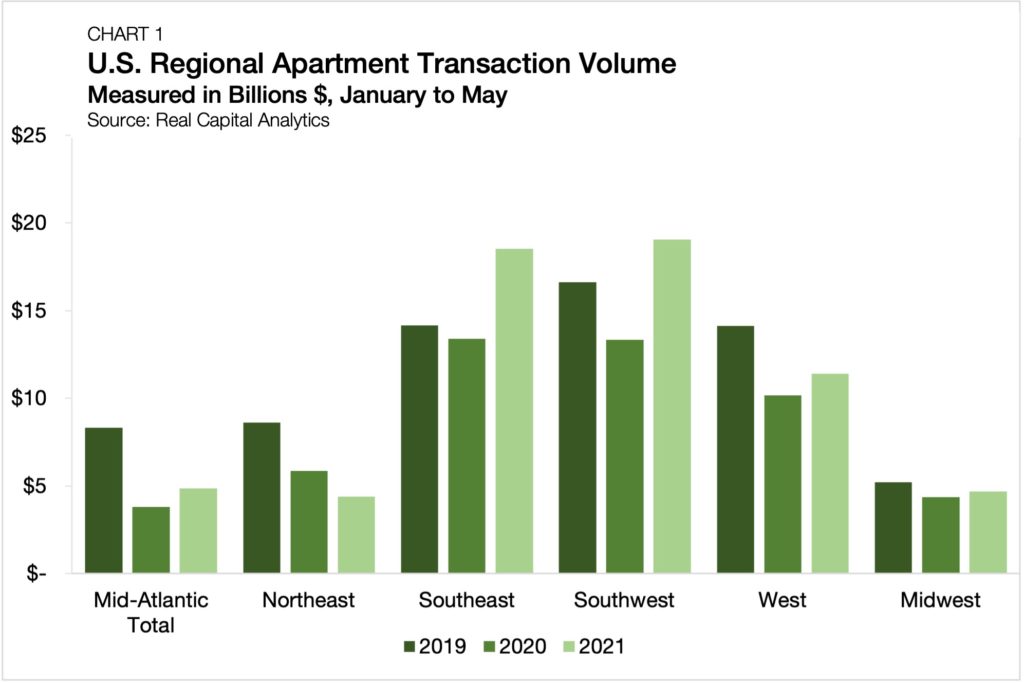
The Southwest narrowly comes out on top as the most active region, totaling $19.1 billion worth of apartment sales through May, overtaking the Southeast by just over $500 million (Chart 1). Compared to the volume the Southwest recorded through May 2019 and May 2020, this year’s pace of deal flow is up by 14.7% and 42.7%, respectively. Meanwhile, the Southeast follows right behind, recording $18.5 billion through May and exceeding 2019’s and 2020’s pace by 31.0% and 38.2%, respectively.
Sun Belt Markets Shine in 2021
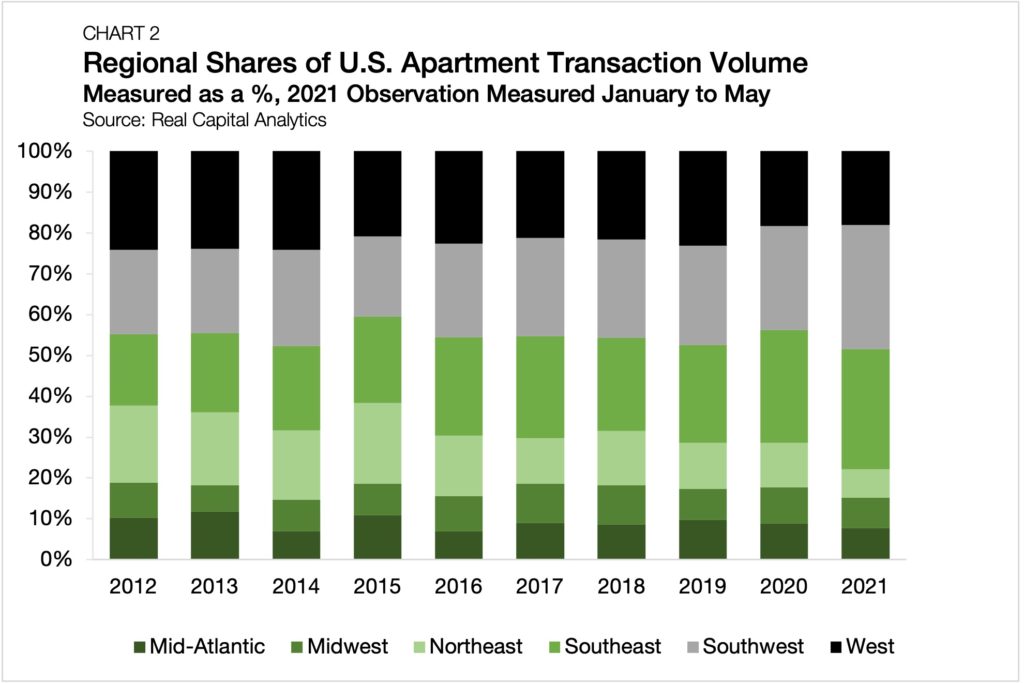
The outperformance of the Sun Belt region of the U.S. follows a near-decade-long trend. Including partial results from 2021, the Southeast and Southwest have seen their shares of total U.S. apartment transaction volume rise in eight of the past 10 years. In 2012, the Southeast accounted for 17.5% of all U.S. apartment transaction volume, and the Southwest accounted for 20.7% (38.2% collectively) (Chart 2). Thus far in 2021, the Southeast and Southwest are capturing 29.4% and 30.3% of apartment sales, respectively. Taken together, a net 21.5% of transaction activity has shifted out of other regions of the U.S and into the ever-growing southern standouts.
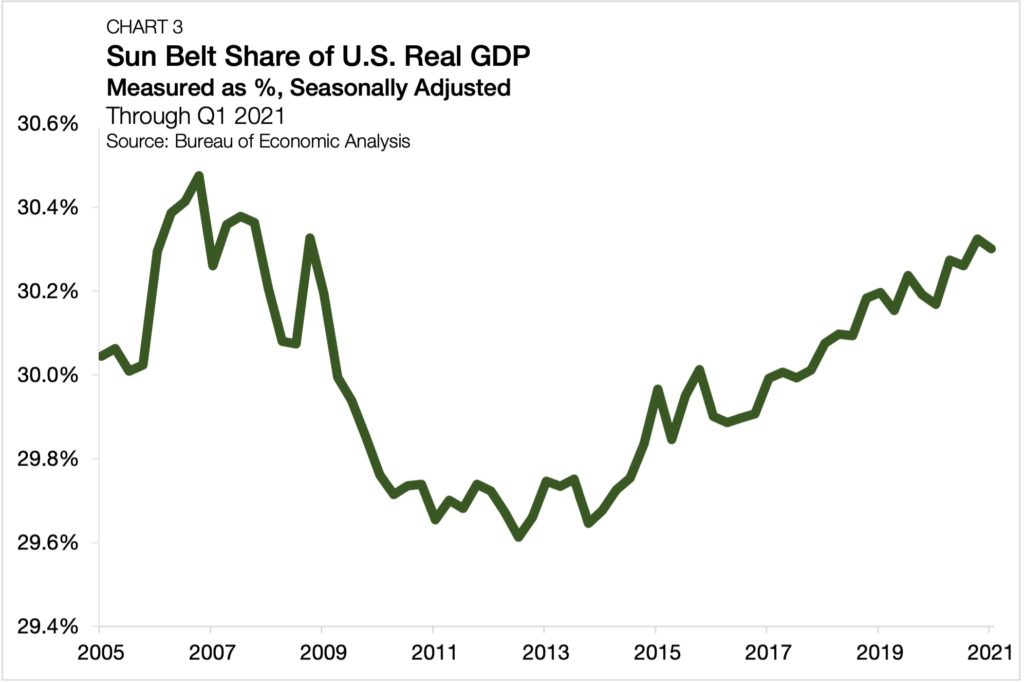
The investment thesis surrounding the Sun Belt continues to grow more concrete. As an economic region, the Sun Belt is increasingly accounting for a greater share of all domestic GDP. Following the aftermath of the Great Recession, an event that hit the southern region of the country particularly hard, the Sun Belt’s share of domestic output sank to 29.6% in mid-2012 (Chart 3).[1] Since then, the Sun Belt’s share of GDP has steadily risen and currently sits at 30.3% through the first quarter of 2021.
The increasing economic output and quality of life of Sun Belt metros are attracting investor and resident interest. Referencing the Texas economy (the Sun Belt’s largest), Rob Kaplan, President of the Federal Reserve Bank of Dallas, suggested in a recent Bloomberg interview that the migration-fueled growth of the state is unlikely to slowdown any time soon.
The Sun Belt markets that continue to attract more people and companies are seeing compounding effects of this growth. Kaplan’s comments follow recent reports that Goldman Sachs is eyeing an opening of what would be its second-largest headquarters in Dallas— a nod to the market’s ability to attract and retain talent.
Top Markets See Strong Labor and Population Growth
Relative to its 2019 pace of transaction activity through the first five months of the year, five Sun Belt markets are leading the way. Palm Beach County, FL, which is nestled right along the I-95 corridor between Orlando and Miami, has already recorded $818.9 million worth of apartment deal volume through May, a 124% increase from the total set through the same point in 2019 (Chart 4).[2]
Despite sitting less than two and a half hours from three other international airports (Orlando, Miami and Fort Lauderdale), West Palm is serviced by its own set of terminals, offering direct access from out-of-market buyers. Moreover, despite a continued pause in service due to the pandemic, the Brightline, a newly built passenger rail service that connects the downtown areas of West Palm, Fort Lauderdale and Miami, continues to generate significant investor interest in the interconnected micro-region.
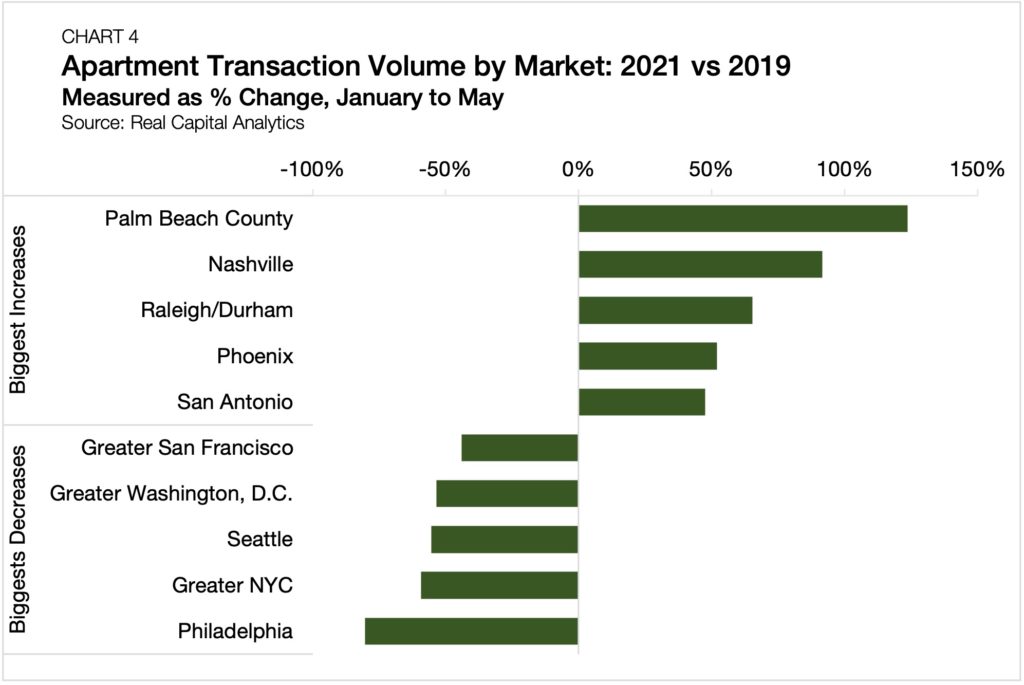
Among the other top-performing metros that are exceeding 2019’s apartment transaction volume pace, Palm Beach County is followed by four other Sun Belt markets (Nashville, Raleigh/Durham, Phoenix and San Antonio), all of which are performing between 47.6% and 91.6% above their pre-pandemic trend.
On the other side of the spectrum is Philadelphia, which may receive plenty of brotherly love, but has yet to receive much in the form of apartment transaction volume in 2021. At just a paltry $263.8 million of tracked volume through May, Philadelphia is more than 80% below its 2019 pace. Rounding out the rest of the bottom five are the Greater New York City area, Seattle, Greater Washington, D.C. and Greater San Francisco.
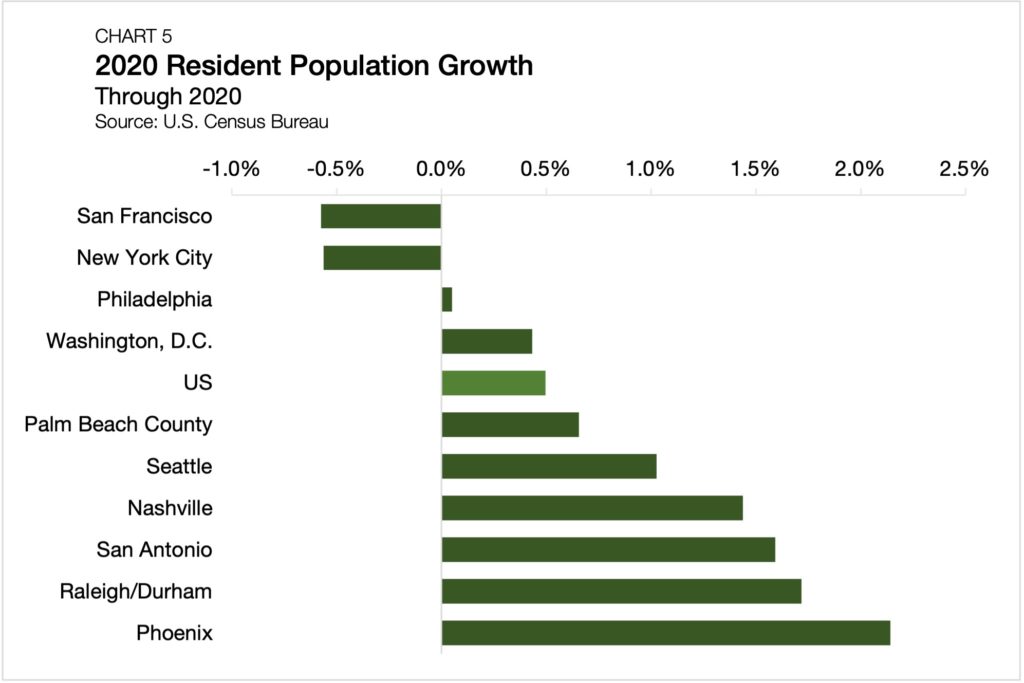
Geographic proximity is a commonality among the top-performing markets, while population size and density are unifying features for the worst performers. However, the links do extend further. All five of the of the top-performing metros share the distinction of posting positive population growth totals in 2020 above the national trend. Here, Phoenix leads the way, notching a robust resident population growth rate of 2.1% for 2020 (Chart 5).[3] The only bottom-five metro to beat the national average of 0.5% was Seattle (1.0%).
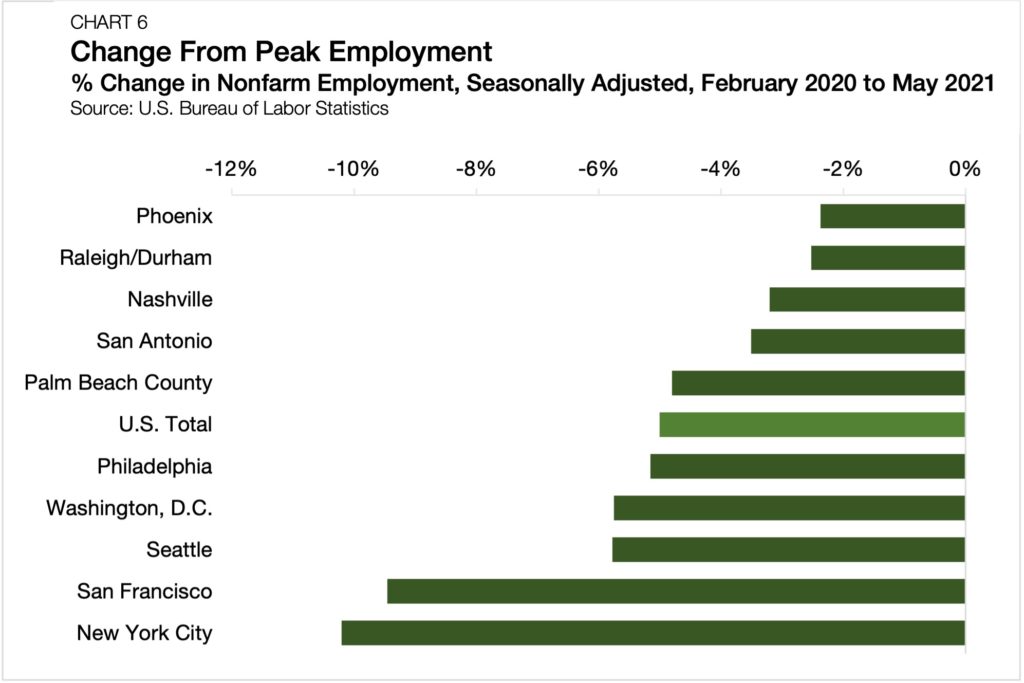
Further, all five of the top-performing metros for apartment deal volume are closer to their pre-pandemic employment totals than the national trend, while all the bottom-five metros are behind the national trend (Chart 6).[4] Again, Phoenix tops the list, reporting that its total number of nonfarm employees through May 2021 is only 2.4% below where it was just before the onset of the domestic pandemic outbreak. The original epicenter of the U.S. battle against COVID, New York City, holds up the rear in this category, posting employment totals that are still 10.2% off from its prior peak.
Outlook
Compared to the relatively pessimistic forecasts made just over a year ago, the apartment sector has broadly beat expectations. The wide availability of capital on both sides of the capital stack has meant that pricing has proven resilient, and the scale of observed distress has been limited.
With many buyers searching for distressed asset discounts and potential sellers in a position of strength to weather the storm, the process of re-establishing price discovery is, in many ways, still developing. The urban cores of gateway markets may have the longest path back to buyers and sellers finding common ground. The long-term impact of work from home adoption on Central Business Districts (CBDs) is still open to wide-ranging speculation. Intra-CBD and CBD-adjacent apartment properties will, naturally, be the most sensitive to how the remote working trends shake out as these assets achieve much of their value premiums from their proximity to places of work.
Meanwhile, there are many U.S. markets that have barely skipped a beat and are already accelerating into the post-pandemic expansion — a significant portion of which are clustered in the Sun Belt. Beyond proximity, these top-performing markets fit a balance of offering affordable lifestyle amenities to renters, strong population growth figures and diversifying economies. At the other end, even the most negatively impacted markets have turned a corner and are starting to improve, though the climb back to pre-pandemic normality will be steep. Much like after the Great Recession, recovery timelines will depend heavily on location, but those locations indicative of success are markedly different this time around.
Footnotes
[1] For the purpose of this calculation, the Sun Belt is defined here as Alabama, Arizona, Arkansas, Florida, Georgia, Louisiana, Mississippi, Nevada, New Mexico, North Carolina, Oklahoma, South Carolina, Tennessee and Texas. Southern California is also considered as part of the Sun Belt in most classification, though it is omitted here.
[2] Chart 4 measures the relative change in transaction volume from January 2021 to May 2021 compared to the same period in 2019. The year 2019 is selected as a pre-pandemic benchmark. Relative increases or relative decreases indicate how far ahead or behind given markets are compared to their pre-pandemic trend.
[3] Population data are U.S. Census Bureau annual estimates measured 2010-2020. The Raleigh/Durham estimate reflects combined Raleigh and Durham-Chapel Hill MSAs. Palm Beach County is measured at the county-level. All other market data are measured at the MSA level.
[4] Raleigh/Durham estimate reflects combined Raleigh and Durham-Chapel Hill MSAs. Palm Beach County measured as the West Palm Beach-Boca Raton-Delray Beach Metropolitan Division. All other market reported data are measured at the MSA level.
Notes on Methodology:
- Greater New York City (NYC): Includes Manhattan, NYC’s outer boroughs, Northern New Jersey, Long Island and Westchester.
- Greater Los Angeles: Includes Los Angeles, Orange County, and Inland Empire.
- Greater Washington, D.C.: Includes D.C. and the surround suburbs in Maryland and Virginia.
- Greater San Francisco: Includes San Francisco, San Jose, and East Bay.
- Miami: Measured by Miami-Dade County
- The list of metro markets posting the highest increases in transaction activity omits St. Louis, Broward County and Memphis due to limited data availability. The list of metro markets posting the biggest decreases in transaction activity omits Cincinnati, Hartford, Pittsburg and Cleveland due to limited data availability.

