Top U.S. Multifamily Markets of the Decade Snapshot

Over the course of the past decade, the multifamily real estate market solidified itself as a premier asset class. Apartment demand in the top U.S. markets was driven not only by the shifting demographics, but also housing affordability issues surrounding escalating prices, limited supply and stagnant wage growth.
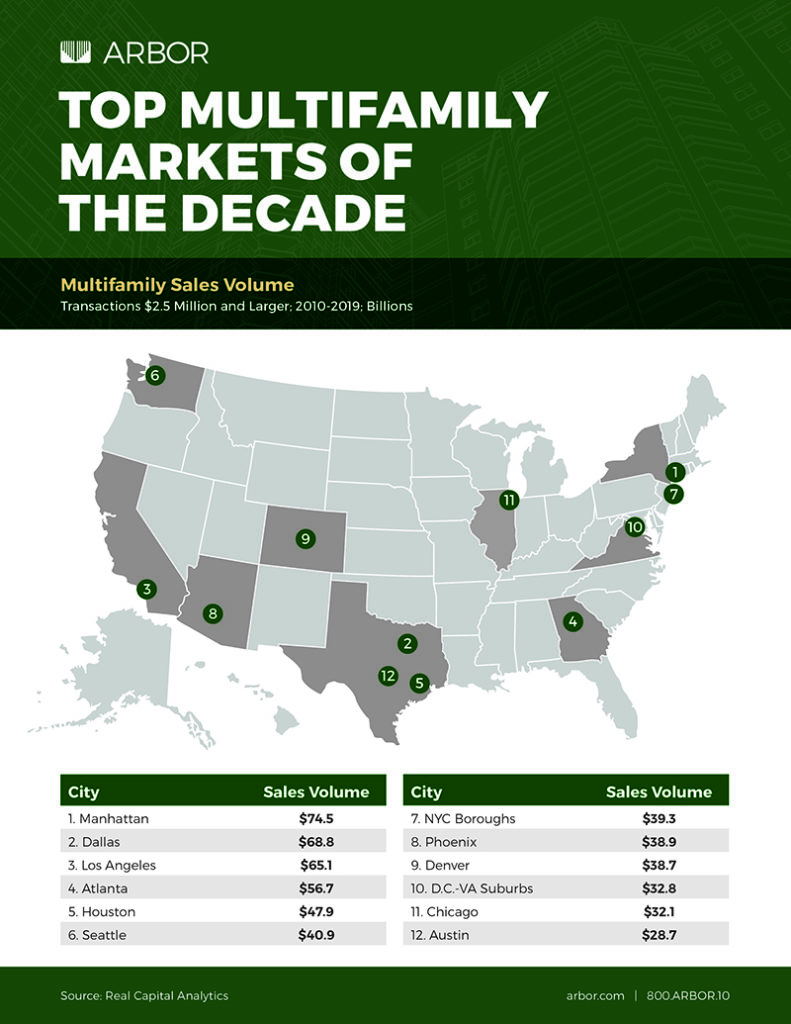
Here’s a quick look at the top U.S. multifamily markets by sales volume over the last decade.
Transaction volume totaled $1.2 trillion during the decade, setting record numbers nearly every year, according to Real Capital Analytics. The average sales price increased from $77,900/unit in 2010 to $176,000/unit in 2019. At the same time, the average cap rate fell from 6.8% to 5.4%. The top destinations for capital investment were among the largest markets in the country, but a closer look at the data reveals each market’s individual performance.
Manhattan led the U.S. with a total of $74.5 billion in multifamily transactions recorded from 2010 through 2019. New York City’s outer boroughs also made the top rankings, with $39.3 billion in volume
Dallas was number two on the list, with a total of $68.8 billion in sales. The market had a strong second half of the decade, topping all markets with more than $48.3 billion in sales.
Sun Belt markets performed particularly well during the expansion. In addition to Dallas, Atlanta ($56.7 billion) and Houston ($47.9 billion) ranked high as top destinations of capital.
For a complete look at the top U.S. markets of the last decade, view our full report.
Need multifamily financing? Visit Arbor’s loan programs page to see how our array of loan options can help you achieve your multifamily investment goals today!


