Articles

Build-to-Rent Construction Continues Its Record-Breaking Ascent

Increasingly, single-family rental (SFR) operators have been relying on build-to-rent (BTR) development to bridge the housing gap, accelerating the momentum of SFR construction through 2024’s halfway point. Both total SFR/BTR housing starts and BTR’s share of all single-family housing starts reached new record highs in the second quarter, setting the stage for another banner year.

Current Reports

Small Multifamily Investment Trends Report Q3 2024

The small multifamily outlook continues to brighten as more signs indicate a normalization has already begun. In the second quarter, originations activity and borrowing conditions improved as completions sat at a five-decade high, Arbor’s Small Multifamily Investment Trends Report Q3 2024, developed in partnership with Chandan Economics, shows. While the subsector’s fundamentals are trending up, it still has room for growth when interest rate relief arrives.

Articles

Top Markets for Multifamily Permitting in 2024’s First Half

While the overall pace of new multifamily permitting per capita in the U.S. slowed recently, it has picked up momentum in pockets of the country, especially the Midwest. In the first two quarters of 2024, Madison, WI, Columbus, OH, and Omaha, NE, were among the major metropolitan markets posting solid permitting gains, another sign of multifamily’s strength in all cycles.

Analysis

Top U.S. Multifamily Rent Growth Markets — Q2 2024

The U.S. multifamily market followed the quick pandemic contraction with a strong recovery, and has now normalized into a more stable cycle. Demand remained strong across the country, with a wide variety of markets among the leaders for rent growth.

Articles

Affordable Housing Supports Positive Physical and Mental Health

Did you know that more U.S. renters now spend over 30% of their income on housing and utilities than at any other time on record? Limited affordable housing options not only increase the rent burdens of low-income tenants but disrupt physical and mental health, underscoring the need for the creation and preservation of more affordable housing units nationwide. Quality affordable housing adds stability to communities and supports healthier environments that can significantly improve well-being.

Analysis

U.S. Multifamily Market Snapshot — August 2024

After skyrocketing through a boom cycle over the past two years, the U.S. multifamily market settled into a cycle of stabilization in the first half of 2024. Rents held steady, occupancy increased, and vacancy rates remained in line with historical averages, while investor sentiment remained positive.

Articles

Annual SFR CMBS Issuance On Pace to Triple in 2024

Single-family rental (SFR) CMBS issuance saw a sizeable pickup through the first half of 2024, with $4.2 billion in new issuance, placing it on pace to at least triple last year’s annual total.

Articles

Arbor’s Build-to-Rent Financing: 10 Reasons to Choose a Premier Lender

Build-to-rent (BTR), a compelling solution to the U.S. housing market’s evolving needs, is experiencing record growth. BTR accounted for 8% of all single-family rental (SFR) construction starts in the 12 months that ended in the first quarter of 2024, according to Arbor’s Single-Family Rental Investment Trends Report Q2 2024. As the need for quality rental units remains high, borrowers have much to gain from partnering with an experienced lender who specializes in build-to-rent financing.

General: 800.ARBOR.10

Q3 2020
Small Multifamily
Investment Trends Report

Small Multifmaily Maintains Its Penchant for Stablitity

Key Findings

  • Small multifamily prices recovered, up 0.1% year-over-year
  • Annualized origination volumes decreased 12.0% in 2020
  • Refinancings accounted for nearly 4 in 5 small balance loans

State of the Market

While the initial, unpredicted damage of the COVID-19 shutdowns has moved firmly into the rearview, local economies across the U.S. are still struggling to find the right balance of speed and safety in their return to normalcy. The labor market continues to recover, though the pace of the growth has started to slow. Between May and August, the civilian unemployment rate improved by an average of 1.6% each month. In September, this rate of recovery fell to just 0.5%, dropping the unemployment rate from 8.4% to 7.9%. Federal Reserve leaders have projected the return to pre-COVID levels of full employment by 2023.


According to the Bureau of Economic Analysis, the U.S. economy expanded at a 33.1% annualized growth rate in the third quarter, the highest reading ever. Of course, this comes after a -31.4% contraction in second quarter. Looking ahead, according to the WSJ Economic Forecasting Survey, the fourth-quarter GDP is forecasted to land at 3.8%.


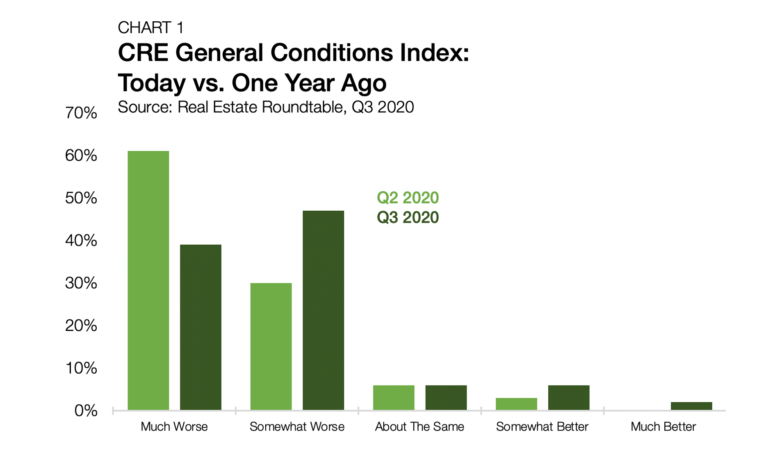
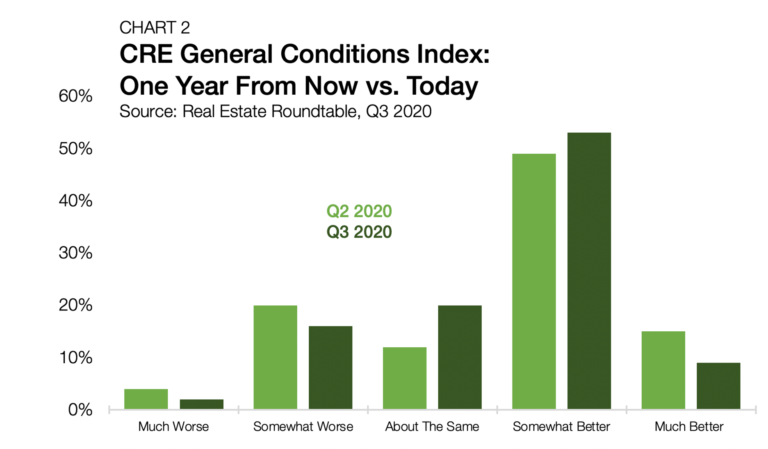
Turning now to commercial real estate, the outlook is similarly improving for the months ahead. According to the Real Estate Roundtable’s Sentiment Index third quarter 2020 report, while respondents report conditions are worse today than one year ago, there was a marked improvement from when the same question was asked back in the second quarter (Chart 1). The majority of respondents were optimistic for the year ahead, with 62.0% expecting conditions to either be somewhat or much better in 12 months (Chart 2).

Within the small multifamily sector, the pandemic remains an active disruptor of property-level cash flows. According to Freddie Mac, through August, 76.0% of loans in forbearance are tied to their Small Balance Lending program — a symptom of relatively fewer units per asset and a higher tenant-sensitivity to the ongoing recession. Investment sales remain elusive, though the participation of the agencies is sufficiently safeguarding market-level liquidity.


Small multifamily asset prices improved in the third quarter, jumping 1.3% from the second quarter, according to Chandan Economics. Overall, while small multifamily is working through its fair share of coronavirus-related pain, the agencies’ support and the sector’s resilient underlying demand fundamentals continue to reinforce a favorable long-term outlook.

Lending Volume

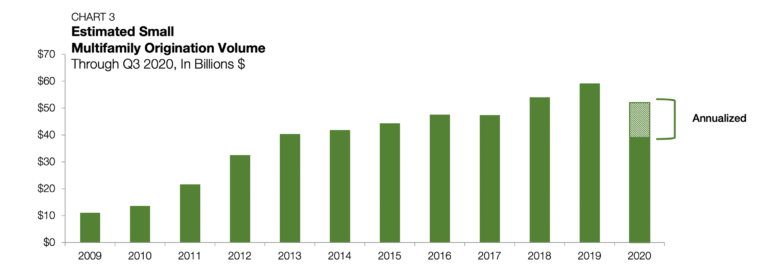
Annualized 2020 estimates of new multifamily lending volume on loans with original balances between $1.0 million and $7.5 million — including loans for rental apartment building sales and refinancing — ticked down to $52.1 billion through the third quarter. (All data, unless otherwise stated, is based on Chandan Economics’ analysis of a limited pool of loans with original balances of $1.0 million to $7.5 million and loan-to-value ratios above 50.0%.)


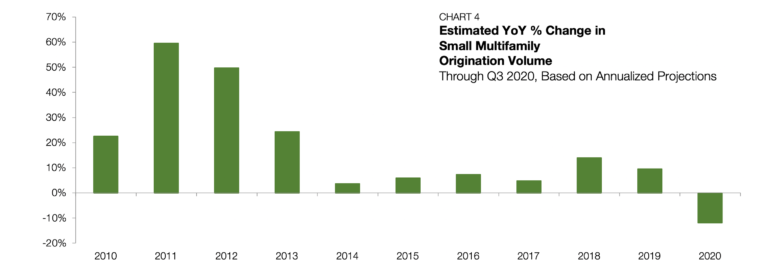
In 2019, small multifamily originations reached an all-time high of $59.2 billion, according to Chandan Economics’ post-financial crisis market tracking and model estimates (Chart 3). The current estimate falls below last year’s annual pace by $7.1 billion and represents a 12.0% decline in lending activity (Chart 4).

When the full weight of the pandemic hit in March, buyers pulled back hard on the reins. Conversely, lenders that remained active, by and large, have maintained asset pricing at pre-pandemic levels. Cap rates in small multifamily acquisitions averaged 60 bps higher than refinanced assets in the third quarter alone. Moreover, falling interest rates have provided an opportunity for existing owners to reduce monthly debt servicing costs.


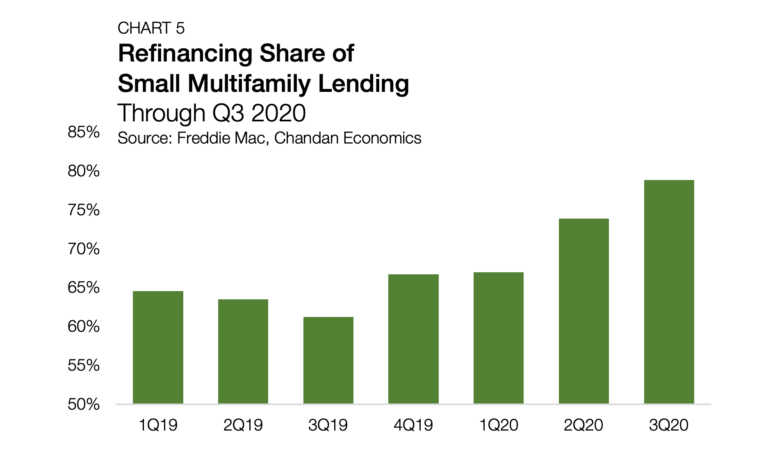
Together, these factors partially explain why refinancing activity comprised an outsized share of overall lending activity in the second and third quarters. Refinanced loans accounted for 78.8% of all small multifamily originations in the third quarter, up from an already elevated 73.9% in the second quarter (Chart 5). The refinancing ratio sat between 61.2% and 66.7% through 2019 and the beginning of this year.

Arbor Small Multifamily Price Index

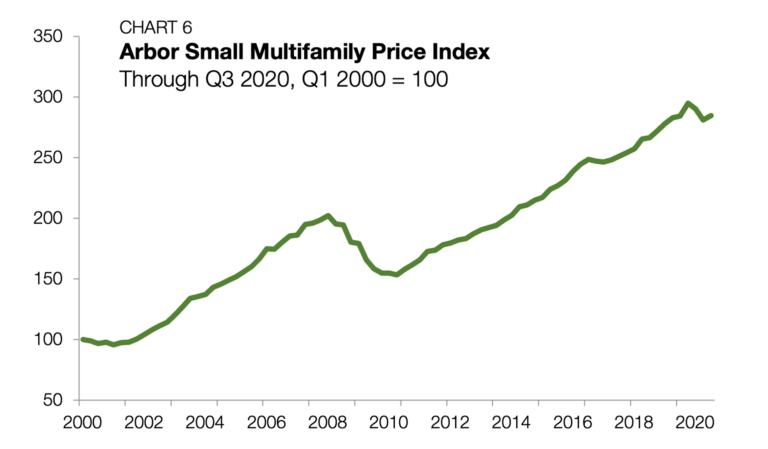
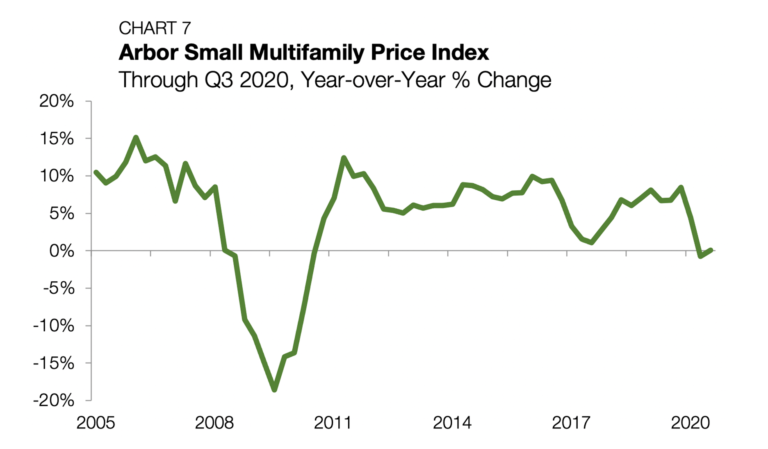
As measured by the Arbor Small Multifamily Price Index, small multifamily prices stabilized in the third quarter of 2020, up 1.3% from the second quarter and 0.1% from one year ago (Chart 6 and Chart 7). (The Arbor Small Multifamily Price Index (ASMPI) uses model estimates of small multifamily rents and compares them against small multifamily cap rates. The index measures the estimated average price appreciation on small multifamily properties with 5 to 50 units and primary mortgages of $1.0 million to $7.5 million. For the full methodology, visit arbor.com/asmpi-faq).

Moreover, revised second-quarter estimates indicate that national pricing of small multifamily assets held up better than previously reported. With the updated estimates, prices fell just 0.7% from the prior year.


The price stability of the small asset subsector is anything but happenstance. Instead, it reflects the sector’s deep pool of liquidity. Owners, across the board, are unwilling to capitulate to the demands of prospective buyers. The availability of refinancing capital has allowed owners to access their accrued equity without discounting their assets to meet market-clearing transaction prices.

Cap Rates & Spreads

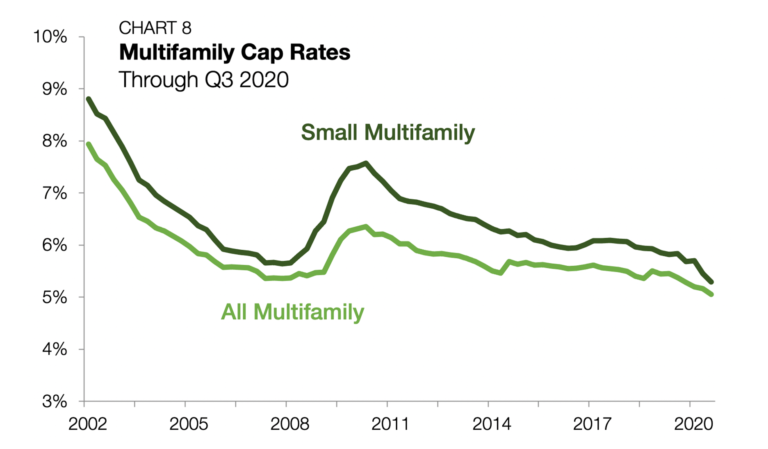
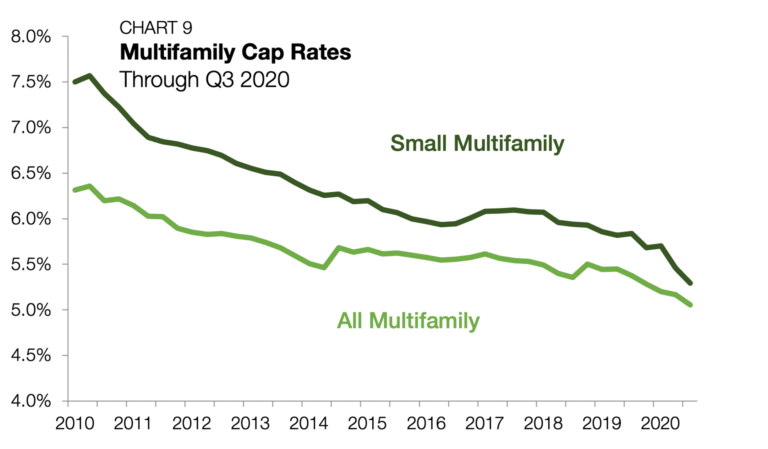
National average cap rates for small multifamily properties narrowed by 16 bps in the third quarter of 2020, reaching 5.3% (Chart 8 and Chart 9). Similarly, estimates of second-quarter small multifamily cap rates were revised down to 5.5%, dropping 25 bps from the first quarter.

Observing small multifamily cap rates in the current market environment is a bit like figuring out which way the wind is blowing from the inside of a twister. Benchmark risk-free interest rates are down near their lowest record levels, which drags down all other market-level returns.


Pandemic-related uncertainty has introduced a new risk premium, offering a counterbalancing upward pressure. Simultaneously, if the effects of COVID-19 on property-level cashflows are observed and not theoretical, net operating income (NOI) would fall, causing cap rates to do the same. In addition to the above variables, the shifting center of gravity away from investment sales and toward refinancing in capital markets puts additional downward pressure on market average cap rates. The net effect of these competing market forces is a slight reduction in small multifamily cap rates.


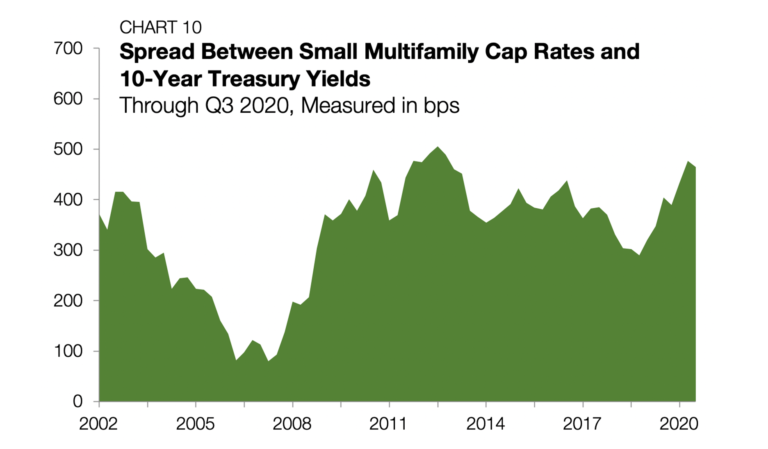
Through the last three months, 10-year Treasury yields averaged just 0.65%, the lowest quarterly reading on record — a statement that has become a bit of a recurring trend in recent reports. As the state of the world became less certain, investors stepped up their preference for “safe-haven” assets, causing the price of Treasurys to rise and their yields to fall.


The risk-free interest rate is embedded within the yield structure of all other market returns, including cap rates. Investors require additional compensation when accepting additional risk. We can infer this risk premium in small multifamily by looking at the difference between cap rates and Treasurys. The spread ticked down to 465 bps through the third quarter, falling from their recent high of 477 bps measured in the second quarter (Chart 10).

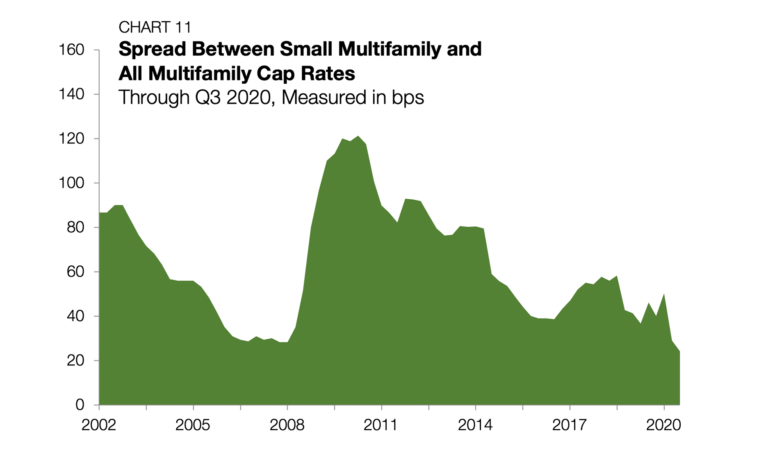
The cap rate spread between small multifamily and the rest of the sector fell to 24 bps through the third quarter of 2020, the slimmest margin on record (Chart 11).

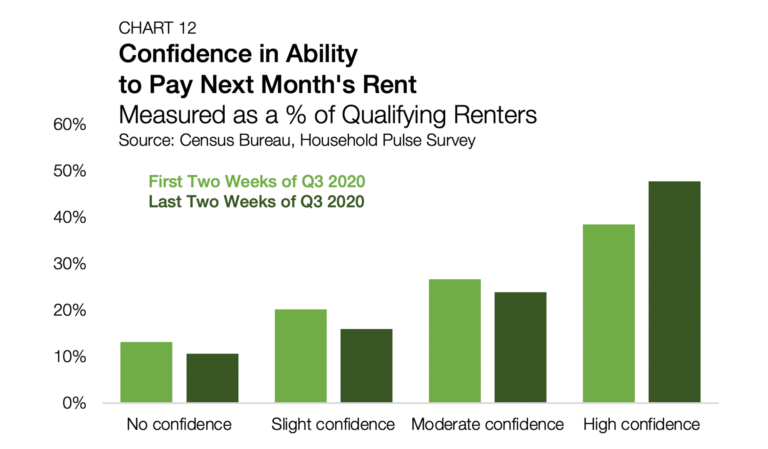
The CARES Act’s expiration at the end of July and the absence of a new congressionally approved stimulus package to take its place had revived fears of widespread tenant performance issues. However, the worst-case scenario of expiring aid has not come to pass, according to a Chandan Economics analysis of the Census Bureau’s Weekly Pulse Survey.

The confidence of renters in their ability to pay their next rent payment rose over the third quarter, despite the tapering stimulus. During the final two weeks of the third quarter, the share of renters that responded with “high confidence” jumped to 47.7%, up from 38.5% during the first two weeks of the quarter (Chart 12). (Data for the last week of the third quarter 2020 is taken from the Census Bureau’s Week 15 Household Pulse Survey, which covers responses from September 16 through September 28. Data for the first week of the third quarter 2020 is taken from the Census Bureau’s Weeks 10 and 11 Household Pulse Survey, which covers responses from July 2 through July 14).

Notably, confidence in the ability to pay next month’s rent grew most substantially for lower-earning renter households. From the beginning to the end of the third quarter, an additional 7.9% of renter households earning less than $75,000 per year reported “high confidence” in their ability to pay next month’s rent. This compares favorably to renters earning more than $75,000 per year, which improved by a slightly lower 6.2%. However, confidence levels were already consistently high among the latter cohort.


Small multifamily units tend to be located further away from job centers compared to high-rise large multifamily properties. By extension, these properties tend to have renters with lower average income levels. Keeping an eye on different cross-sections of renters and how they weather the ongoing recession will continue to provide clues about risks in the small multifamily subsector compared to the rest of the apartment market.

Leverage and Debt Yields

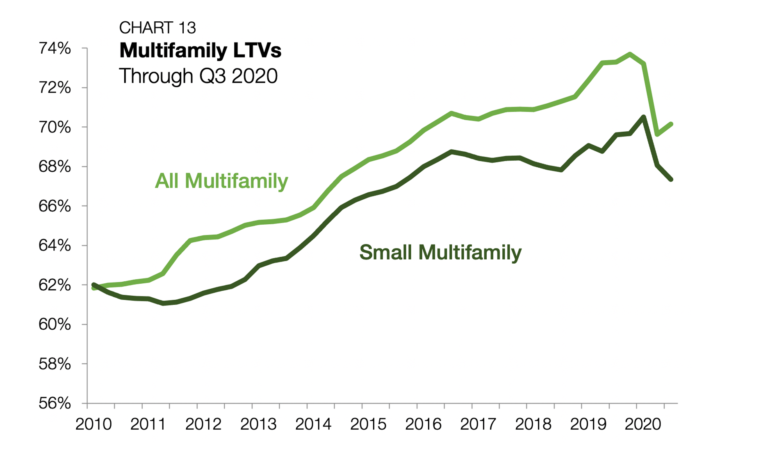
Loan-to-value ratios (LTVs) averaged 67.3% on small multifamily loans originated during the third quarter of 2020, dropping a sizeable 71 bps from the second quarter. This is the second consecutive quarter of material declines in leveraging, as small multifamily LTVs fell by an even more impressive 247 bps in the second quarter (Chart 13).


Across the rest of the sector, LTVs similarly fell between the first and second quarters, dropping substantially by 358 bps, but have since started an upward climb. Between the second and third quarters, LTVs across the entire multifamily sector rose 51 bps to 71.2%.


According to Chandan Economics’ initial estimates, the LTV spread between small multifamily and all multifamily currently stands at 280 bps. A selection bias in the small multifamily subsector may partially explain these trends. By some estimates, as much as one-third of community banks that typically lend in the small multifamily space have pulled back on their originations due to the pandemic. As a result, lenders that are still active are fielding a larger number of requests, leading to greater selectivity and improved credit quality on new deals.


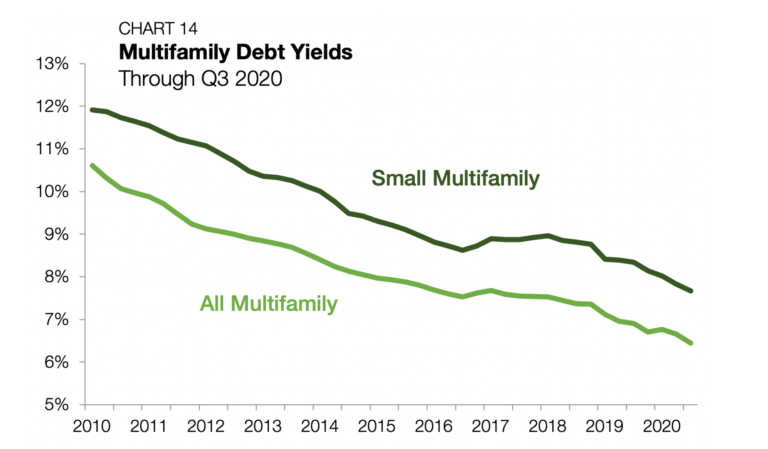
Debt yields, the ratio of NOI and loan balance, for small multifamily loans decreased by 16 bps to 7.7% in the third quarter of 2020, hitting the lowest reading on record (Chart 14).

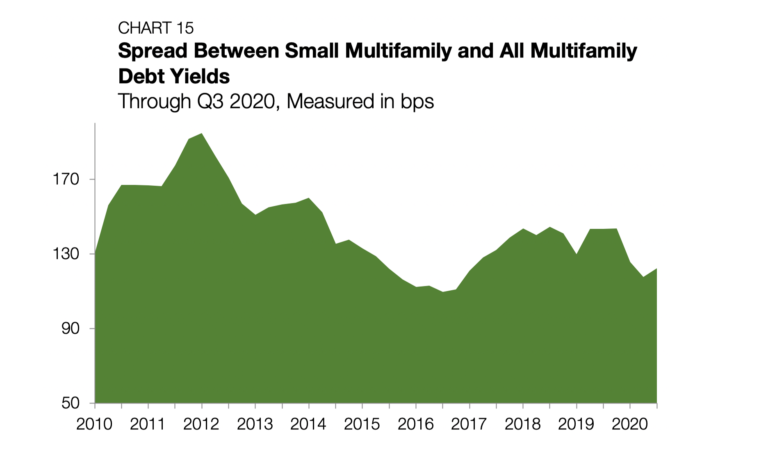
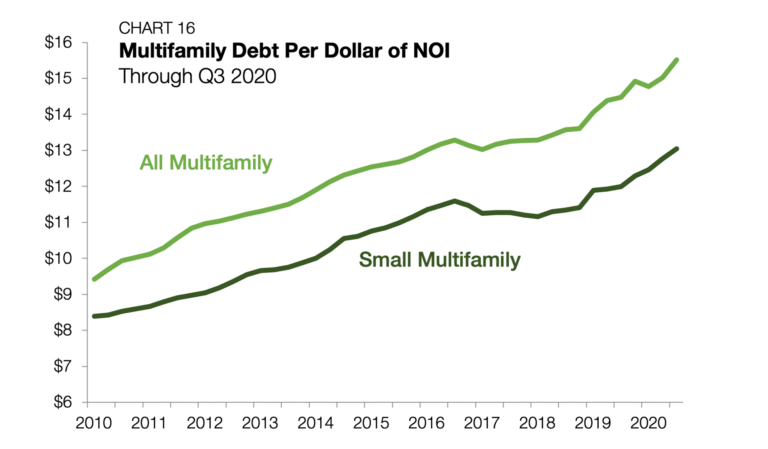
For all multifamily properties, debt yields fell by 21 bps to 6.5%. The spread between small multifamily and all multifamily debt yields has moderated since the middle of 2017 and currently sits at 122 bps (Chart 15). Debt per dollar of NOI, the inverse of debt yields, rose for both small multifamily and all multifamily loans in the third quarter. Small multifamily borrowers are securing an average of $13.04 in new debt for every $1.00 of property NOI, up $.27 from the prior quarter and $1.06 from last year (Chart 16). Together, these trends may reflect the overweighting of refinancing transactions, and a selection bias that skews towards high-quality, well-performing assets.

Outlook

While so much about the macroeconomic road ahead remains uncertain, at least one debate from the early days of the shutdown appears settled: This is not a V-shaped recovery. Assuming the best-case scenario of vaccine approvals and availability, it will still take several months, if not longer, to put the crisis fully behind us. In short, living with the virus is, and will be, the status quo for the immediate future.


Despite headwinds caused by the pandemic’s recession, the small multifamily subsector is maintaining its penchant for stability. While small multifamily has a supportive set of defining market features behind it, a critical caveat is that buyers and sellers remain far apart in their opinions of fair value. Plus, the vulnerability of the small multifamily tenant base to labor market malaise remains a risk factor. Yet these areas of softness are considered transitory.


Small multifamily renters, especially those who are renters by necessity, are less likely to transition into homeownership over the near term. Moreover, the depth of liquidity made possible by agency financing is a powerful lifeline to existing owners, and it should continue to fortify the sector through the eventual end of the COVID-19 crisis.

For more small multifamily research and insights, visit arbor.com/articles

Disclaimer All content is provided herein “as is” and neither Arbor Realty Trust, Inc. or Chandan Economics, LLC (“the Companies”) nor their affiliated or related entities, nor any person involved in the creation, production and distribution of the content make any warranties, express or implied. The Companies do not make any representations regarding the reliability, usefulness, completeness, accuracy, currency nor represent that use of any information provided herein would not infringe on other third party rights. The Companies shall not be liable for any direct, indirect or consequential damages to the reader or a third party arising from the use of the information contained herein.