The single-family rental (SFR) sector continued to demonstrate resilience through early 2026, supported by stable occupancy, positive rent growth, and improving capital markets activity.
Single-Family Rental Investment Trends Report Q2 2026
Capital Markets Gain Momentum as SFR Fundamentals Stabilize
Key Findings
-
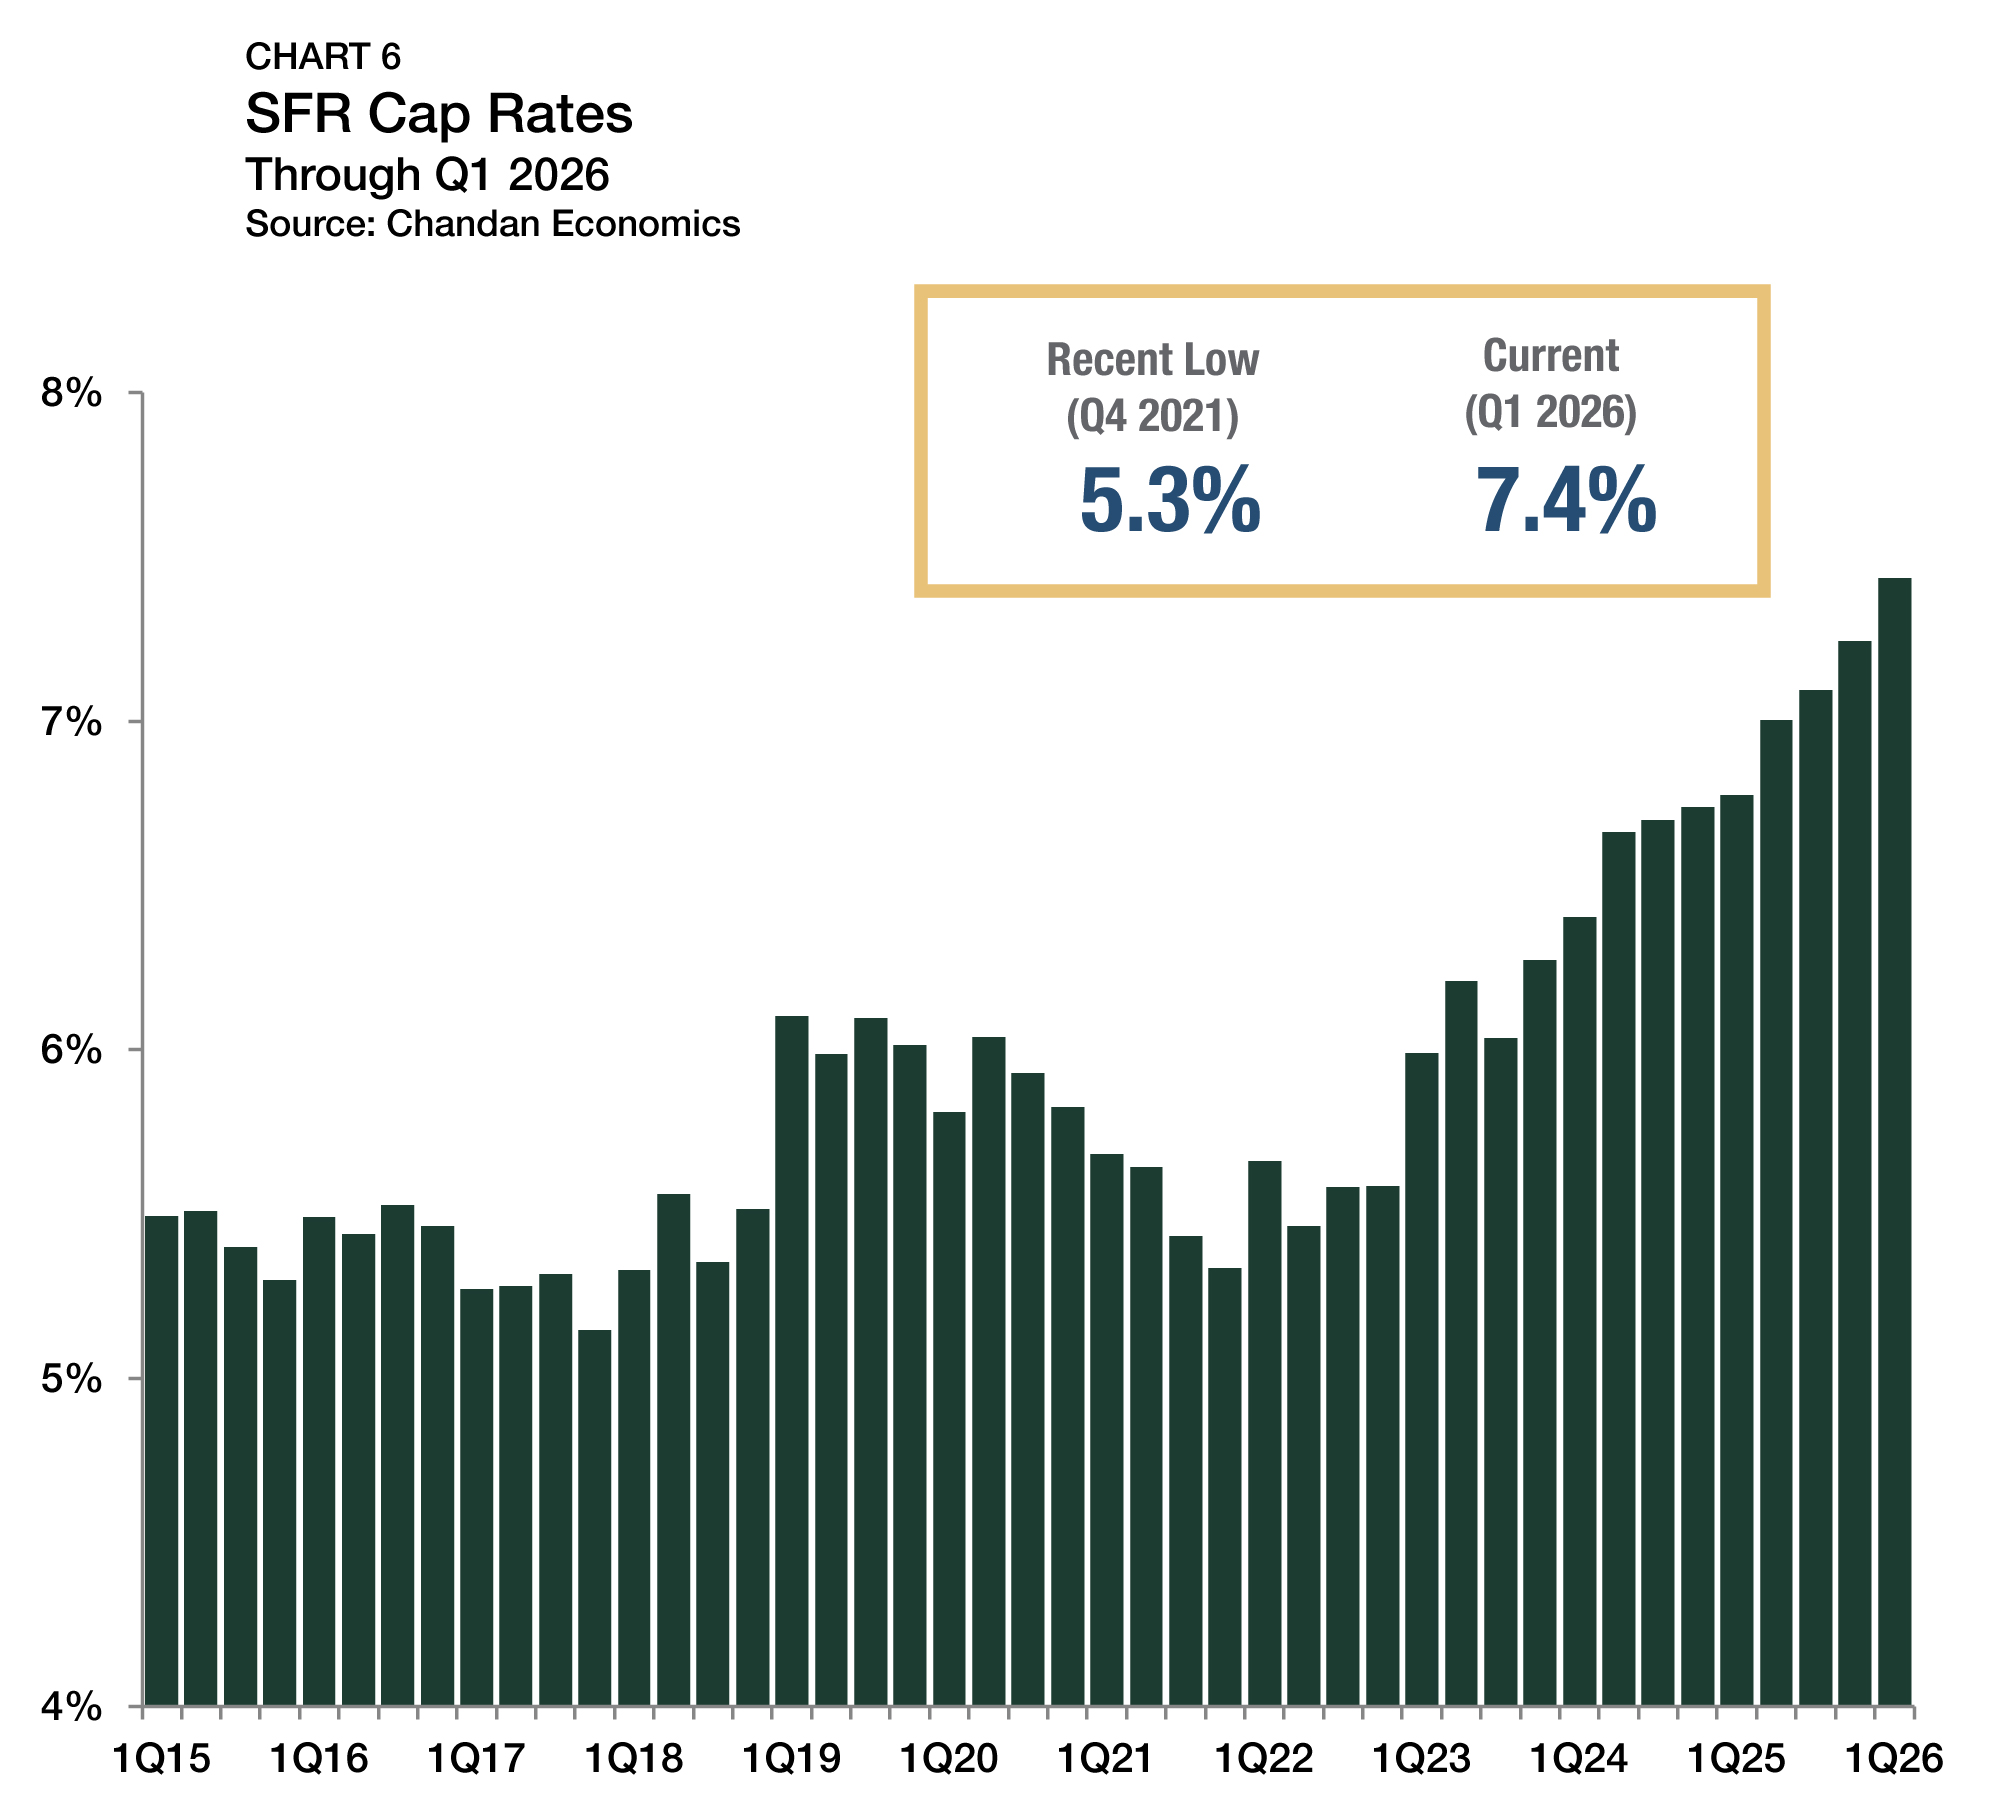
Single-family rental (SFR) cap rates rose for a 10th consecutive quarter and have expanded by more than two percentage points since 2021.
-
All 50 of the largest SFR markets in the U.S. recorded positive year-over-year rent growth in April 2026.
-
SFR capital markets activity continued to improve, supported by steady CMBS issuance and stronger REIT acquisition activity.
State of the Market
The single-family rental (SFR) sector continued to demonstrate resilience through early 2026, supported by stable occupancy, positive rent growth, and improving capital markets activity. Occupancy in the sector held near its long-run average in the first quarter, while annual rent growth remained positive nationally and in every one of the 50 largest U.S. metro areas.
From a cash-flow perspective, SFR investment fundamentals adjusted upward. Cap rates rose again in the first quarter, marking their 10th consecutive quarterly increase, and are up more than two percentage points since 2021.
As cost-of-living pressures persist, homeownership affordability has been a consistent driver of rental demand. According to the Federal Reserve Bank of Atlanta, the median U.S. household needed to devote 42.0% of its income to housing payments to buy a home as of March 2026, a higher-than-recommended level that continues to constrain prospective buyers.
Build-to-rent (BTR) development activity remained historically elevated last quarter, while production moderated from a high-water mark in 2024. Although the 21st Century ROAD to Housing Act has introduced near-term uncertainty, SFR continues to build on its momentum from a position of strength within a more mature growth environment.
Performance Metrics
CMBS Issuance
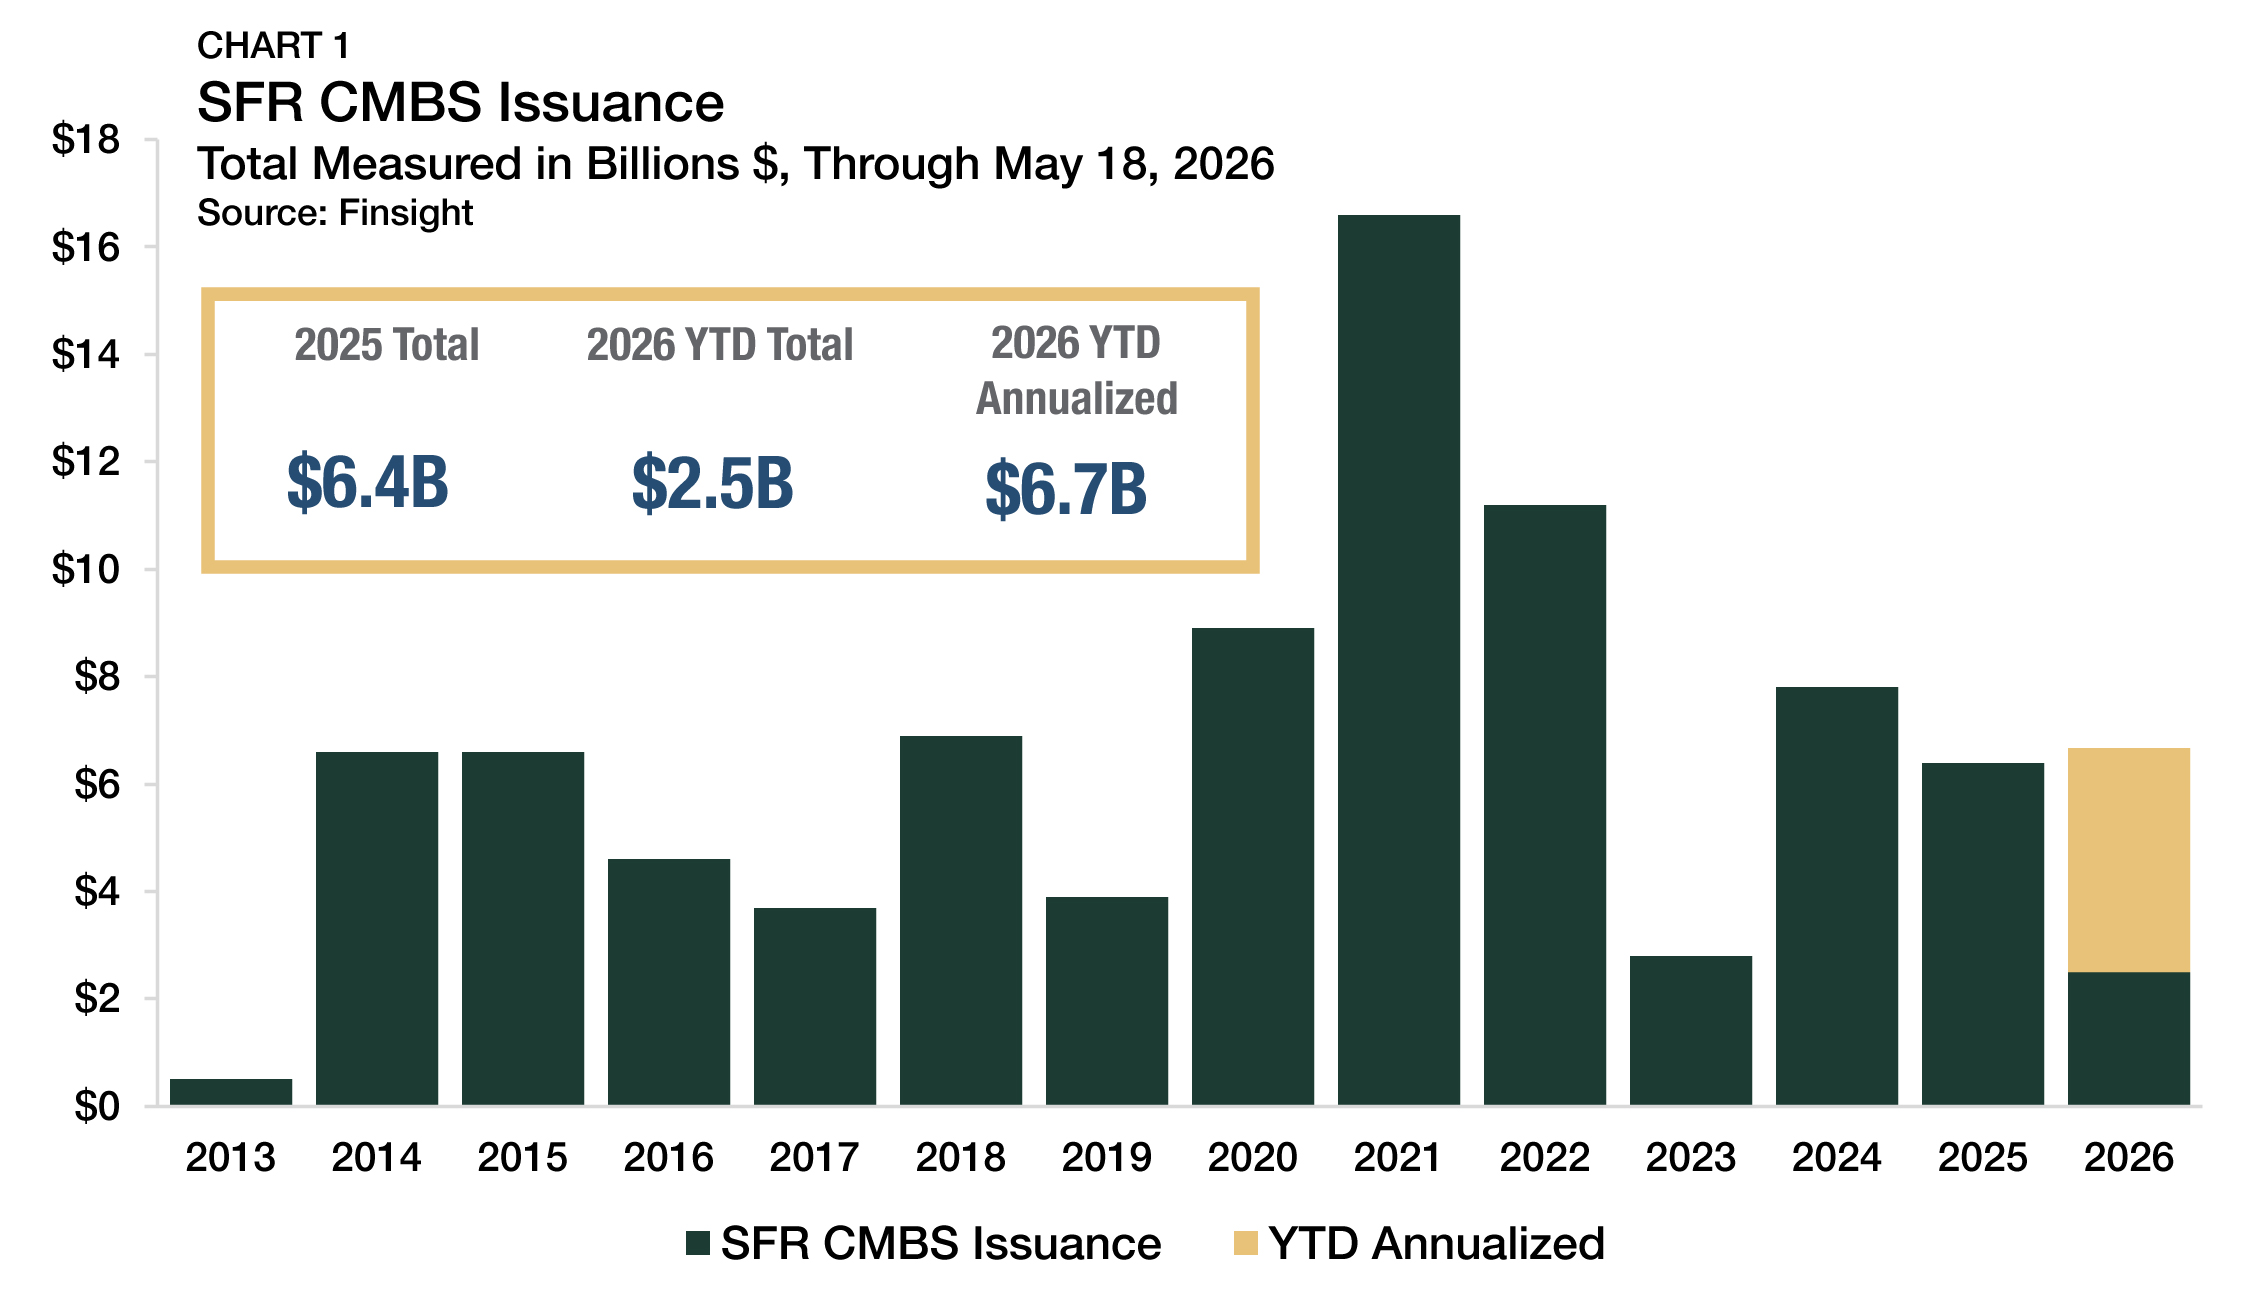
Structured SFR capital markets activity remained steady into 2026. According to Credit Flow, $2.5 billion in SFR CMBS issuance was recorded through mid-May, putting the sector on pace for approximately $6.7 billion in issuance this year (Chart 1). If the pace is sustained, the 2026 total would be slightly above 2025’s $6.4 billion and broadly in line with historical norms.
While deal flow in SFR CMBS can vary significantly throughout the year, recent issuance levels suggest that capital markets remain open and functional. Overall, structured credit conditions continue to reflect a sector operating within a disciplined financing environment, with activity stable and well above 2023’s subdued levels.
REIT Acquisitions & Dispositions
Public SFR REITs increased net acquisition activity through the fourth quarter of 2025, extending a recovery from a pullback in 2022 and early 2023. A Capright analysis of Nareit REIT Industry Tracker data shows net acquisitions reached $0.9 billion in the fourth quarter of 2025, its strongest quarterly performance since 2022 (Chart 2).
The recent acceleration reflects a more constructive transaction environment, with acquisition activity increasingly supported by builder relationships, development partnerships, and portfolio transactions rather than broad-based MLS acquisitions. At the same time, the large-scale disposition activity that characterized portions of 2023 and 2024 has largely subsided.
Overall, recent REIT activity suggests institutional capital markets for SFR have stabilized within a more disciplined operating environment. While acquisition strategies remain selective and underwriting standards relatively conservative, transaction activity increasingly points to a sector that has moved beyond the retrenchment phase that followed the rapid repricing that took place in 2022.
Occupancy
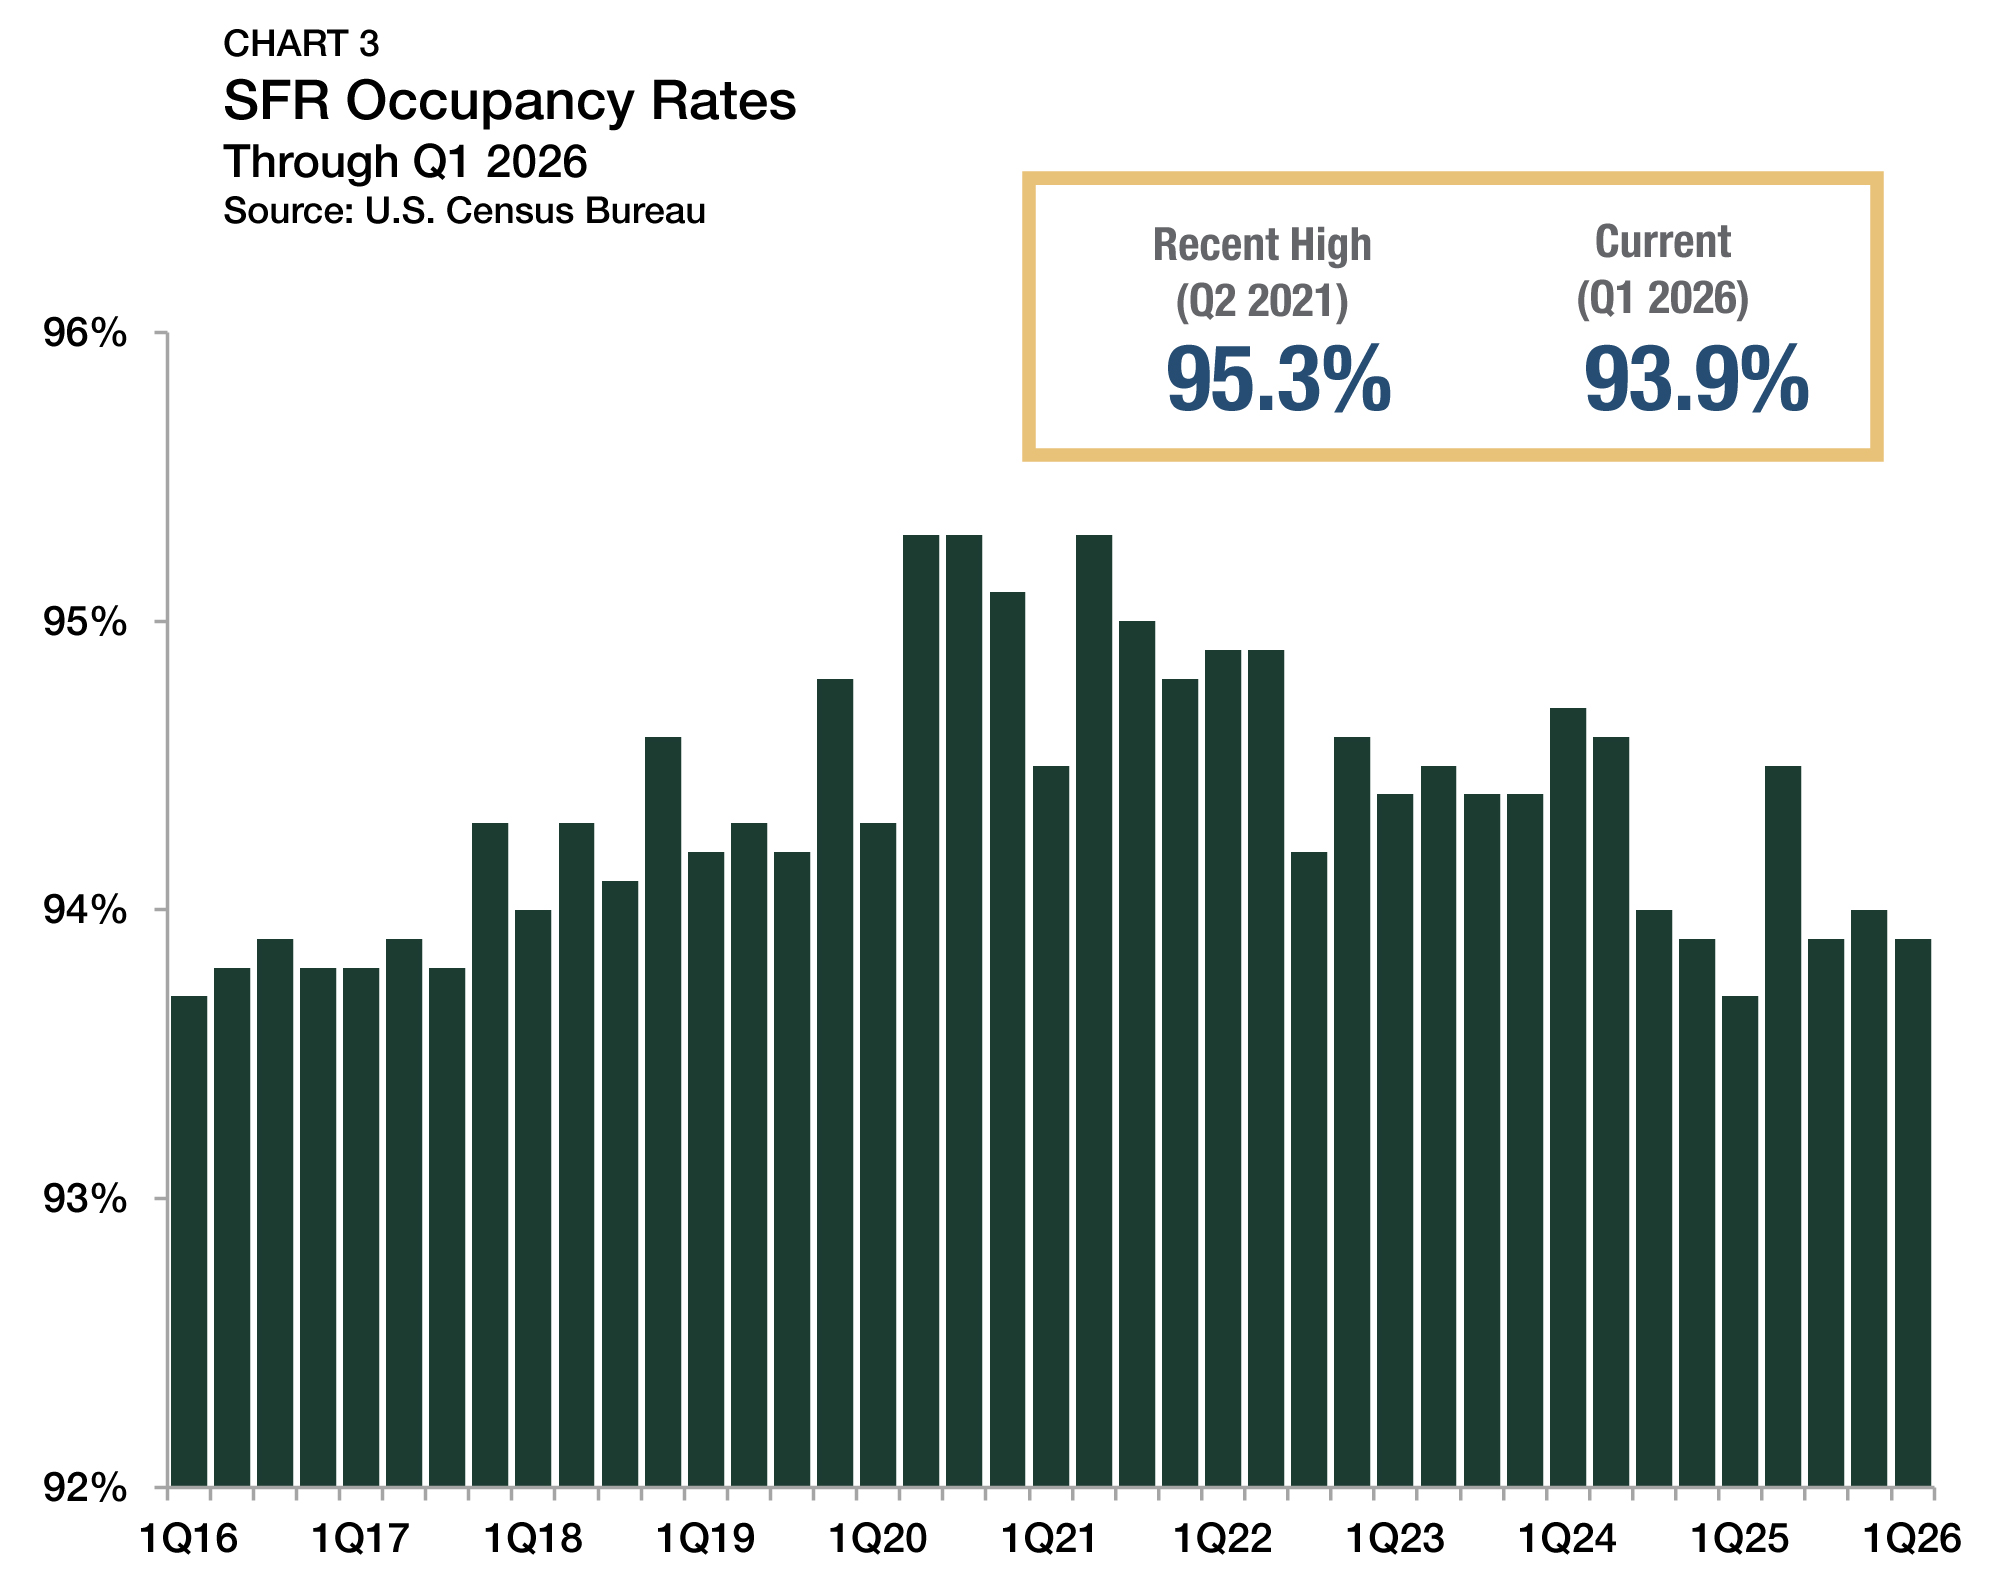
According to the U.S. Census Bureau, SFR occupancy rates averaged 93.9% in the first quarter of 2026, down 0.1 percentage points from the previous quarter but up 0.2 percentage points from the same time last year (Chart 3). While occupancy levels have moderated from a recent high of 95.3% in 2021, they remain broadly stable by historical standards.
Between 2015 and 2019, SFR occupancy rates averaged 94.1%, placing the latest quarterly measurement in line with the pre-pandemic norm. Although occupancy has fluctuated modestly over the past several quarters, current levels continue to reflect a healthy demand environment supported by elevated homeownership costs and limited affordability in the for-sale market.
Rent Growth: National
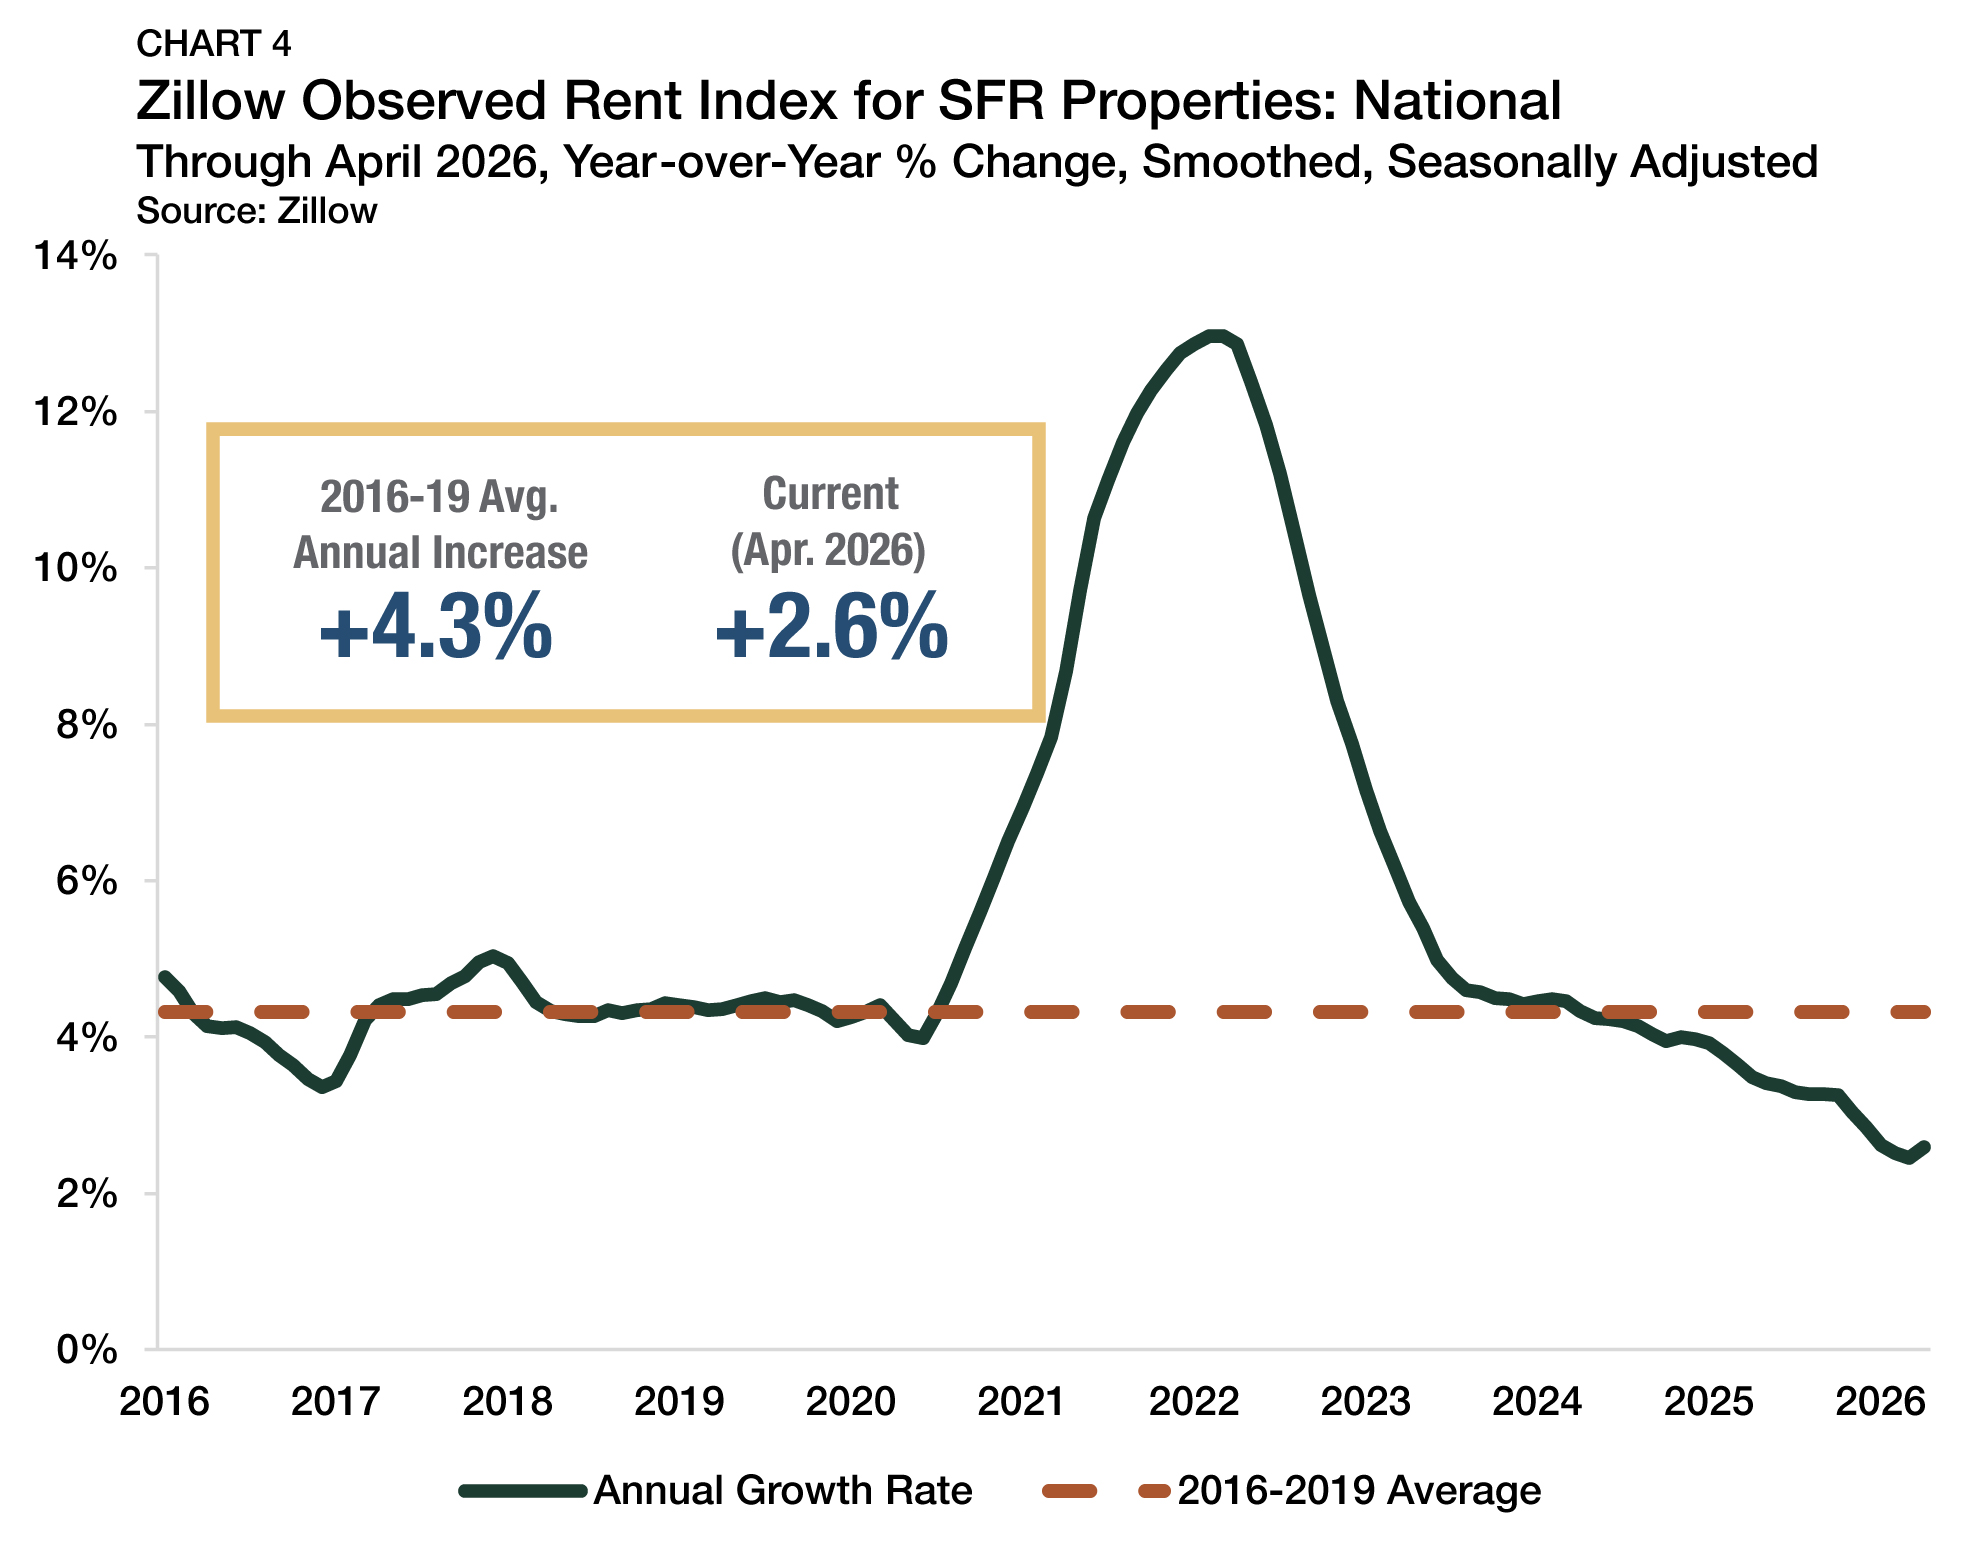
Nationally, SFR rent growth edged higher. According to Zillow’s Observed Rent Index, rents were up 2.6% year-over-year in April 2026 (Chart 4), although below the 2016 through 2019 average of 4.3%. After steadily moderating through much of 2025 and early 2026, April marked the first month since December 2023 in which the year-over-year growth rate increased. While the uptick was modest, it suggests a reversal may be starting. Demand for rental housing continues to be supported by elevated mortgage rates and constrained for-sale affordability, even as rent growth remains well below its earlier-cycle highs.
Rent Growth: Metros
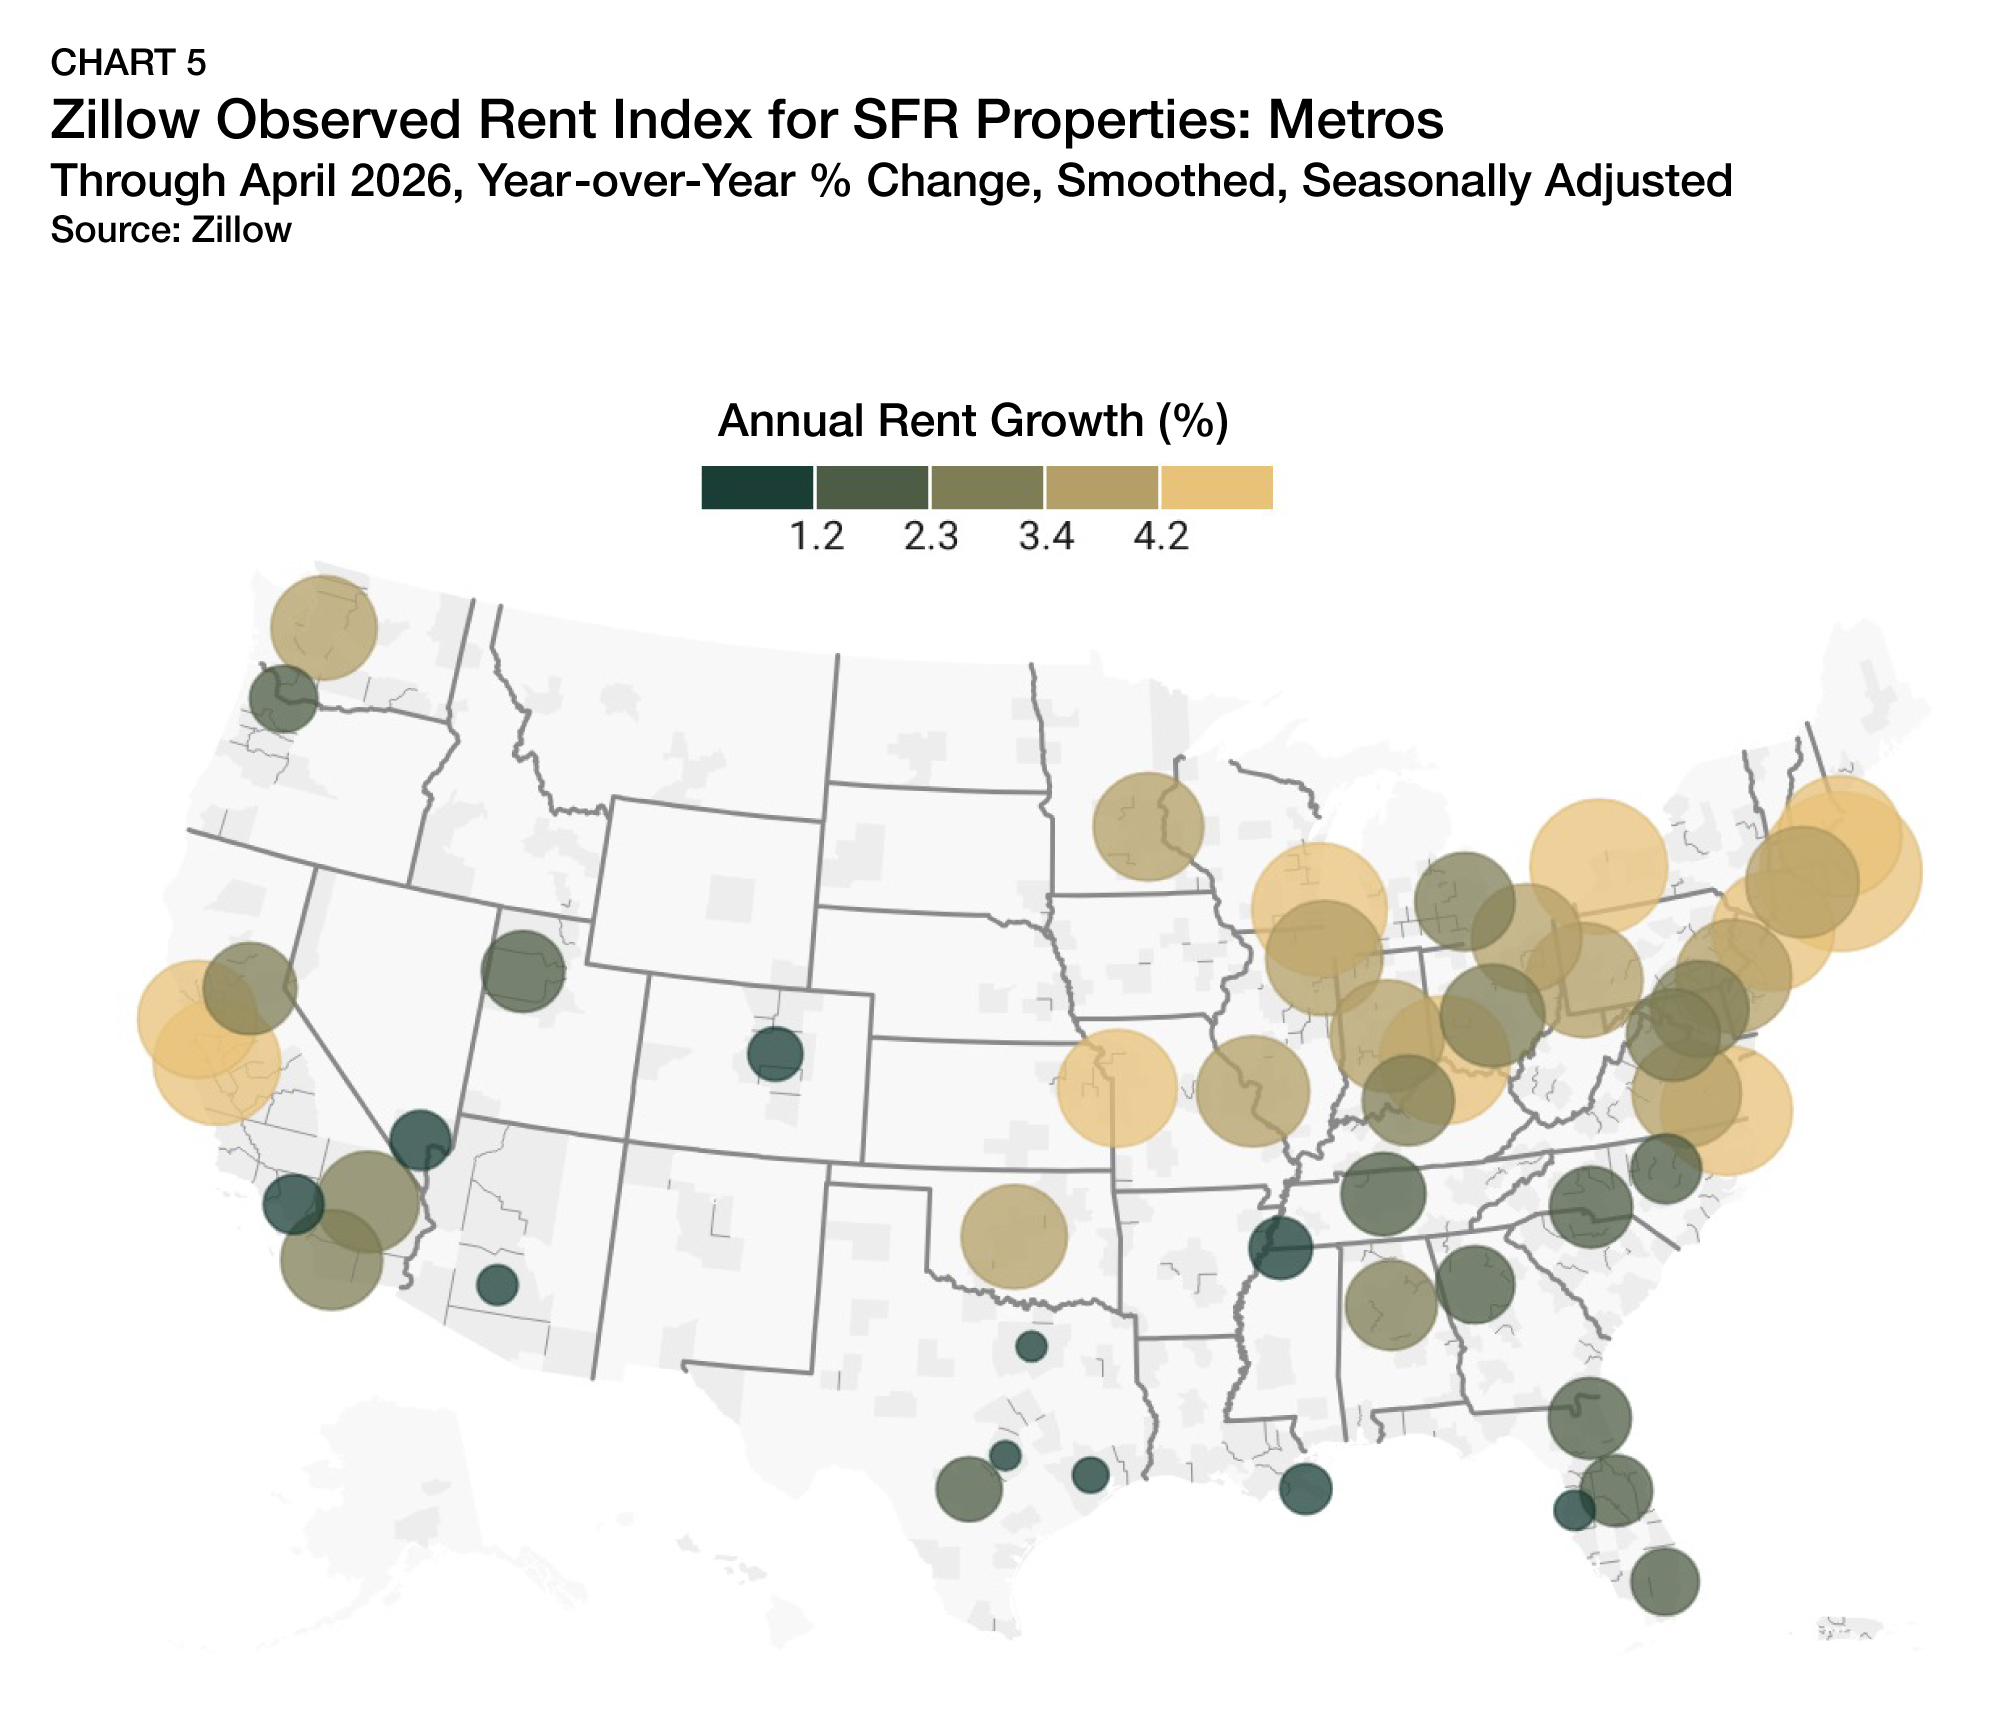
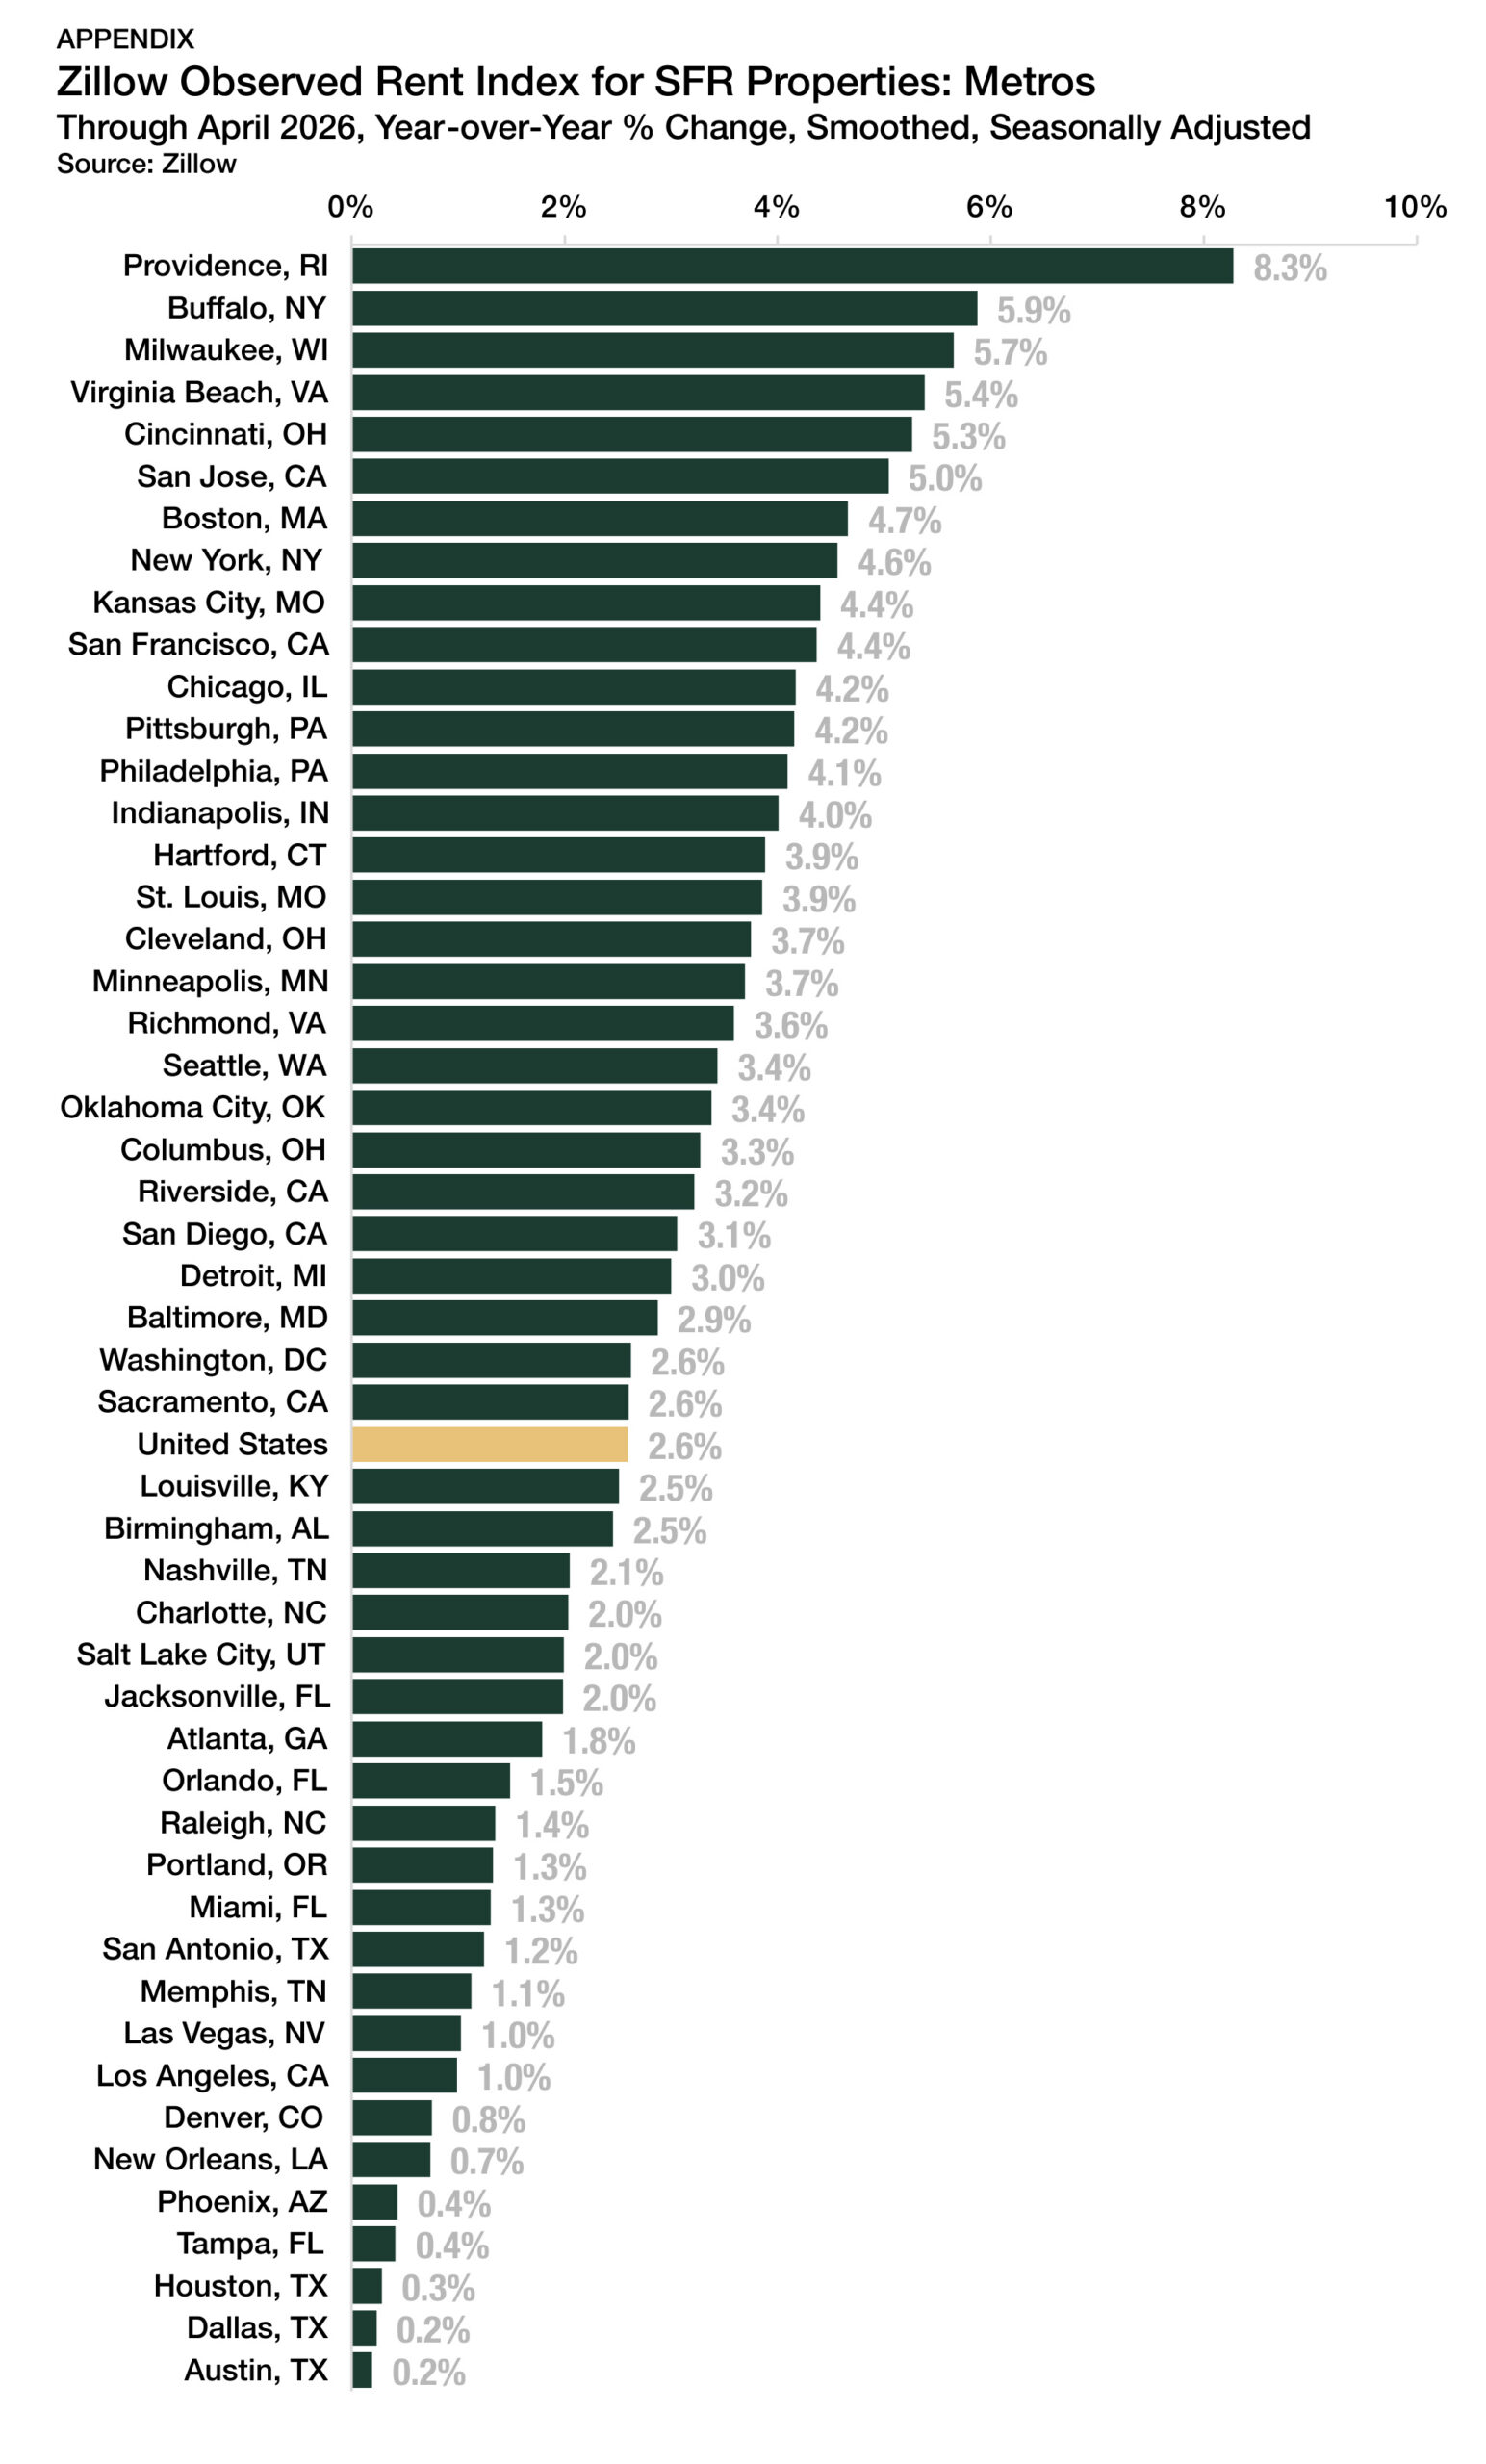
Among the 50 largest U.S. metropolitan areas, Providence, RI, led annual SFR rent growth at 8.3% as of April 2026 (Chart 5). Buffalo, NY (+5.9%) and Milwaukee, WI (+5.7%) followed, while Virginia Beach, VA (+5.4%) and Cincinnati, OH (+5.3%) rounded out the top five. At the national level, rent growth remained strongest across parts of the Northeast and Midwest, where supply conditions have been more balanced than in many high-growth Sun Belt markets.
All 50 major metros recorded positive annual SFR rent growth in April, a modest improvement from the start of the year. However, regional divergence remains pronounced. Several Sun Belt markets, including Austin, TX (+0.2%), Dallas, TX (+0.2%), Houston, TX (+0.3%), Tampa, FL (+0.4%), and Phoenix, AZ (+0.4%), continued to trail the national average.
Cap Rates
SFR cap rates continued to trend upward in the first quarter of 2026, rising 19 basis points (bps) to 7.4% (Chart 6). The increase reflected an ongoing valuation adjustment, as home price growth remained muted and rent gains moderated. Since falling to a low of 5.3% in the fourth quarter of 2021, cap rates have expanded by roughly 210 bps, marking a sustained repricing of the asset class over the past four years. Despite higher cap rates, investor activity remains steady, supported by stable fundamentals and improving income yields relative to asset values.
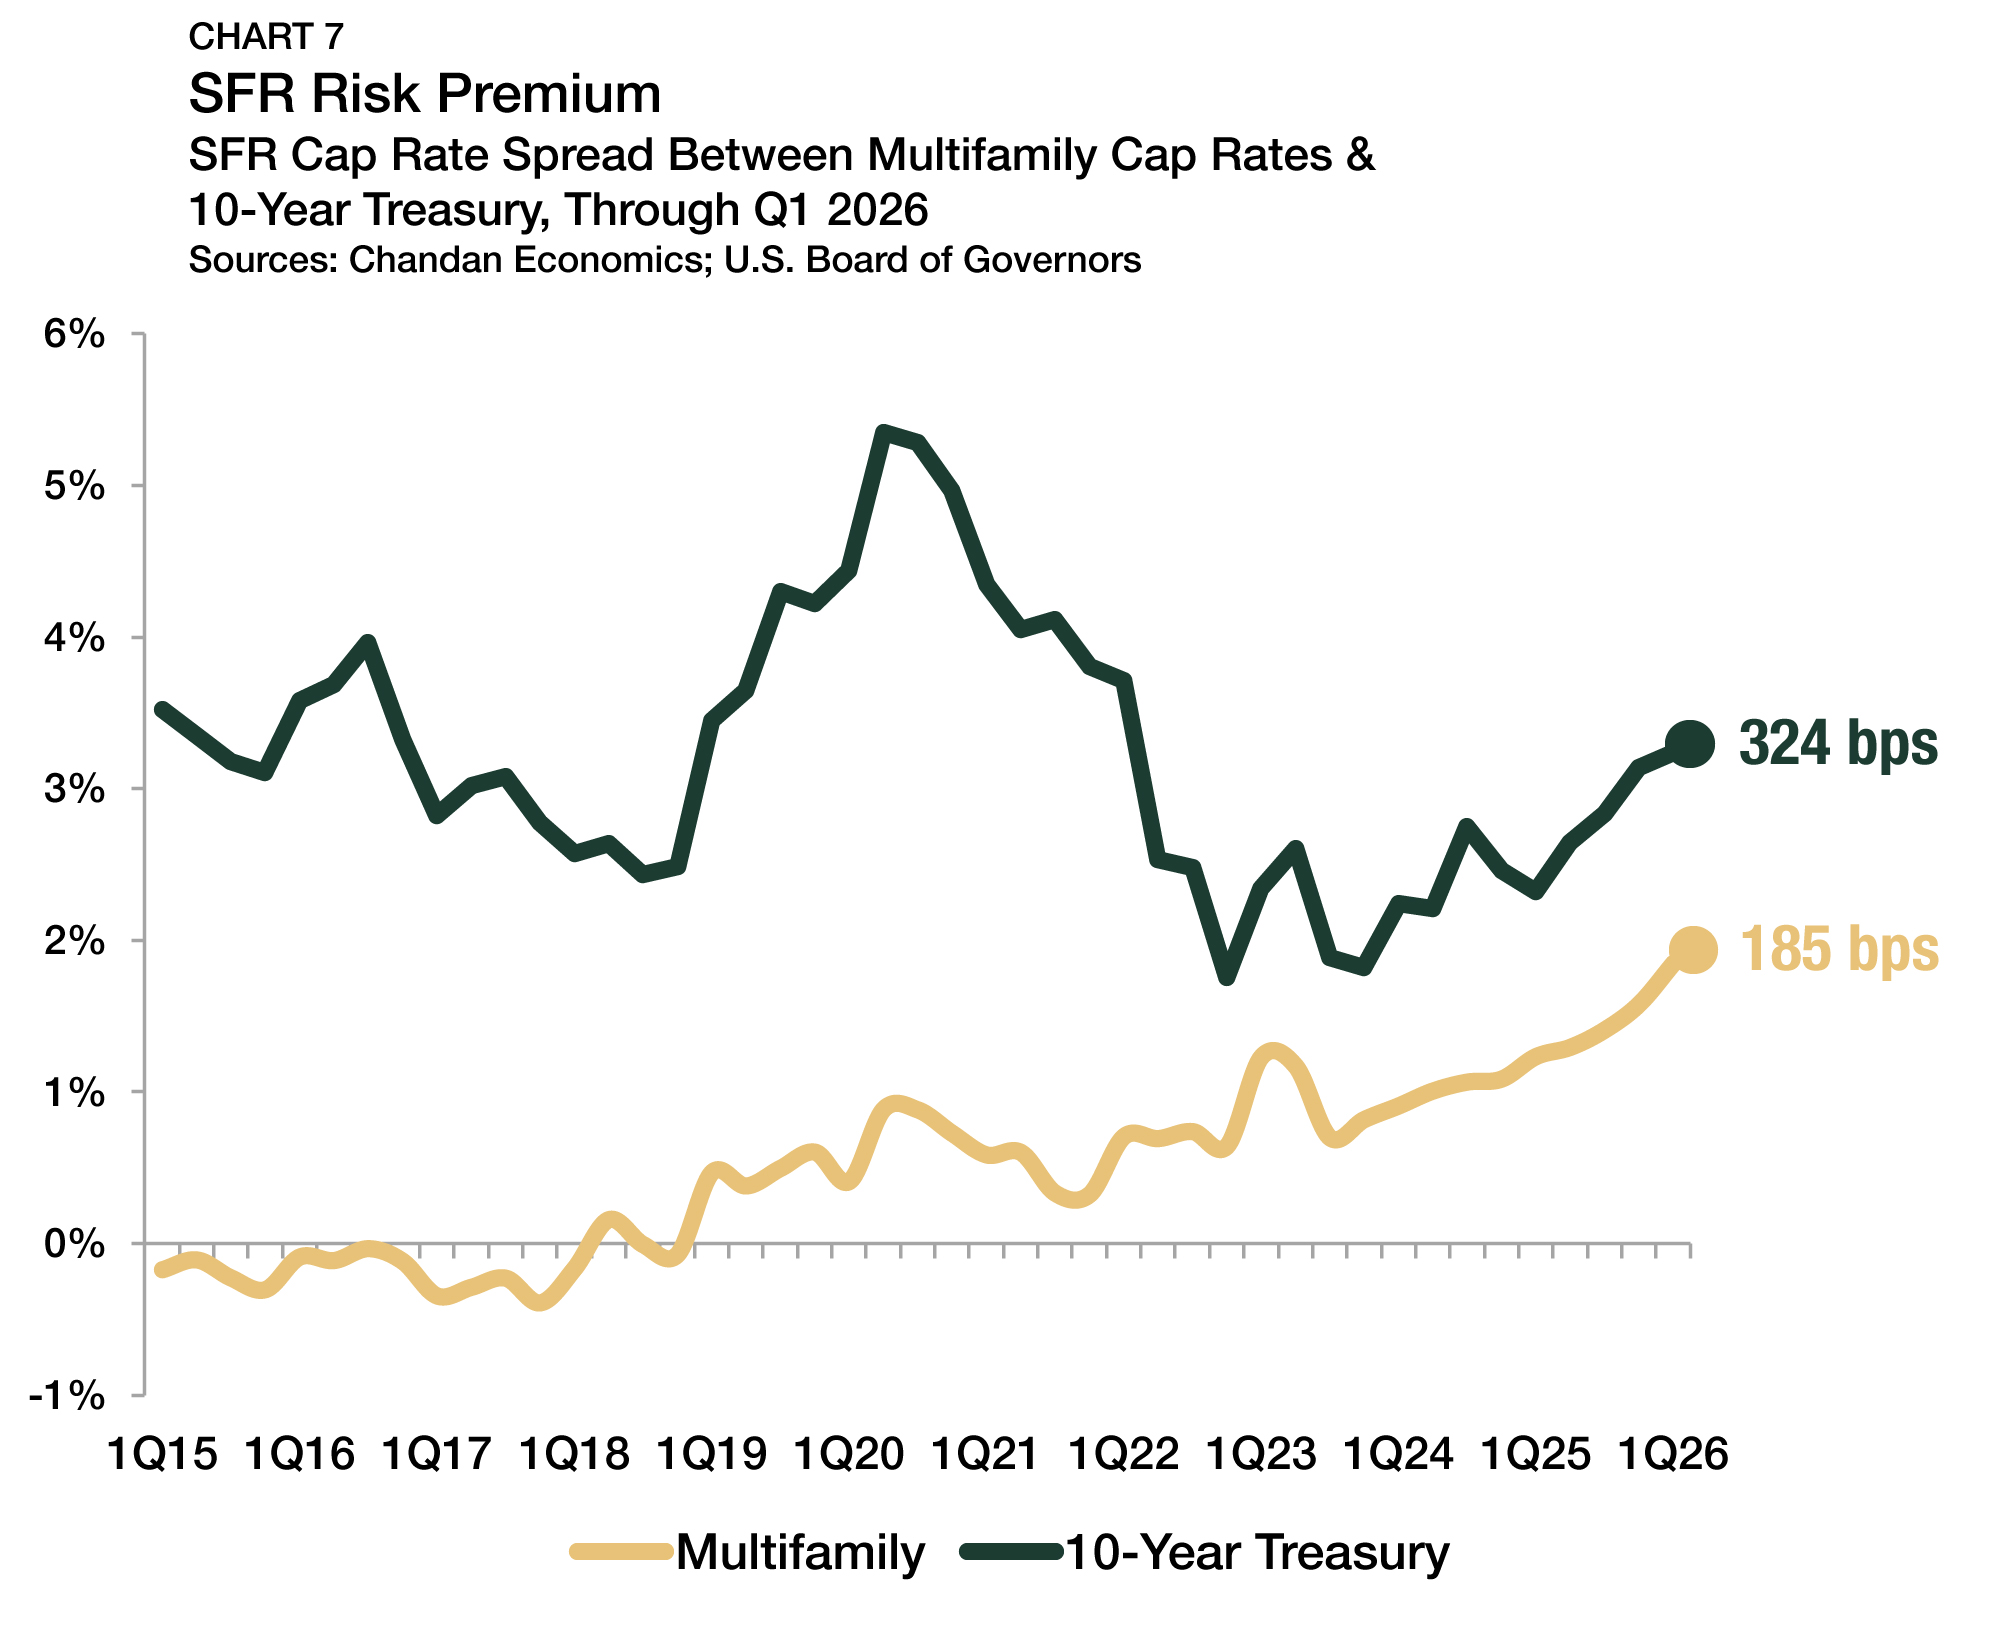
The spread between SFR cap rates and the 10-year Treasury yield — a proxy for the sector’s risk premium — widened to 324 bps in the first quarter (Chart 7), up from 317 bps in the prior quarter. Treasury yields averaged 4.2% during the period. Meanwhile, the spread between single-family rentals and multifamily properties widened to 185 bps, reflecting continued SFR cap rate expansion relative to multifamily pricing.
Home Prices
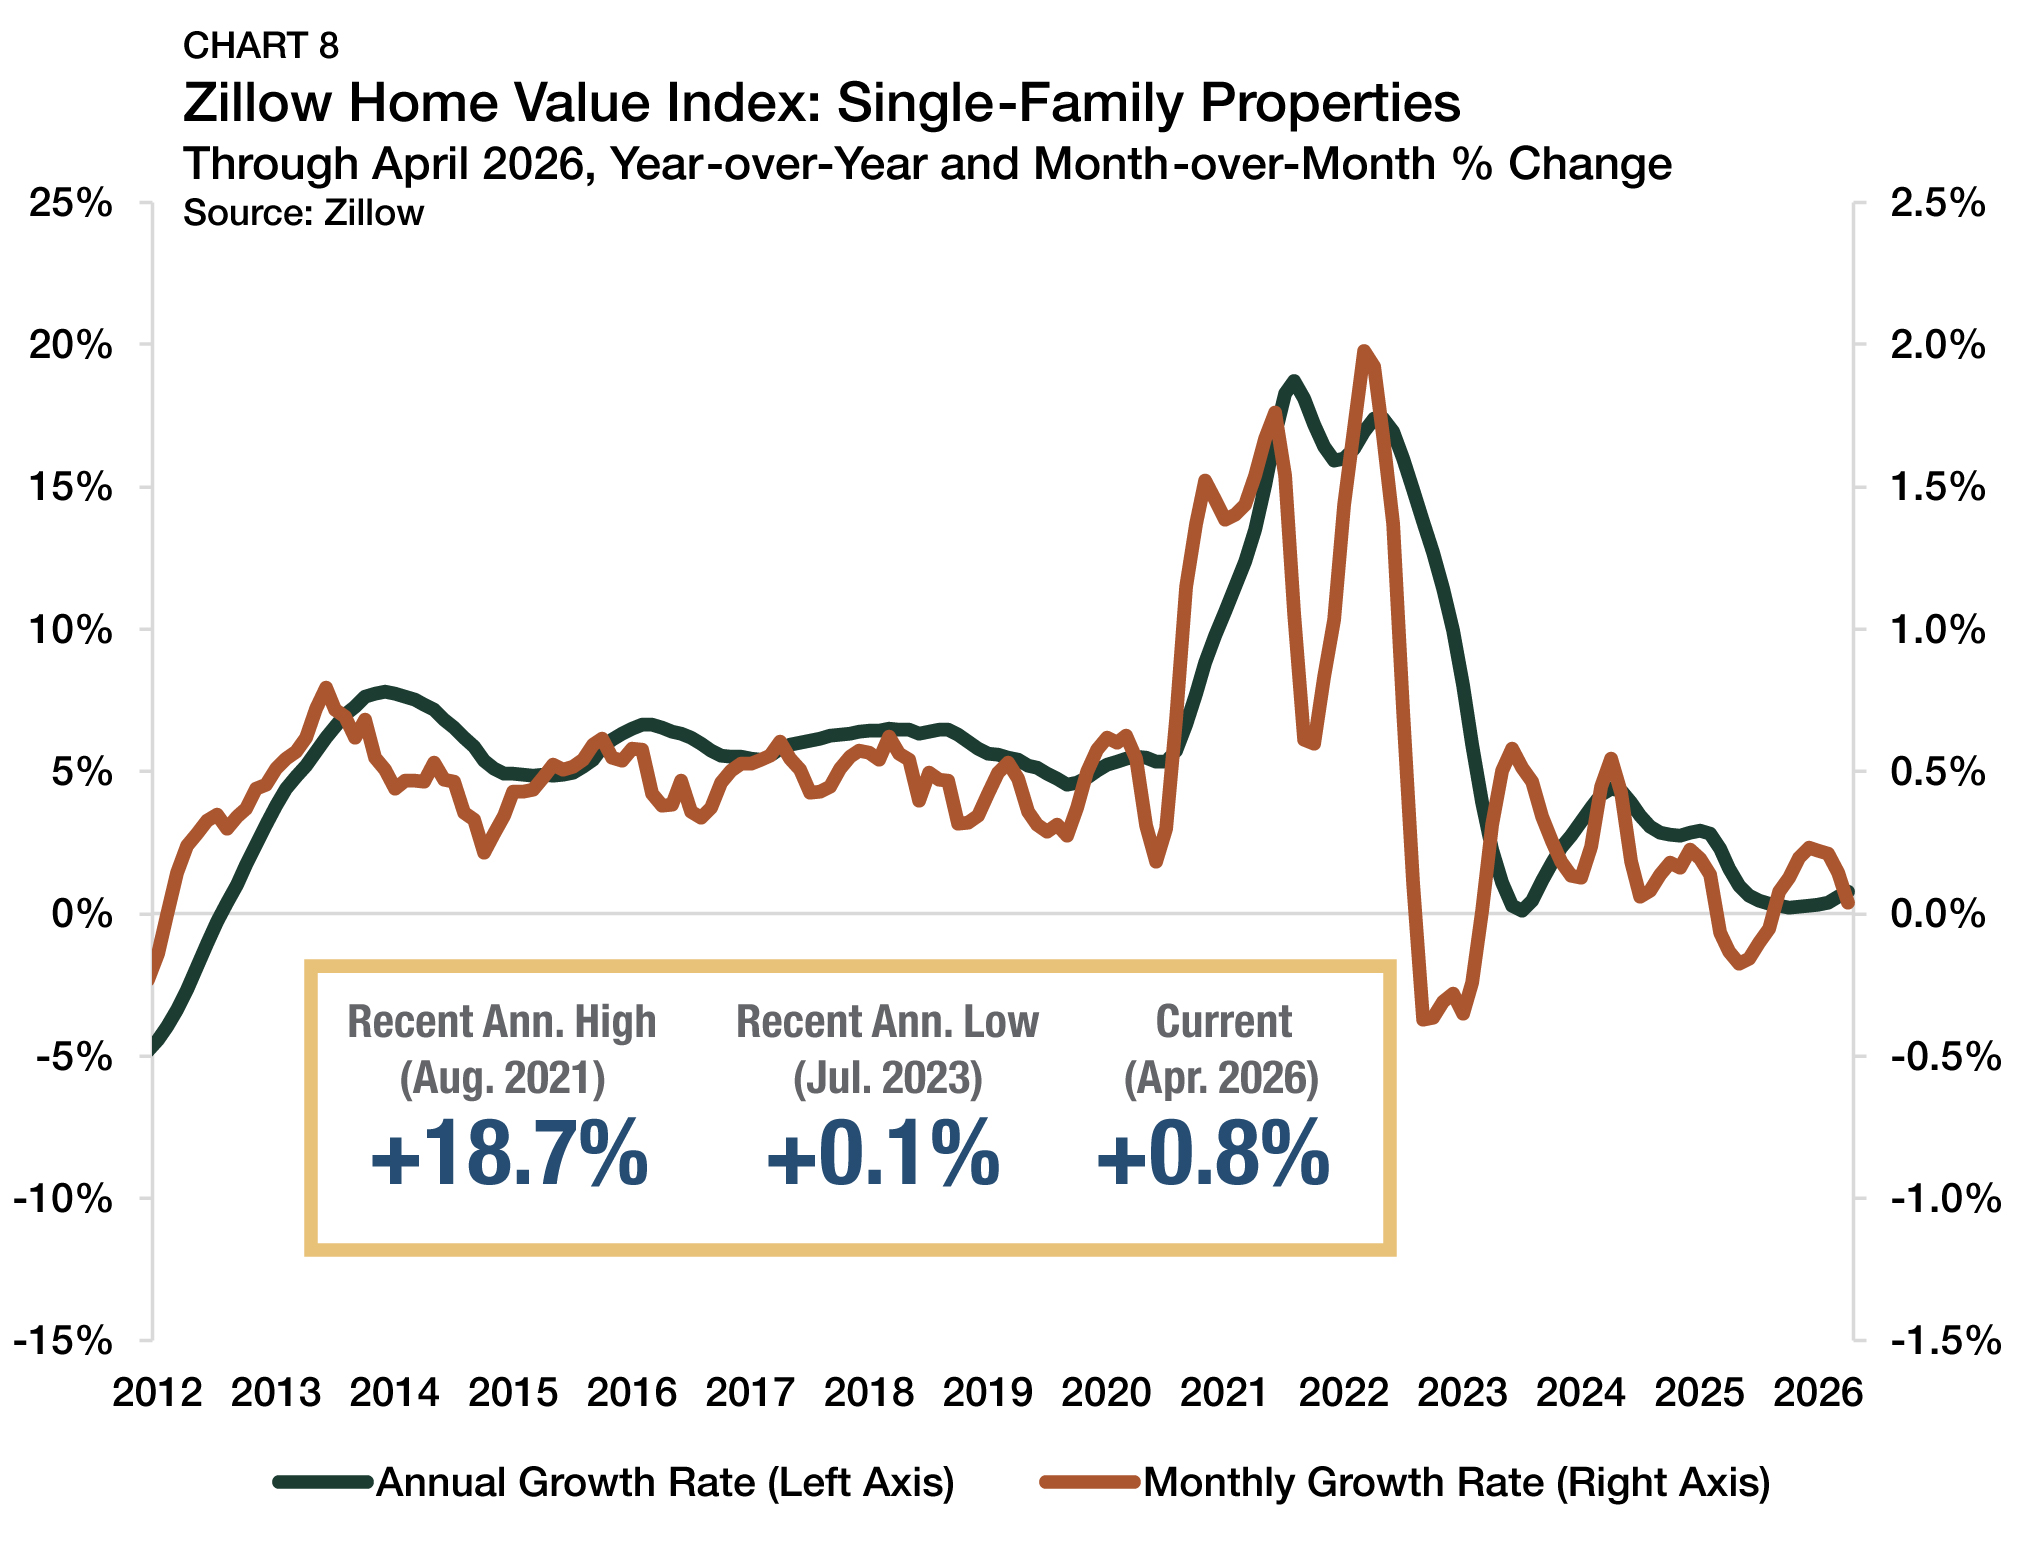
Measured year-over-year, single-family home values remained positive through April 2026, with appreciation firming modestly after softening throughout much of 2025. Zillow’s Home Value Index shows the average U.S. single-family home value rose to $369,848 — up 0.8% from one year ago (Chart 8). While annual price growth remains subdued, the latest reading marks the strongest year-over-year increase since June 2025.
On a month-over-month basis, home values have now increased for eight consecutive months, suggesting that the period of broad-based declines has likely passed. However, monthly gains remain modest, with April’s increase registering below 0.1%. Elevated borrowing costs and affordability constraints continue to limit price momentum, indicating a period of continued stability rather than renewed acceleration.
Debt Yields
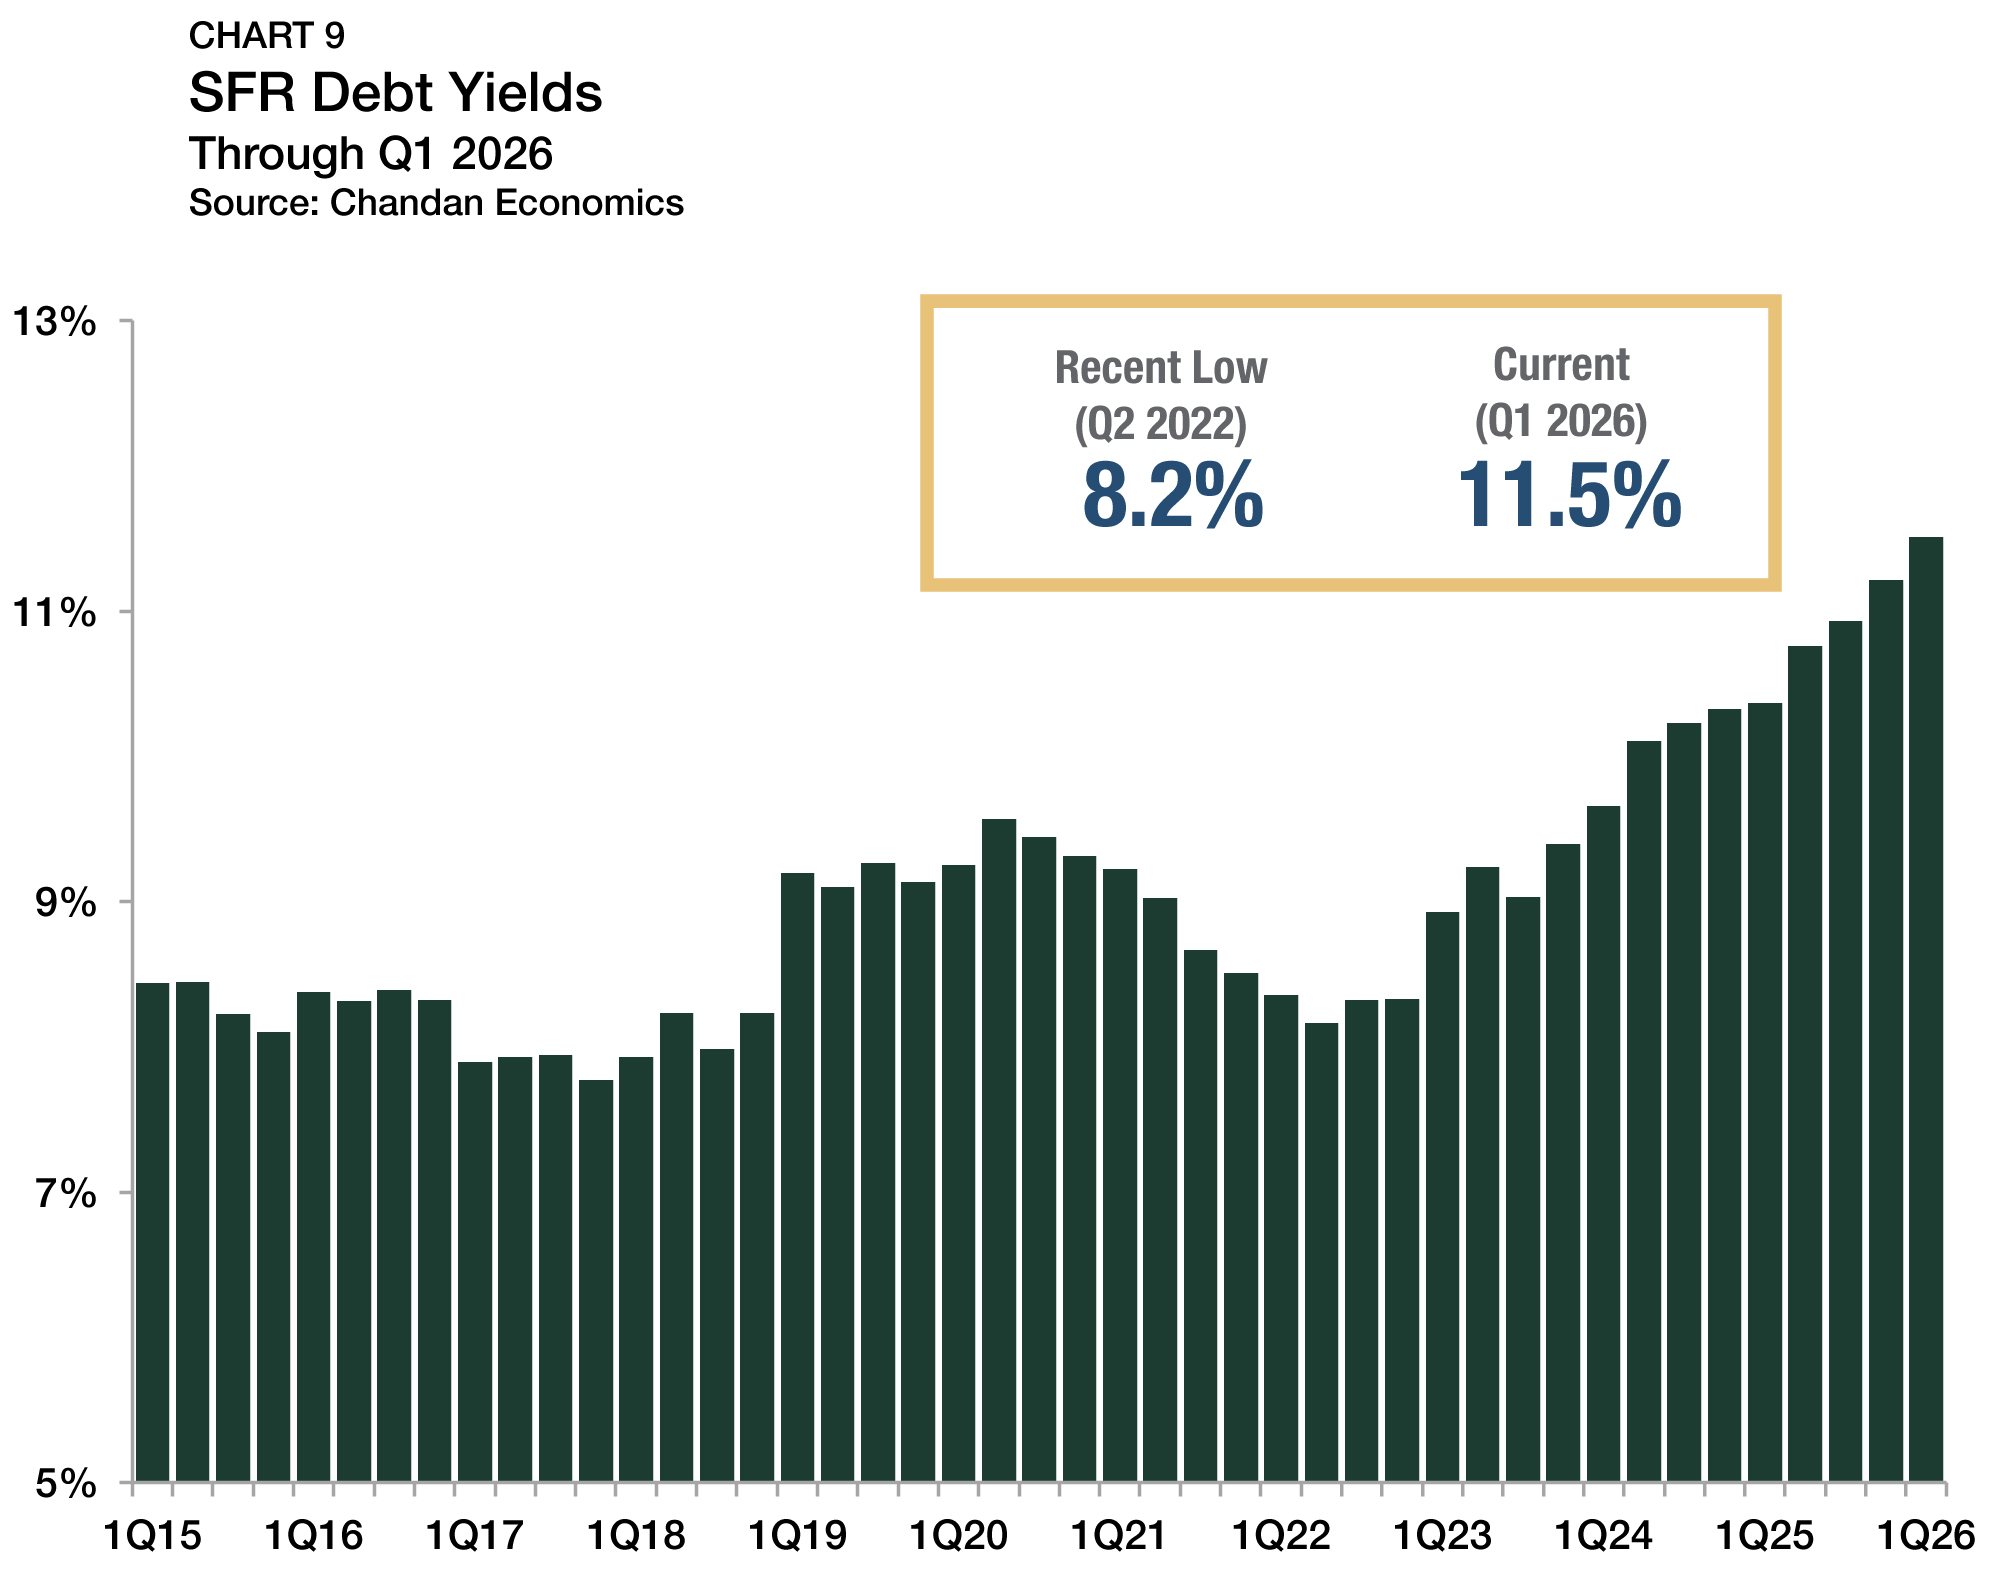
Debt yields — a key measure of credit risk — continued to rise in the first quarter of 2026, increasing 30 basis points to 11.5% (Chart 9). Compared with the recent low of 8.2% in the second quarter of 2022, debt yields have climbed 330 bps, underscoring lenders’ sustained preference for stronger cash-flow cushions and lower leverage in an uncertain interest-rate environment.
These higher yields translate into tighter loan proceeds. In the first quarter of 2026, investors obtained an average of $8.69 of debt per $1.00 of net operating income (NOI) — down $3.56 from the 2022 peak and $0.95 from one year earlier. As underwriting remains disciplined, capital continues to favor stabilized assets and portfolios demonstrating durable operating performance.
Residential Distress
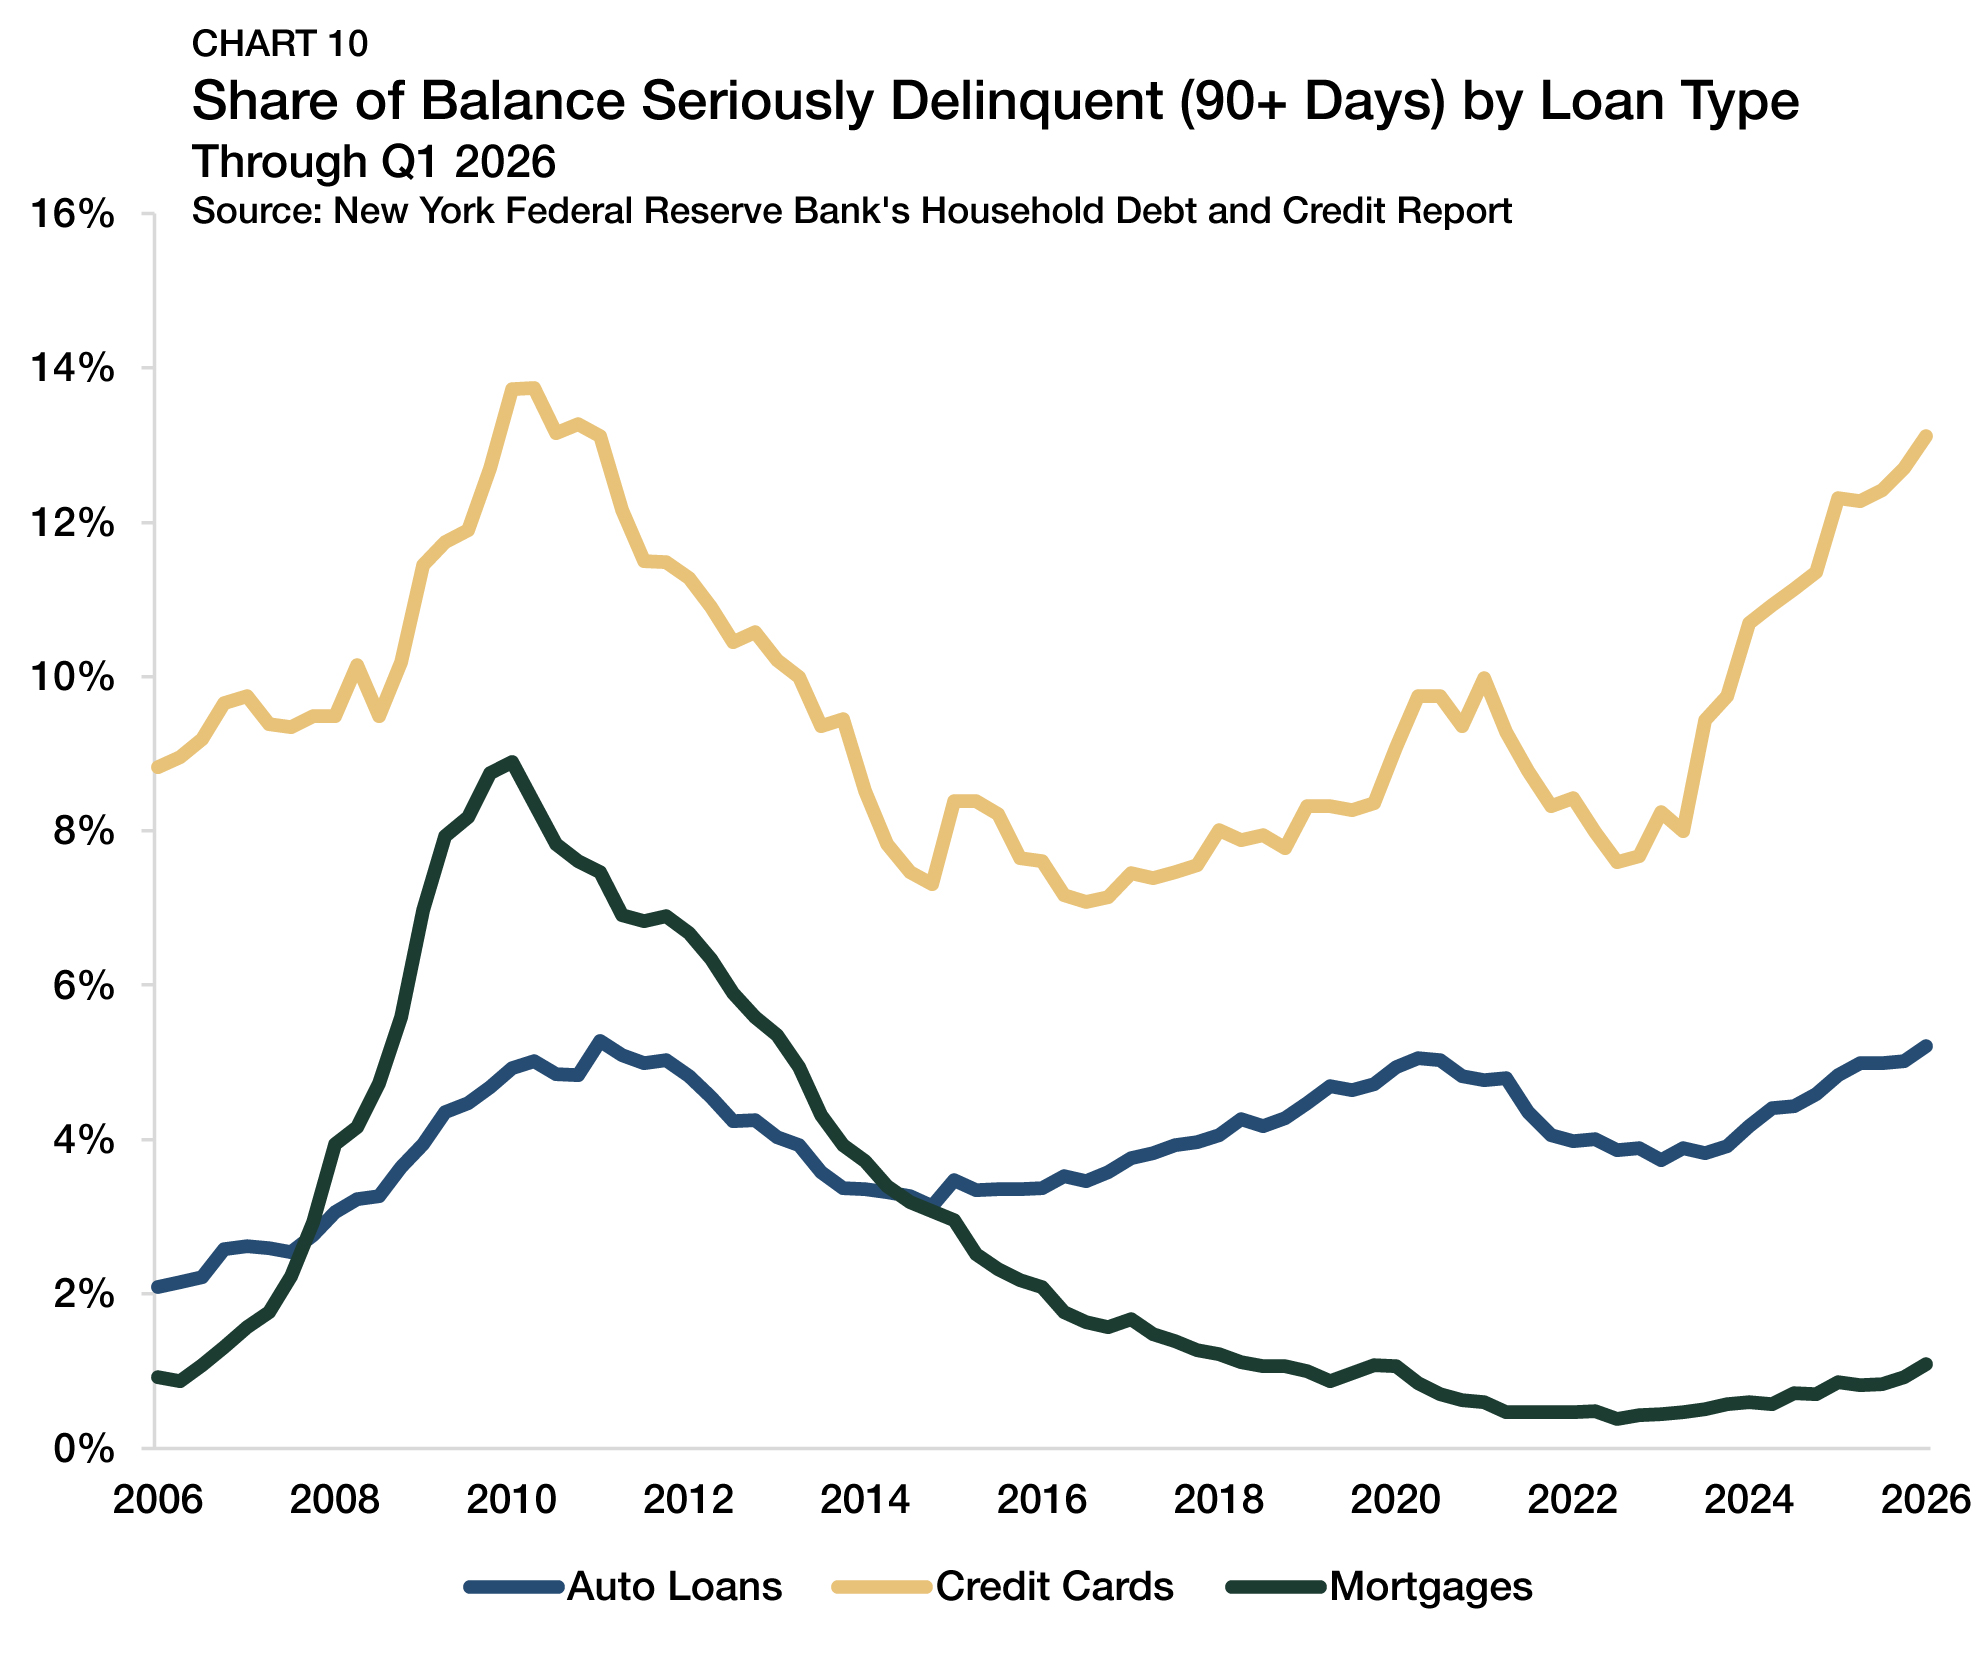
Distress across the U.S. housing market remained contained in early 2026. According to the Federal Reserve Bank of New York’s Quarterly Report on Household Debt and Credit, the share of mortgage balances more than 90 days delinquent was 1.1% in the first quarter of 2026 (Chart 10), up from 0.9% in the prior quarter. While mortgage delinquencies have edged higher from pandemic-era lows, they remain low by historical standards and well below the peaks observed during the Global Financial Crisis.
In contrast to other major consumer debt categories, mortgage performance remains comparatively stable. Current distress conditions also remain far removed from the environment that enabled large-scale distressed single-family acquisitions following the Global Financial Crisis. Serious delinquency rates for credit cards and auto loans have risen more sharply, reaching 13.1% and 5.6%, respectively, in the first quarter. Within SFR, delinquency rates also remain contained, with Morningstar DBRS data showing SFR CMBS delinquencies below 2% near the end of 2025.
Build-to-Rent (BTR)
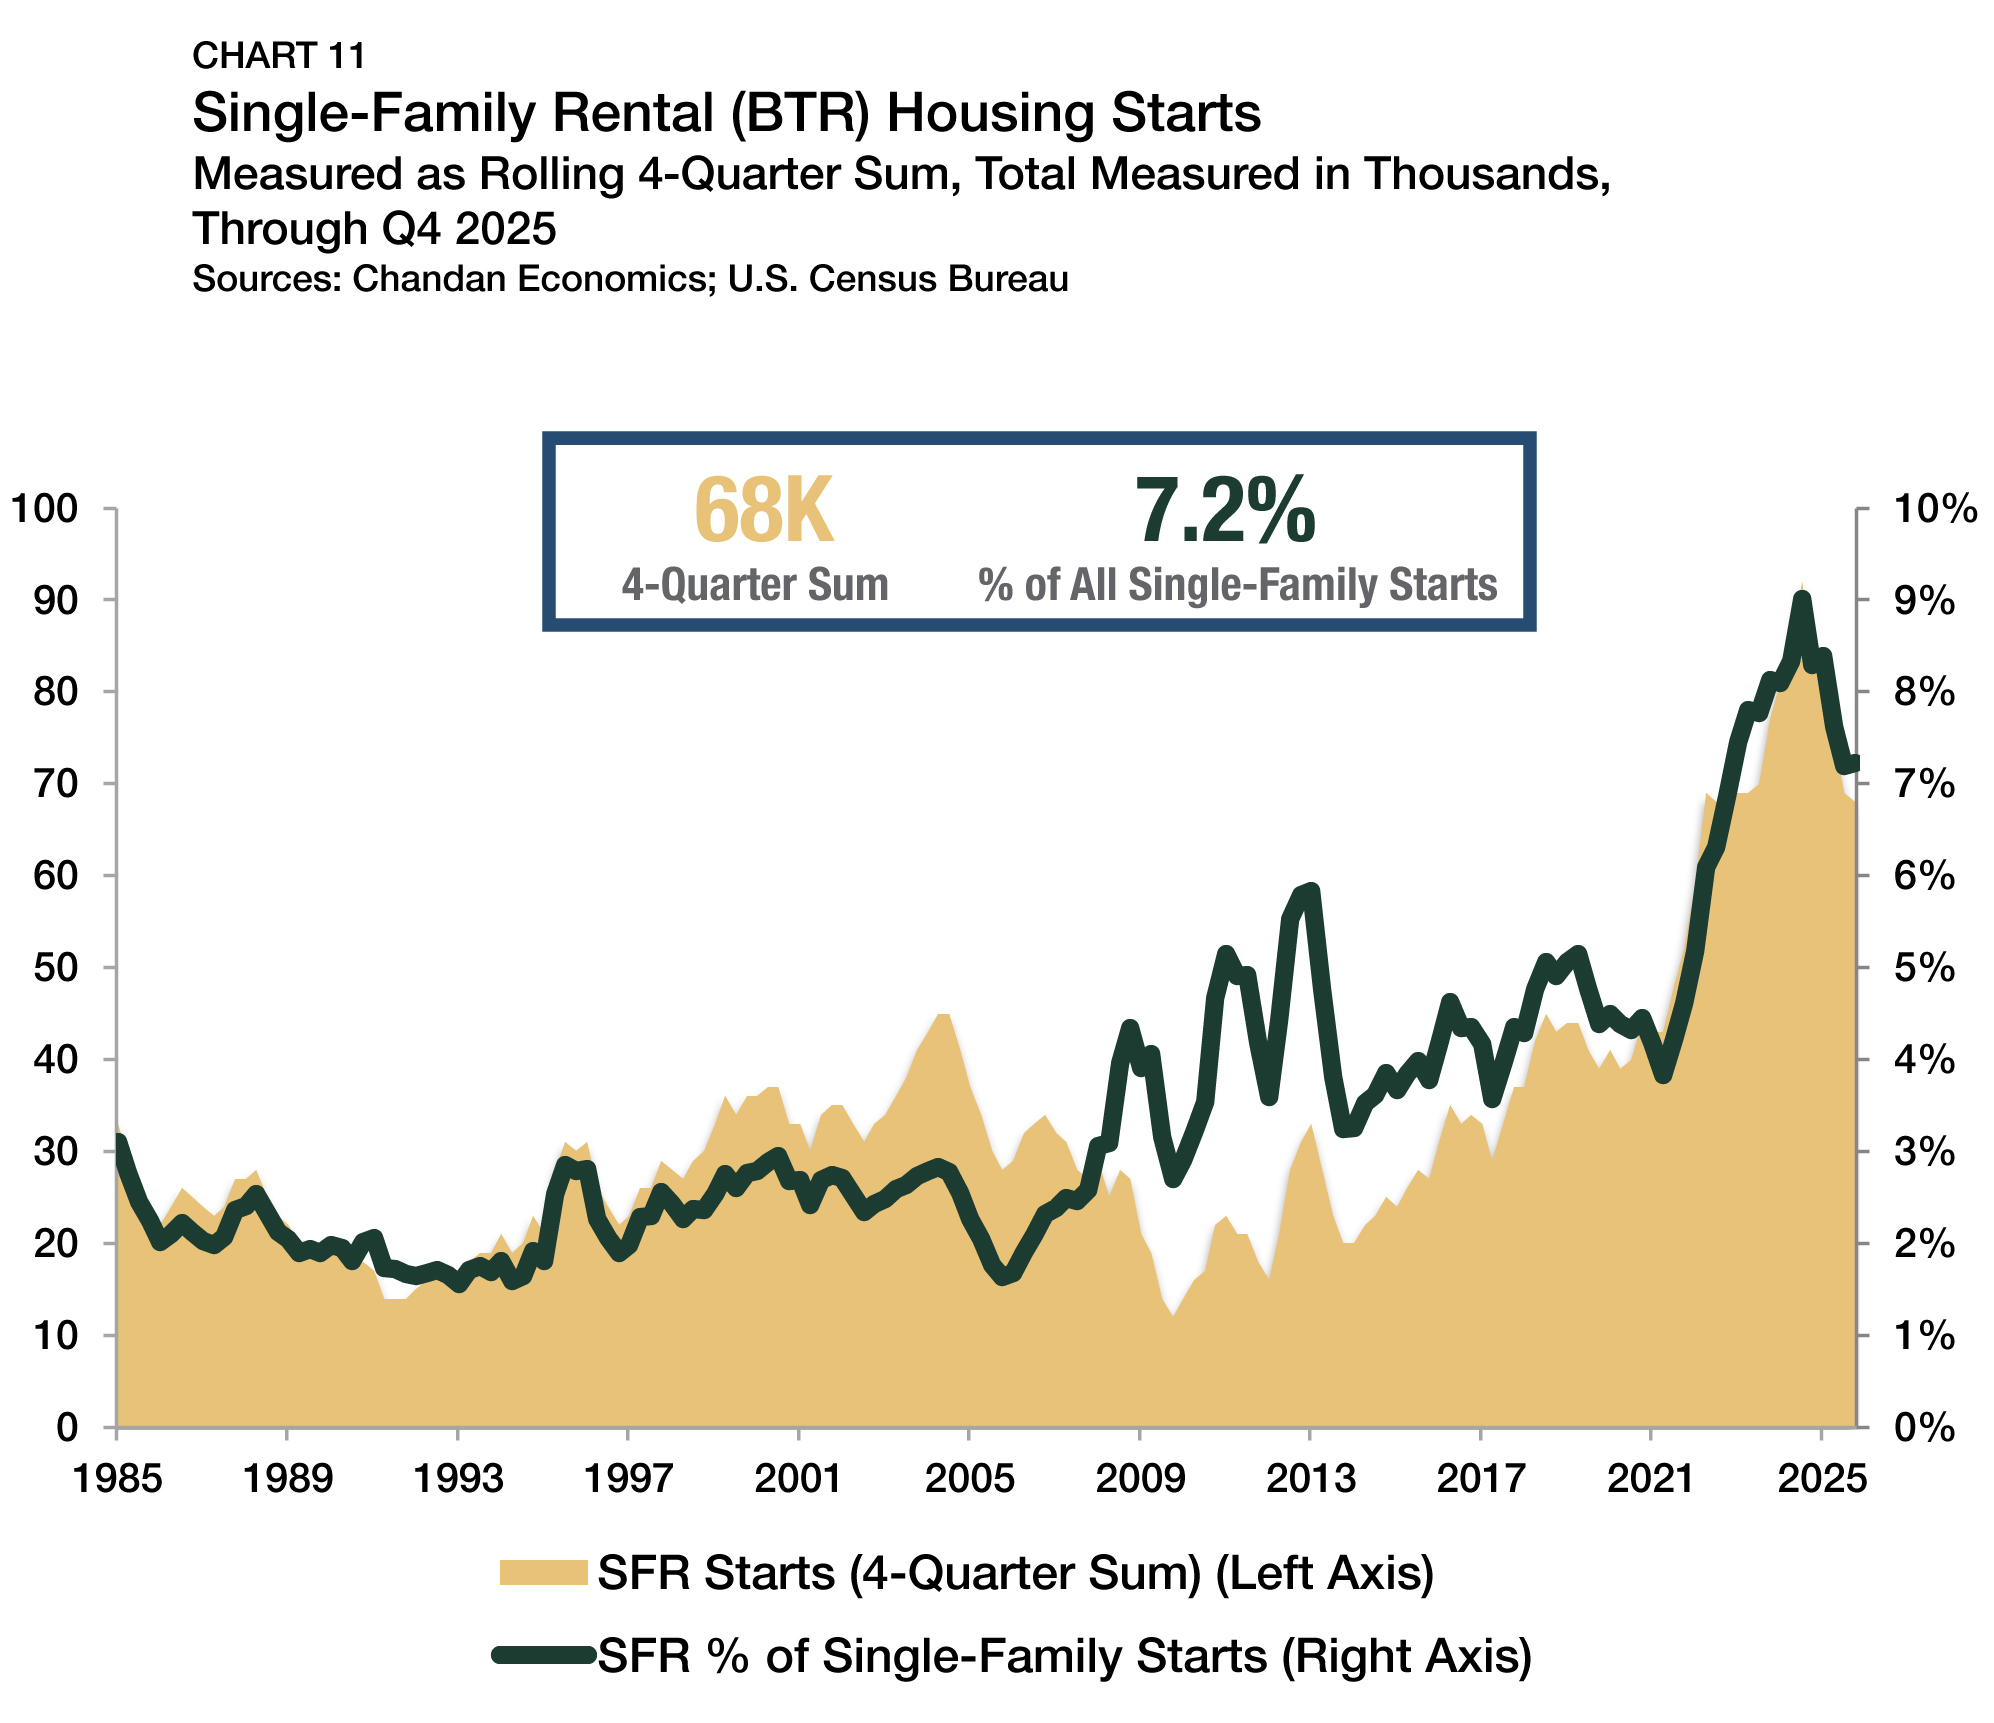
BTR continued to account for a substantial share of new single-family construction in 2025, even as activity moderated from its recent peak. In the year ending in the fourth quarter of 2025, approximately 68,000 BTR units were started (Chart 11), down from 84,000 one year earlier and 92,000 at its peak in the third quarter of 2024. Even with the recent moderation, the latest annual sum is higher than any reading before 2022.
Over this same period, BTR accounted for 7.2% of all single-family housing starts. While this share eased from its 9.0% peak in 2024, it remains above its trailing five-year average and well above pre-2020 norms. Together, recent data points suggest the sector is undergoing a period of normalization after a period of exceptionally elevated production.
Although legislative uncertainty may have influenced development activity in early 2026, new amendments to the ROAD to Housing Act address industry concerns by preserving broad carve-outs for purpose-built rental housing.
Note: Census Bureau data releases remain delayed following the late-2025 federal government shutdown. First-quarter 2026 data had not yet been released at the time of publication.
Outlook
The SFR sector remains on stable footing in an evolving marketplace. Rent growth is moderating, home price appreciation is staying subdued, and capital markets continue to operate within a disciplined financing environment. According to Fannie Mae’s May 2026 forecast, the 30-year fixed mortgage rate is expected to remain above 6.0% through 2026 and 2027, continuing to constrain homeownership affordability and supporting rental demand.
Single-family construction is projected to remain below recent cyclical highs, while BTR activity remains historically elevated. However, it is still too early to tell if the debate surrounding the ROAD to Housing Act influenced development and capital allocation decisions in early 2026, before recent amendments were introduced.
At the household level, renter-to-owner transitions face real pressure. A Federal Reserve Bank of New York survey shows renters continue to report difficulty accessing mortgage credit while also becoming more measured in their views of homeownership as a financial investment. These dynamics should continue to support SFR demand throughout 2026, particularly among households prioritizing space, flexibility, and affordability over near-term ownership. Altogether, the longer-term outlook for the SFR and BTR sectors remains supported by durable demographic and affordability trends, even amid an uncertain macroeconomic environment.
Appendix
For more single-family rental research and insights, visit arbor.com/research
Disclaimer
This report is intended for general guidance and information purposes only. This report is under no circumstances intended to be used or considered as financial or investment advice, a recommendation or an offer to sell, or a solicitation of any offer to buy any securities or other form of financial asset. Please note that this is not an offer document. The report is not to be considered as investment research or an objective or independent explanation of the matters contained herein and is not prepared in accordance with the regulation regarding investment analysis. The material in the report is obtained from various sources per dating of the report. We have taken reasonable care to ensure that, and to the best of our knowledge, material information contained herein is in accordance with the facts and contains no omission likely to affect its understanding. That said, all content is provided herein “as is” and neither Arbor Realty Trust, Inc. or Chandan Economics, LLC (“the Companies”) nor their affiliated or related entities, nor any person involved in the creation, production and distribution of the content make any warranties, express or implied. The Companies do not make any representations or warranties, express or implied, as to the reliability, usefulness, completeness, accuracy, currency nor represent that use of any information provided herein would not infringe on other third-party rights. The Companies shall not be liable for any direct, indirect or consequential damages to the reader or a third party arising from the use of the information contained herein. There may have been changes in matters which affect the content contained herein and/or the Companies subsequent to the date of this report. Neither the issue nor delivery of this report shall under any circumstance create any implication that the information contained herein is correct as of any time subsequent to the date hereof or that the affairs of the Companies have not since changed. The Companies do not intend, and do not assume any obligation to update or correct the information included in this report. The contents of this report are not to be construed as legal, business, investment or tax advice. Each recipient should consult with its legal, business, investment and tax advisors as to legal, business, investment and tax advice. The information contained herein may be subject to changes without prior notice. This report is only intended for the recipients, and should not be copied or otherwise distributed, in whole or in part, to any other person.