Single-Family Rental Investment Trends Report Q4 2024
SFR Construction Soars Amid Favorable Trends in Cap Rates and Debt Yields
Key Findings
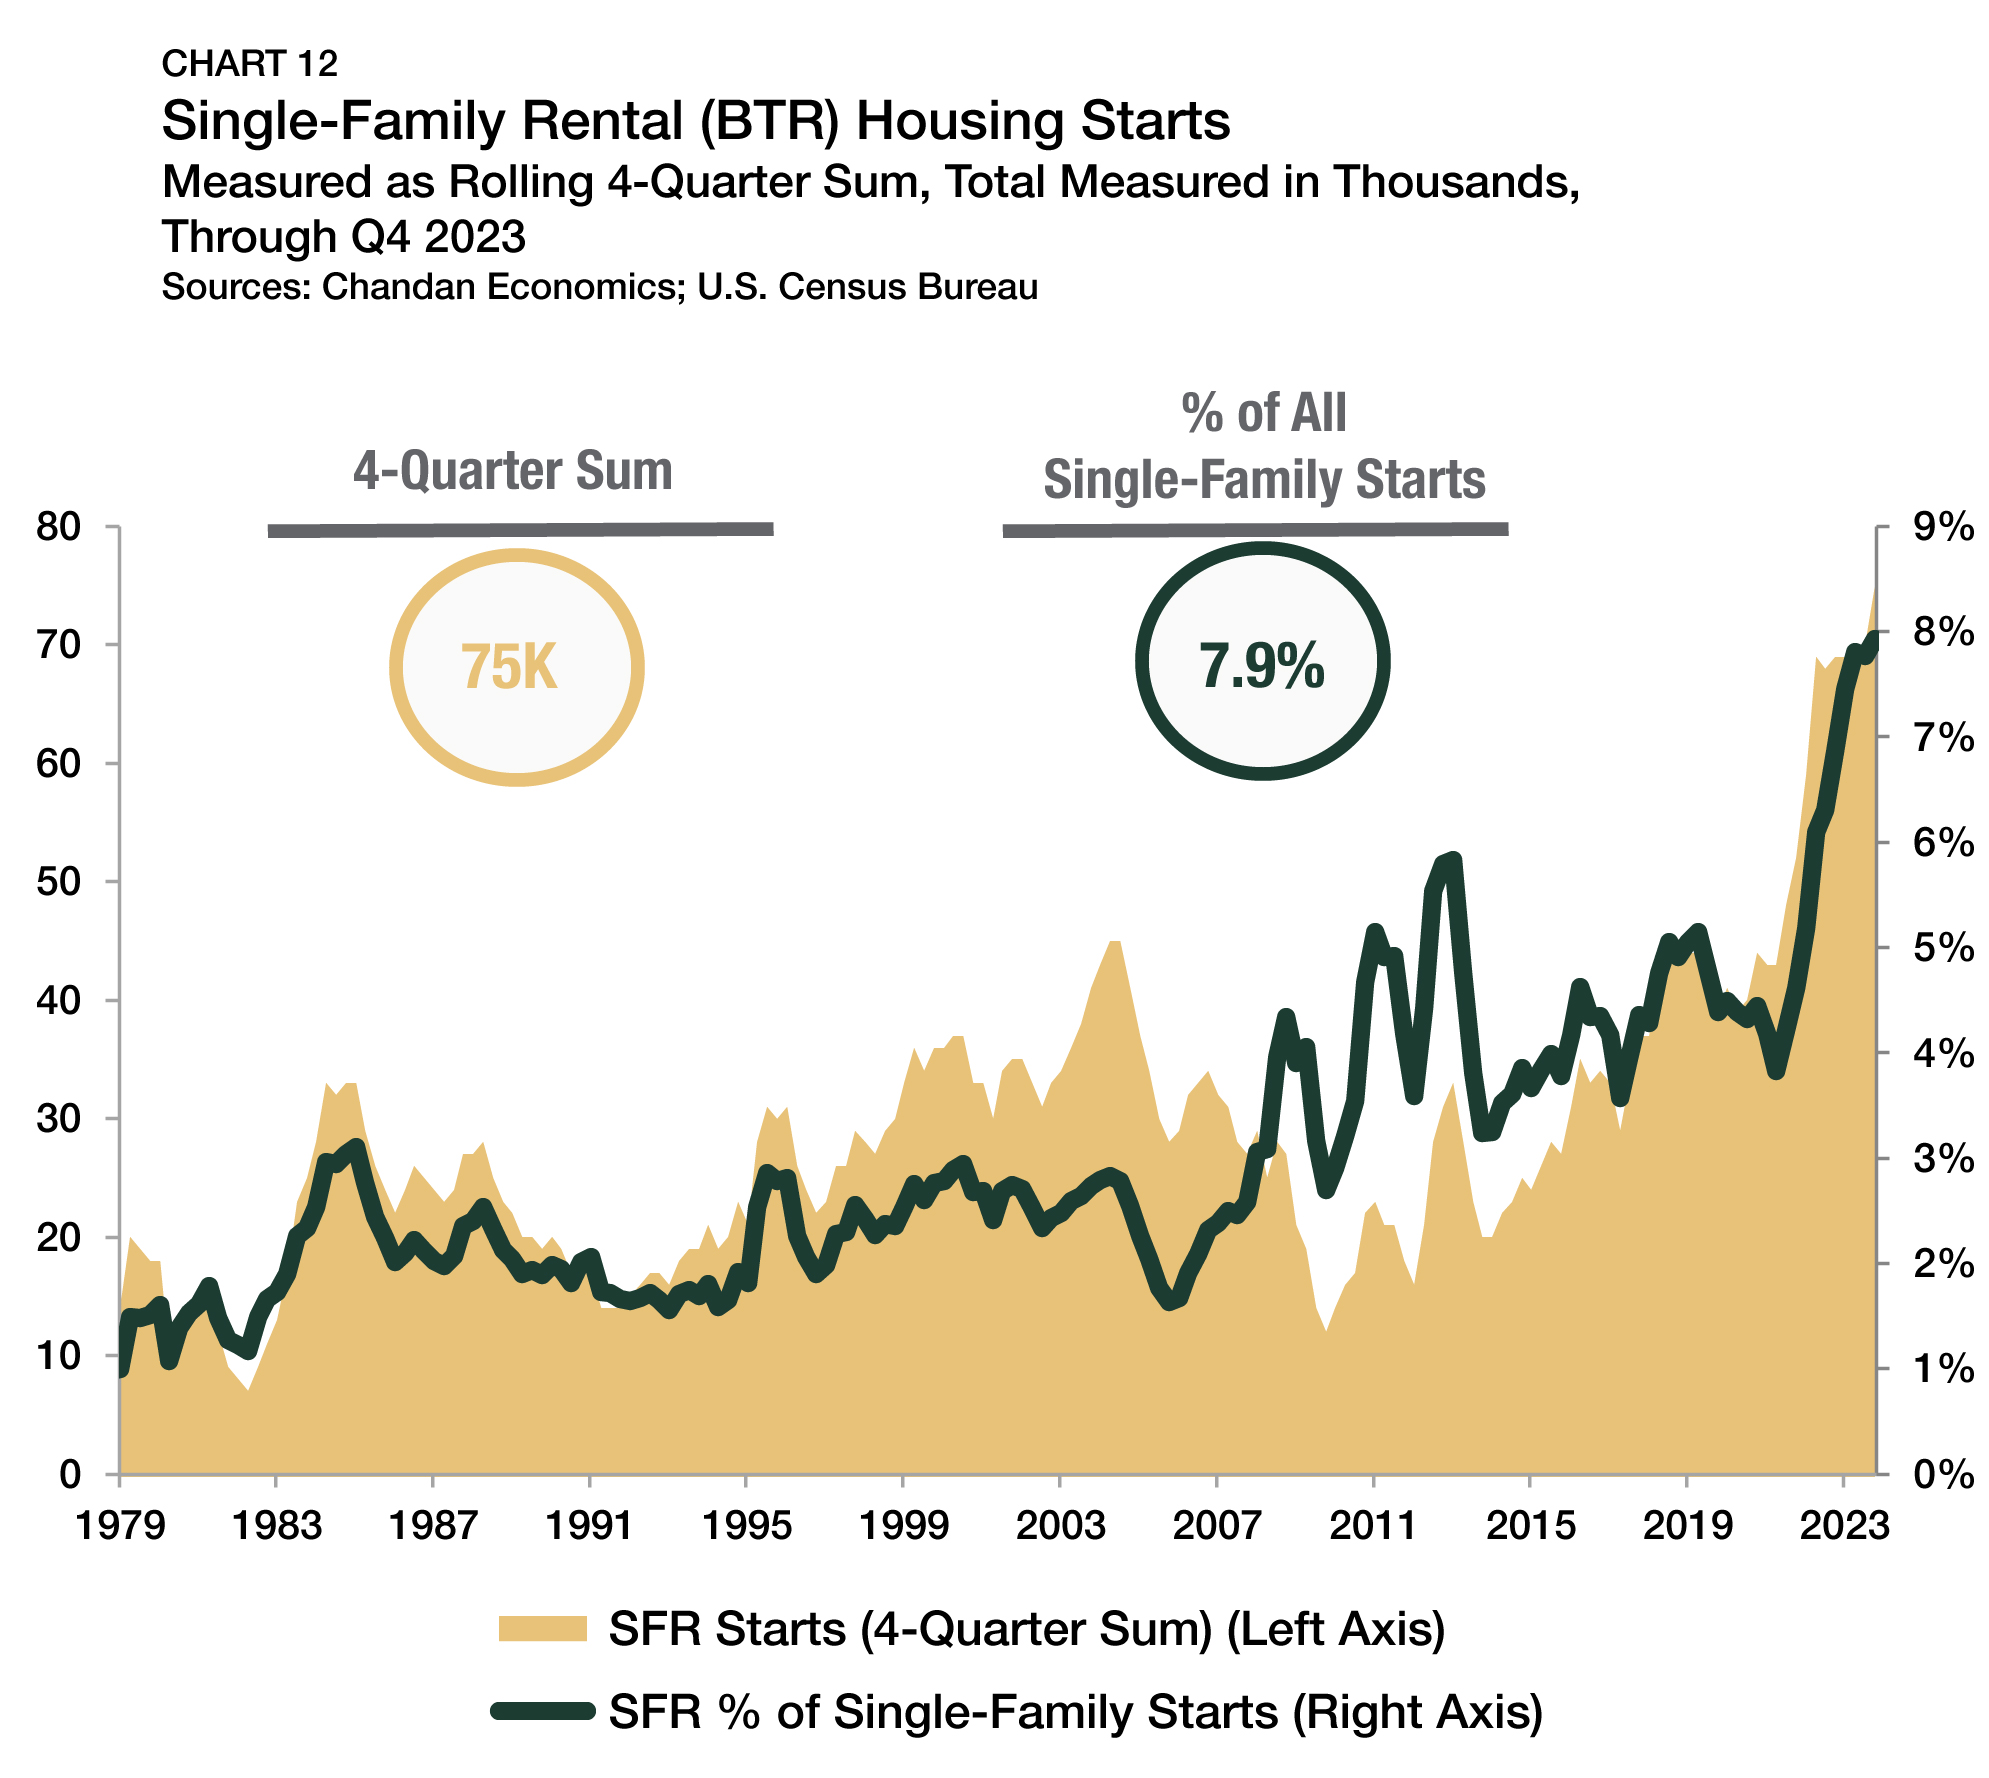
- SFR/BTR construction starts surged, reaching a new high of 9.0% of all
single-family development activity. -
SFR CMBS activity in 2024 has already more than doubled last year’s total.
-
Rent and home valuation growth rates continued to moderate.
Table of Contents
State of the Market
The single-family rental (SFR) sector had another strong quarter and remained in a prime position to capture housing demand amid a challenging market for homebuyers.
Homeownership affordability constraints have become increasingly severe and persistent, with mortgage rates re-ascending to near 7% and home prices closing in on new all-time highs. As a result, SFR has attracted more households who want the amenities typically available in suburban homes, but believe homeownership may be out of reach.
Simultaneously, the SFR sector’s fundamental health has been sound. Structured capital markets have significantly rebounded in 2024, and developers have started new build-to-rent (BTR) projects to meet the surging demand for single-family rental housing units. Delinquency rates have continued to improve, cap rates and debt yields are beginning to stabilize, and rent growth remains comfortably positive heading into the end of 2024. While occupancy and retention rates have dipped, the overall rental sector has fared similarly. On balance, the structural strengths of the SFR sector far outweigh cyclical headwinds as it remains well-positioned to build on its momentum into 2025 and beyond.
Performance Metrics
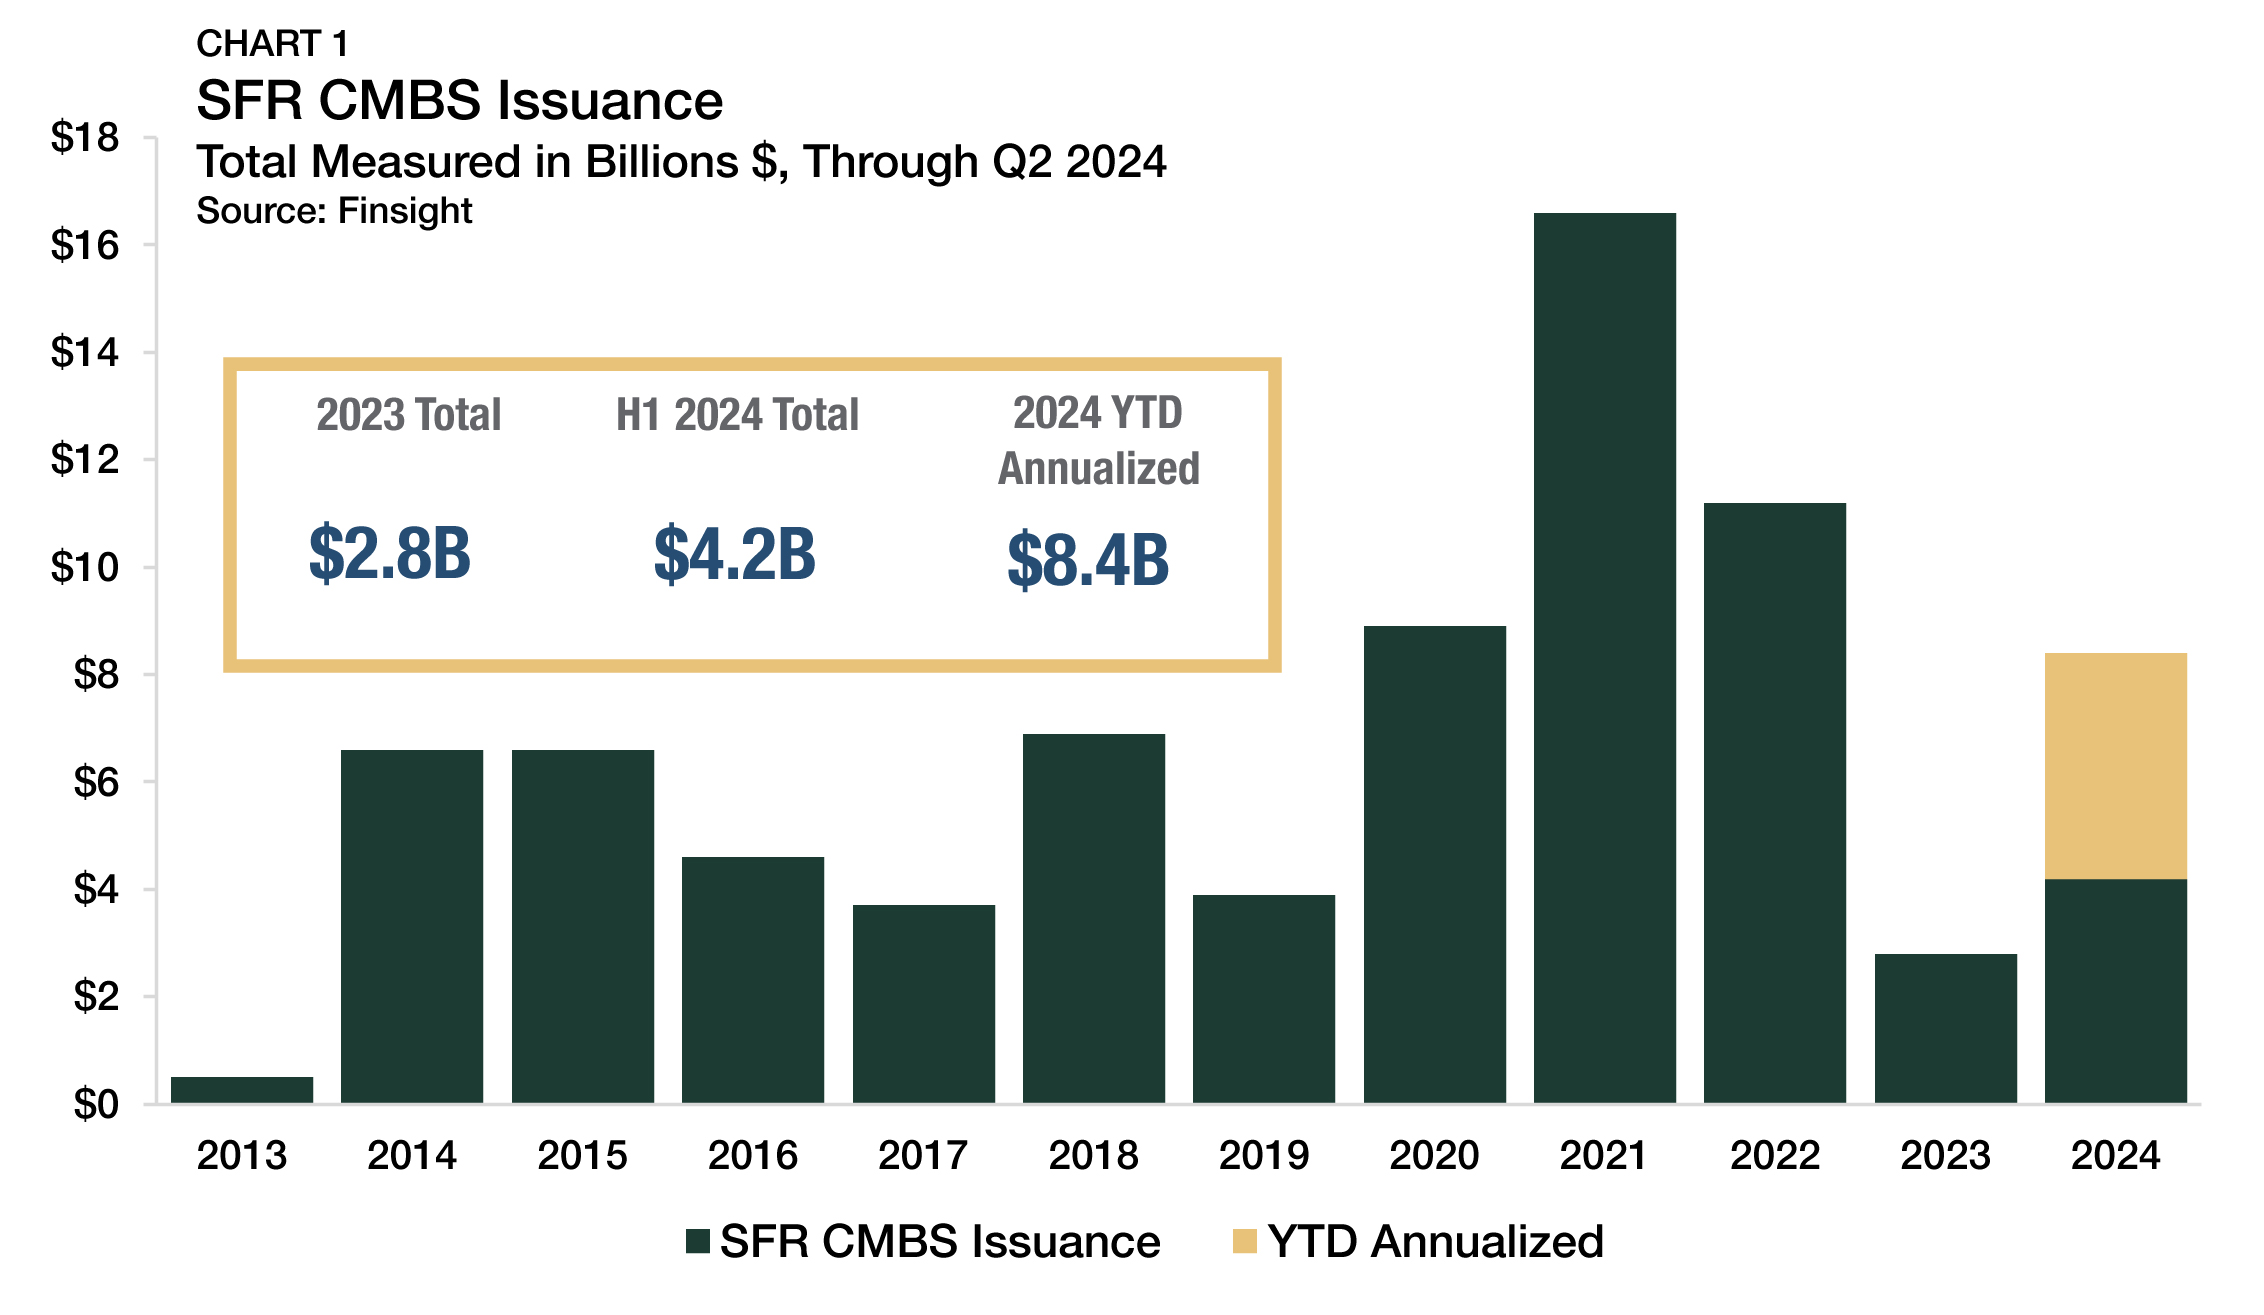
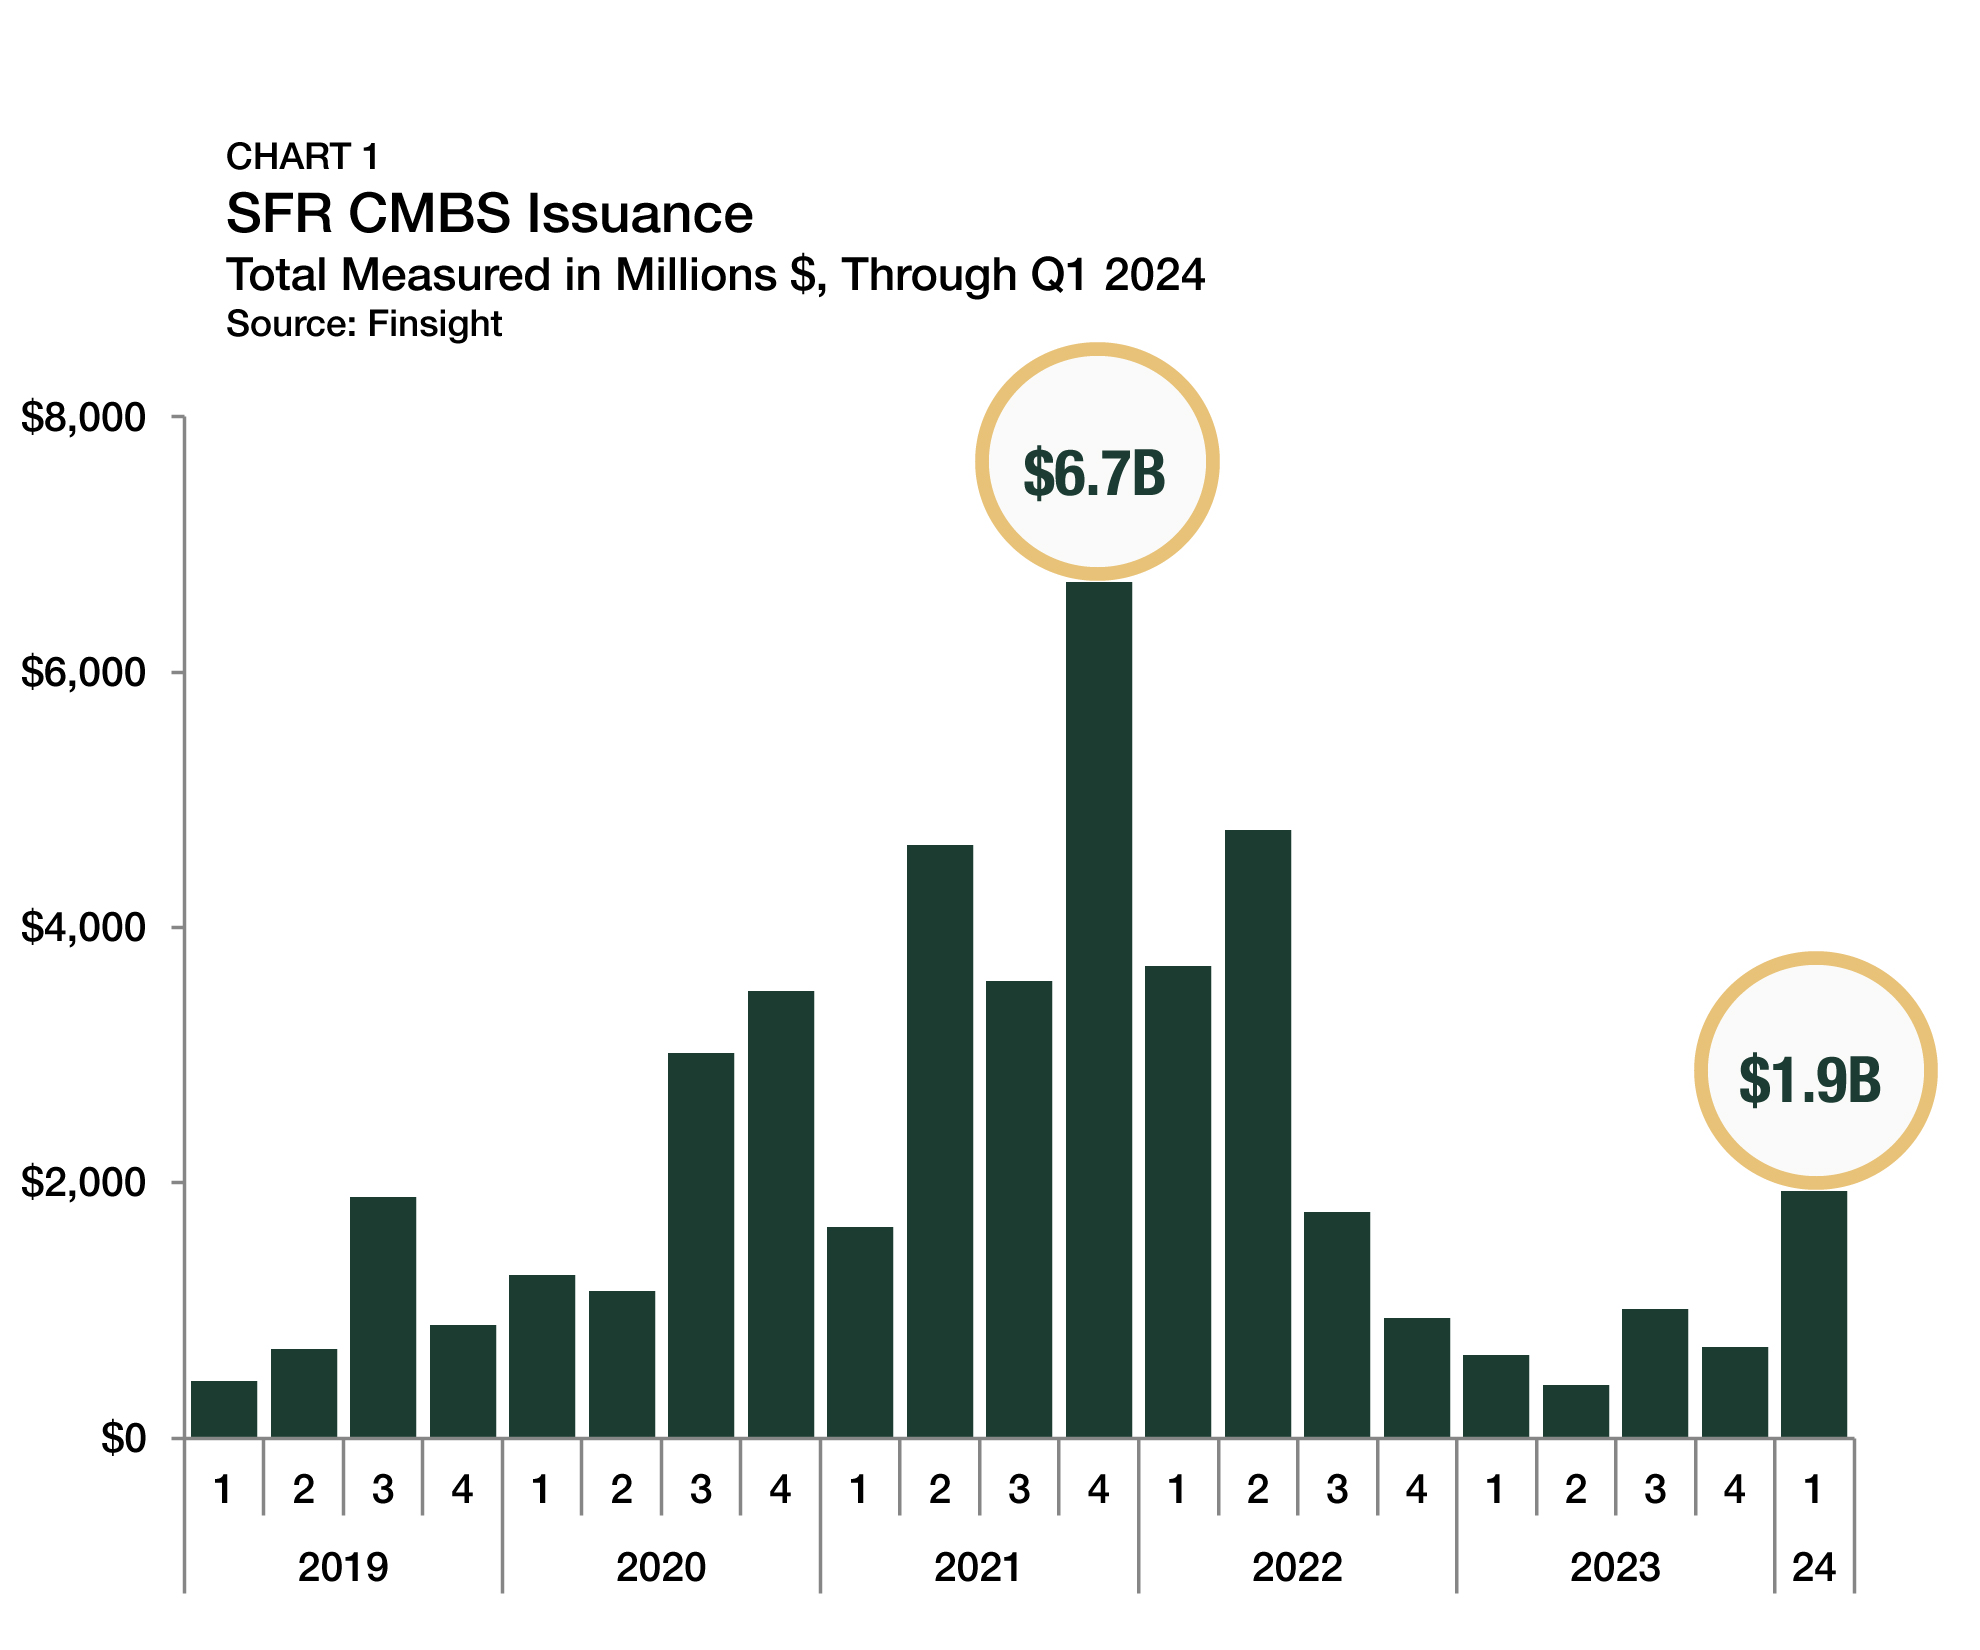
CMBS Issuance
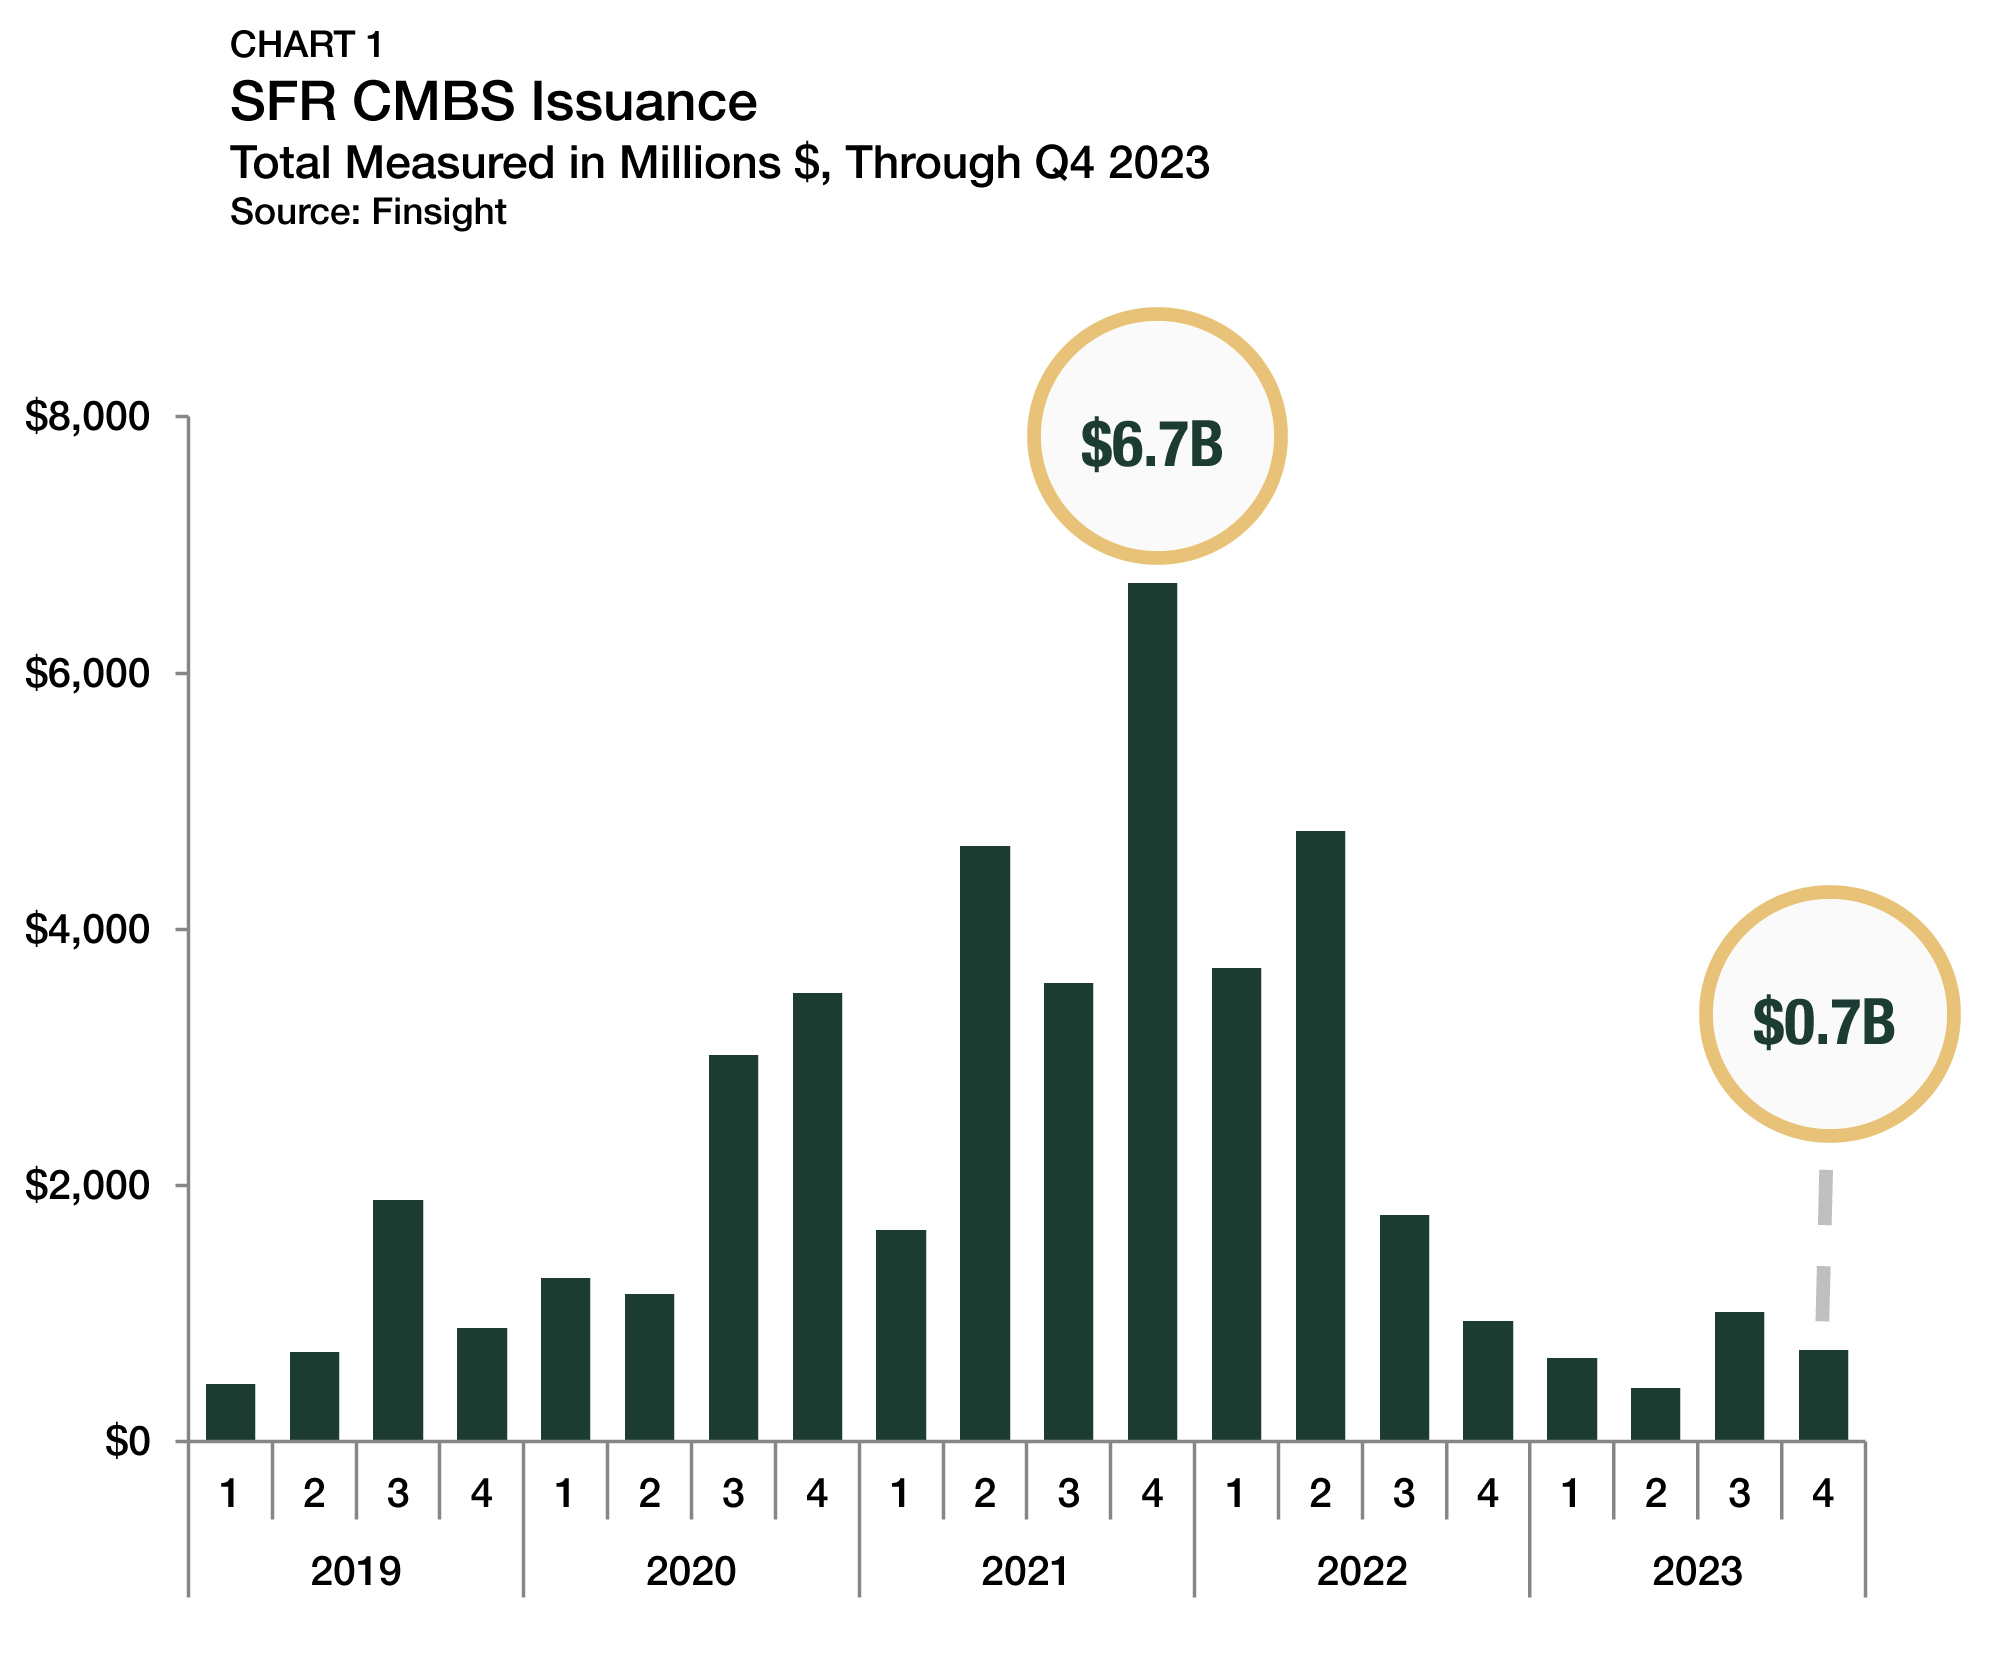
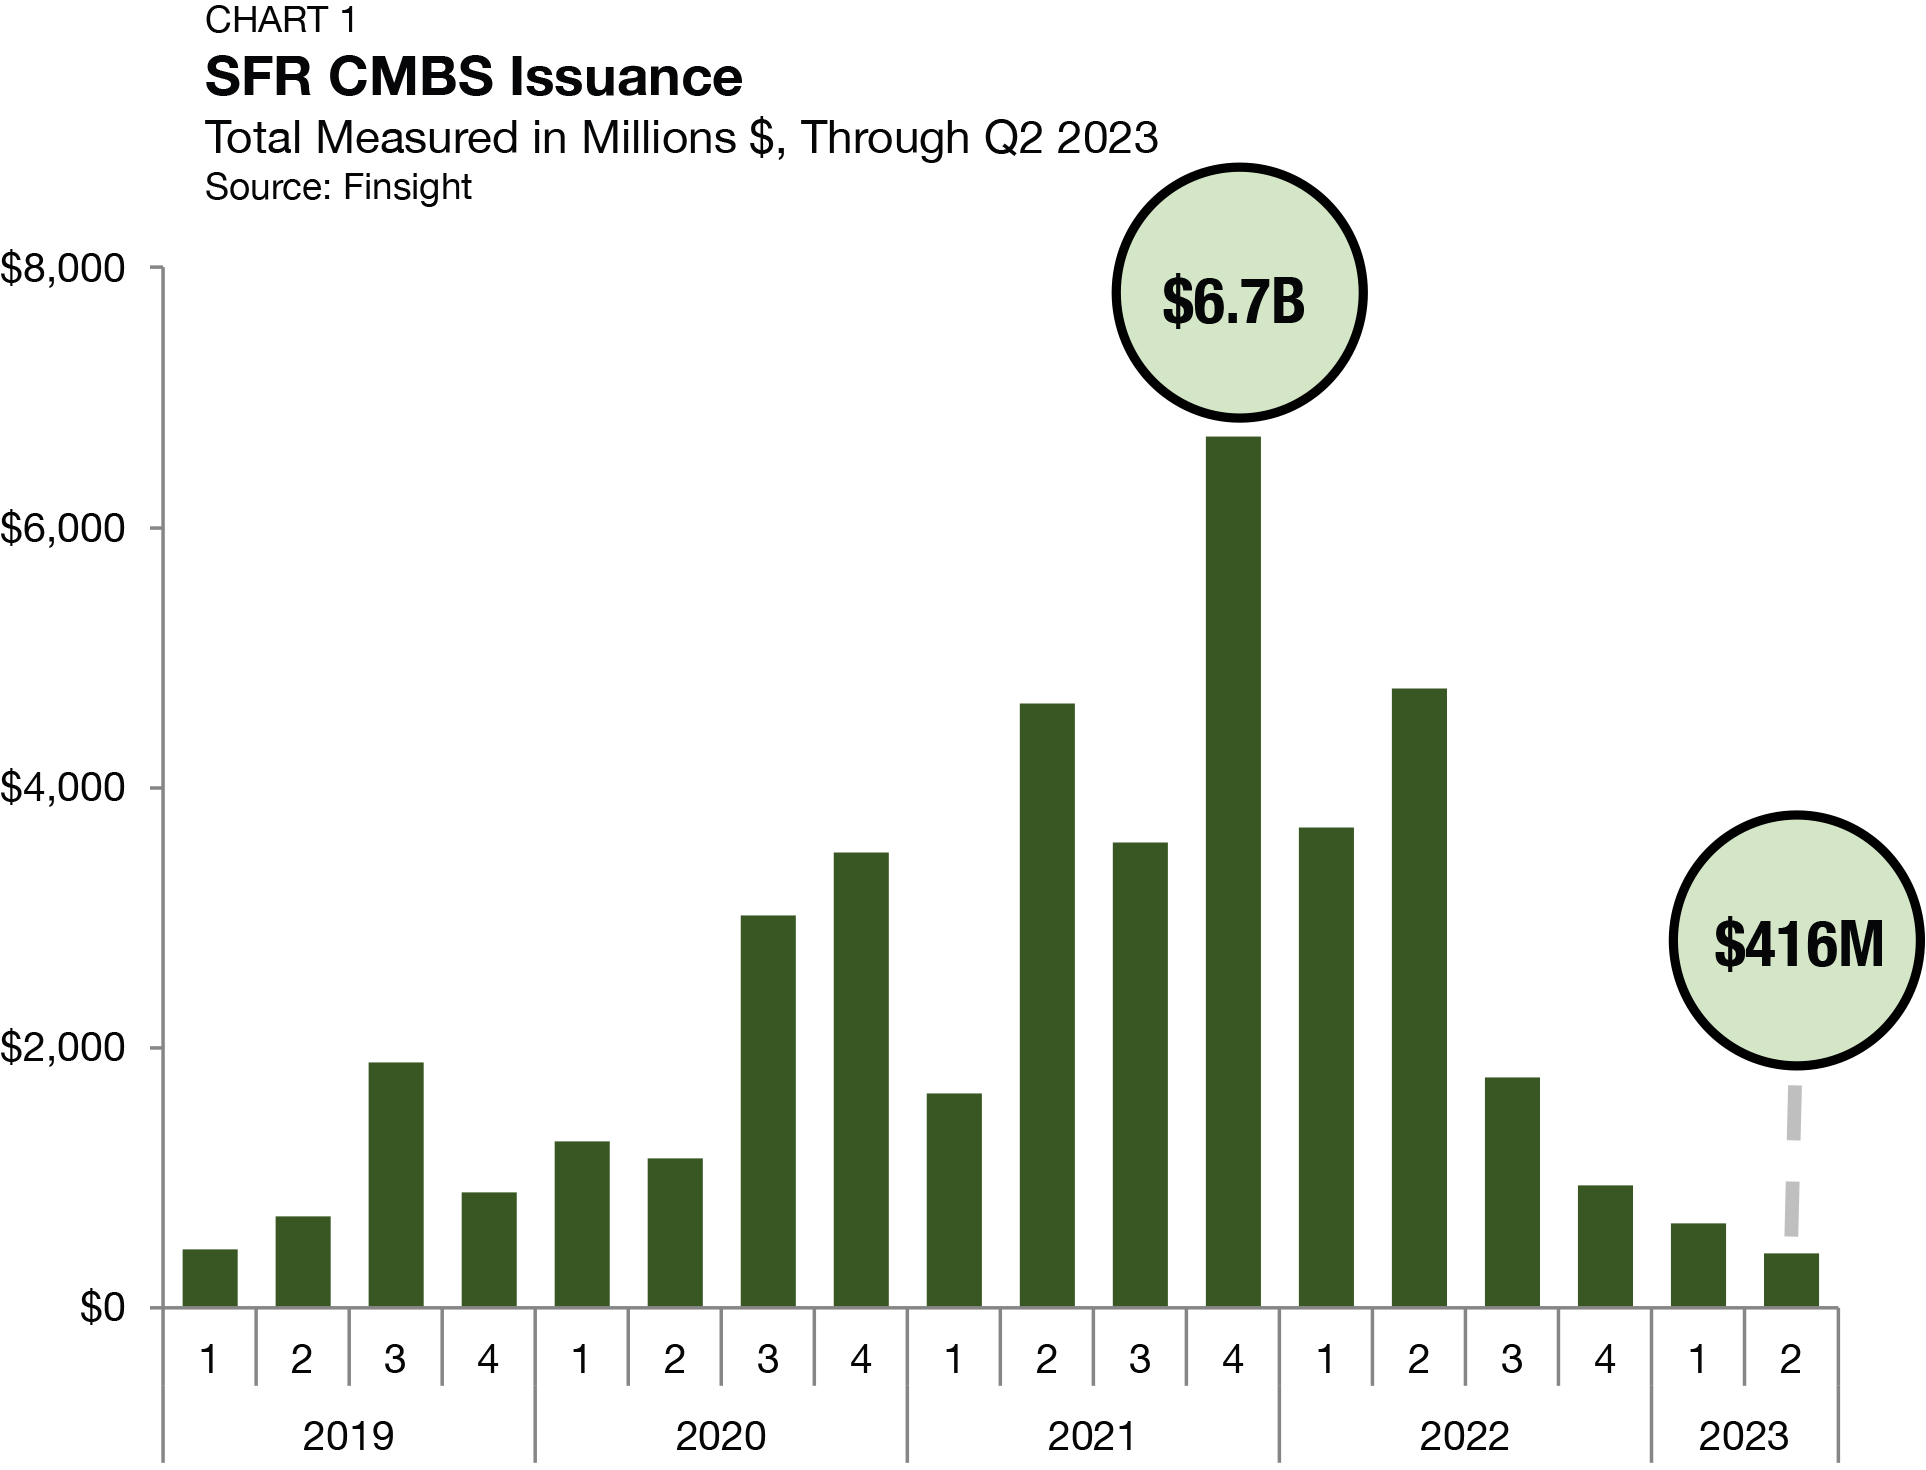
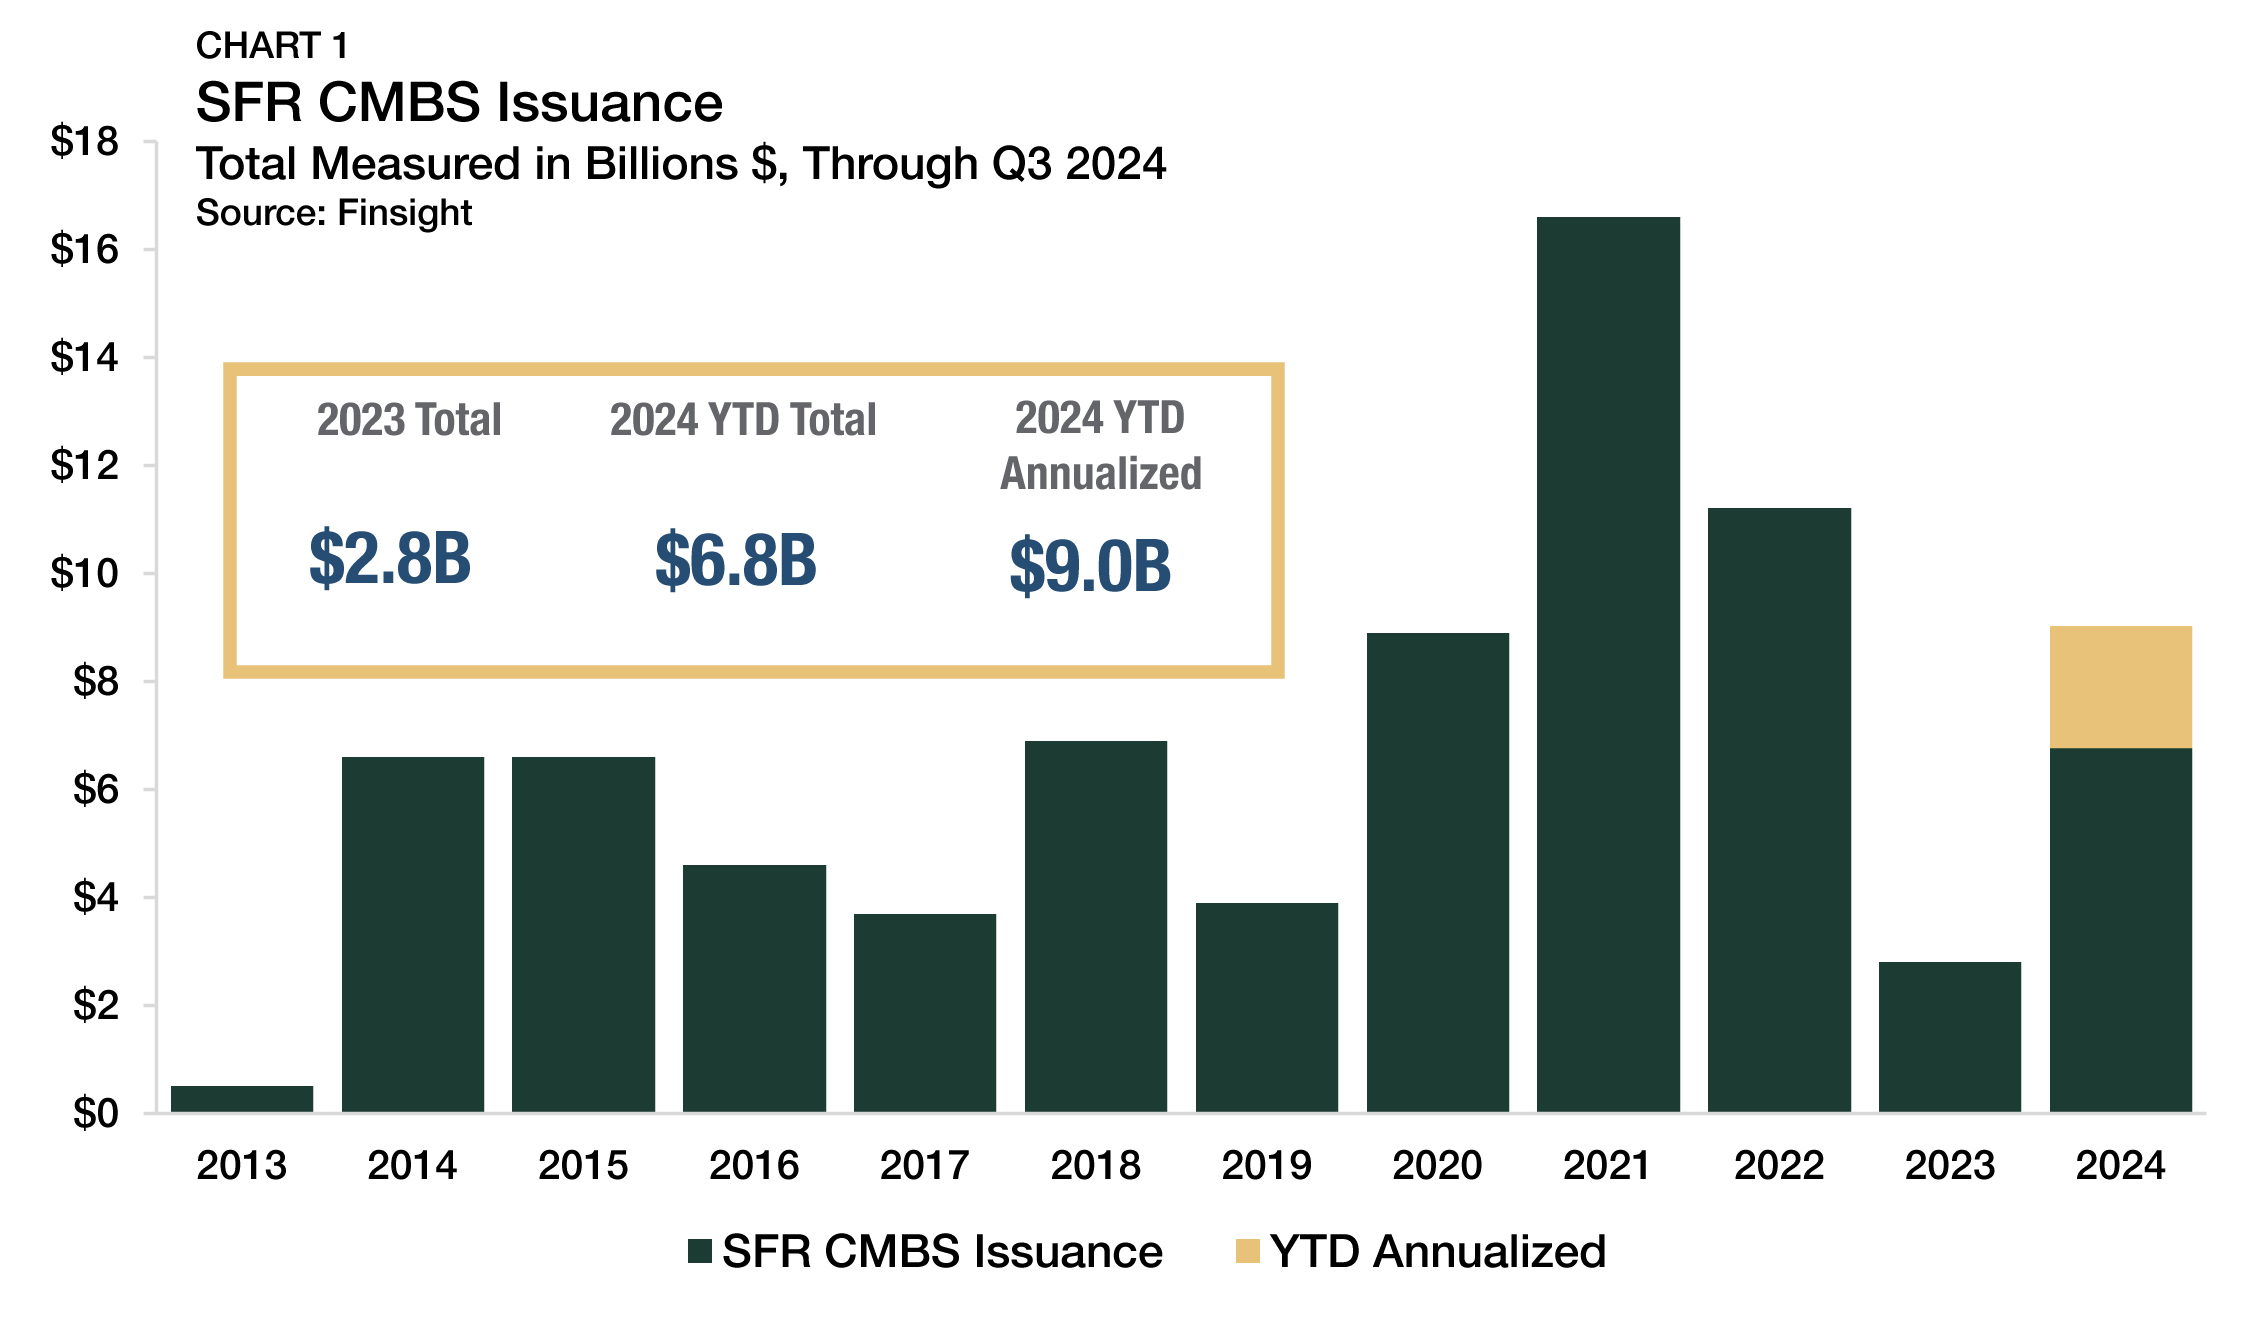
Structured SFR capital markets have seen a marked uptick in activity this year. SFR CMBS issuance totaled $6.8 billion through the first three quarters of 2024, already eclipsing last year’s total output by 145% (Chart 1). If issuance in the final quarter matches the pace set in the first nine months, total production will rise to $9.0 billion this year. While the current annualized issuance pace remains below historical highs in 2021 and 2022, 2024 is still on track to be the third-highest annual total on record.
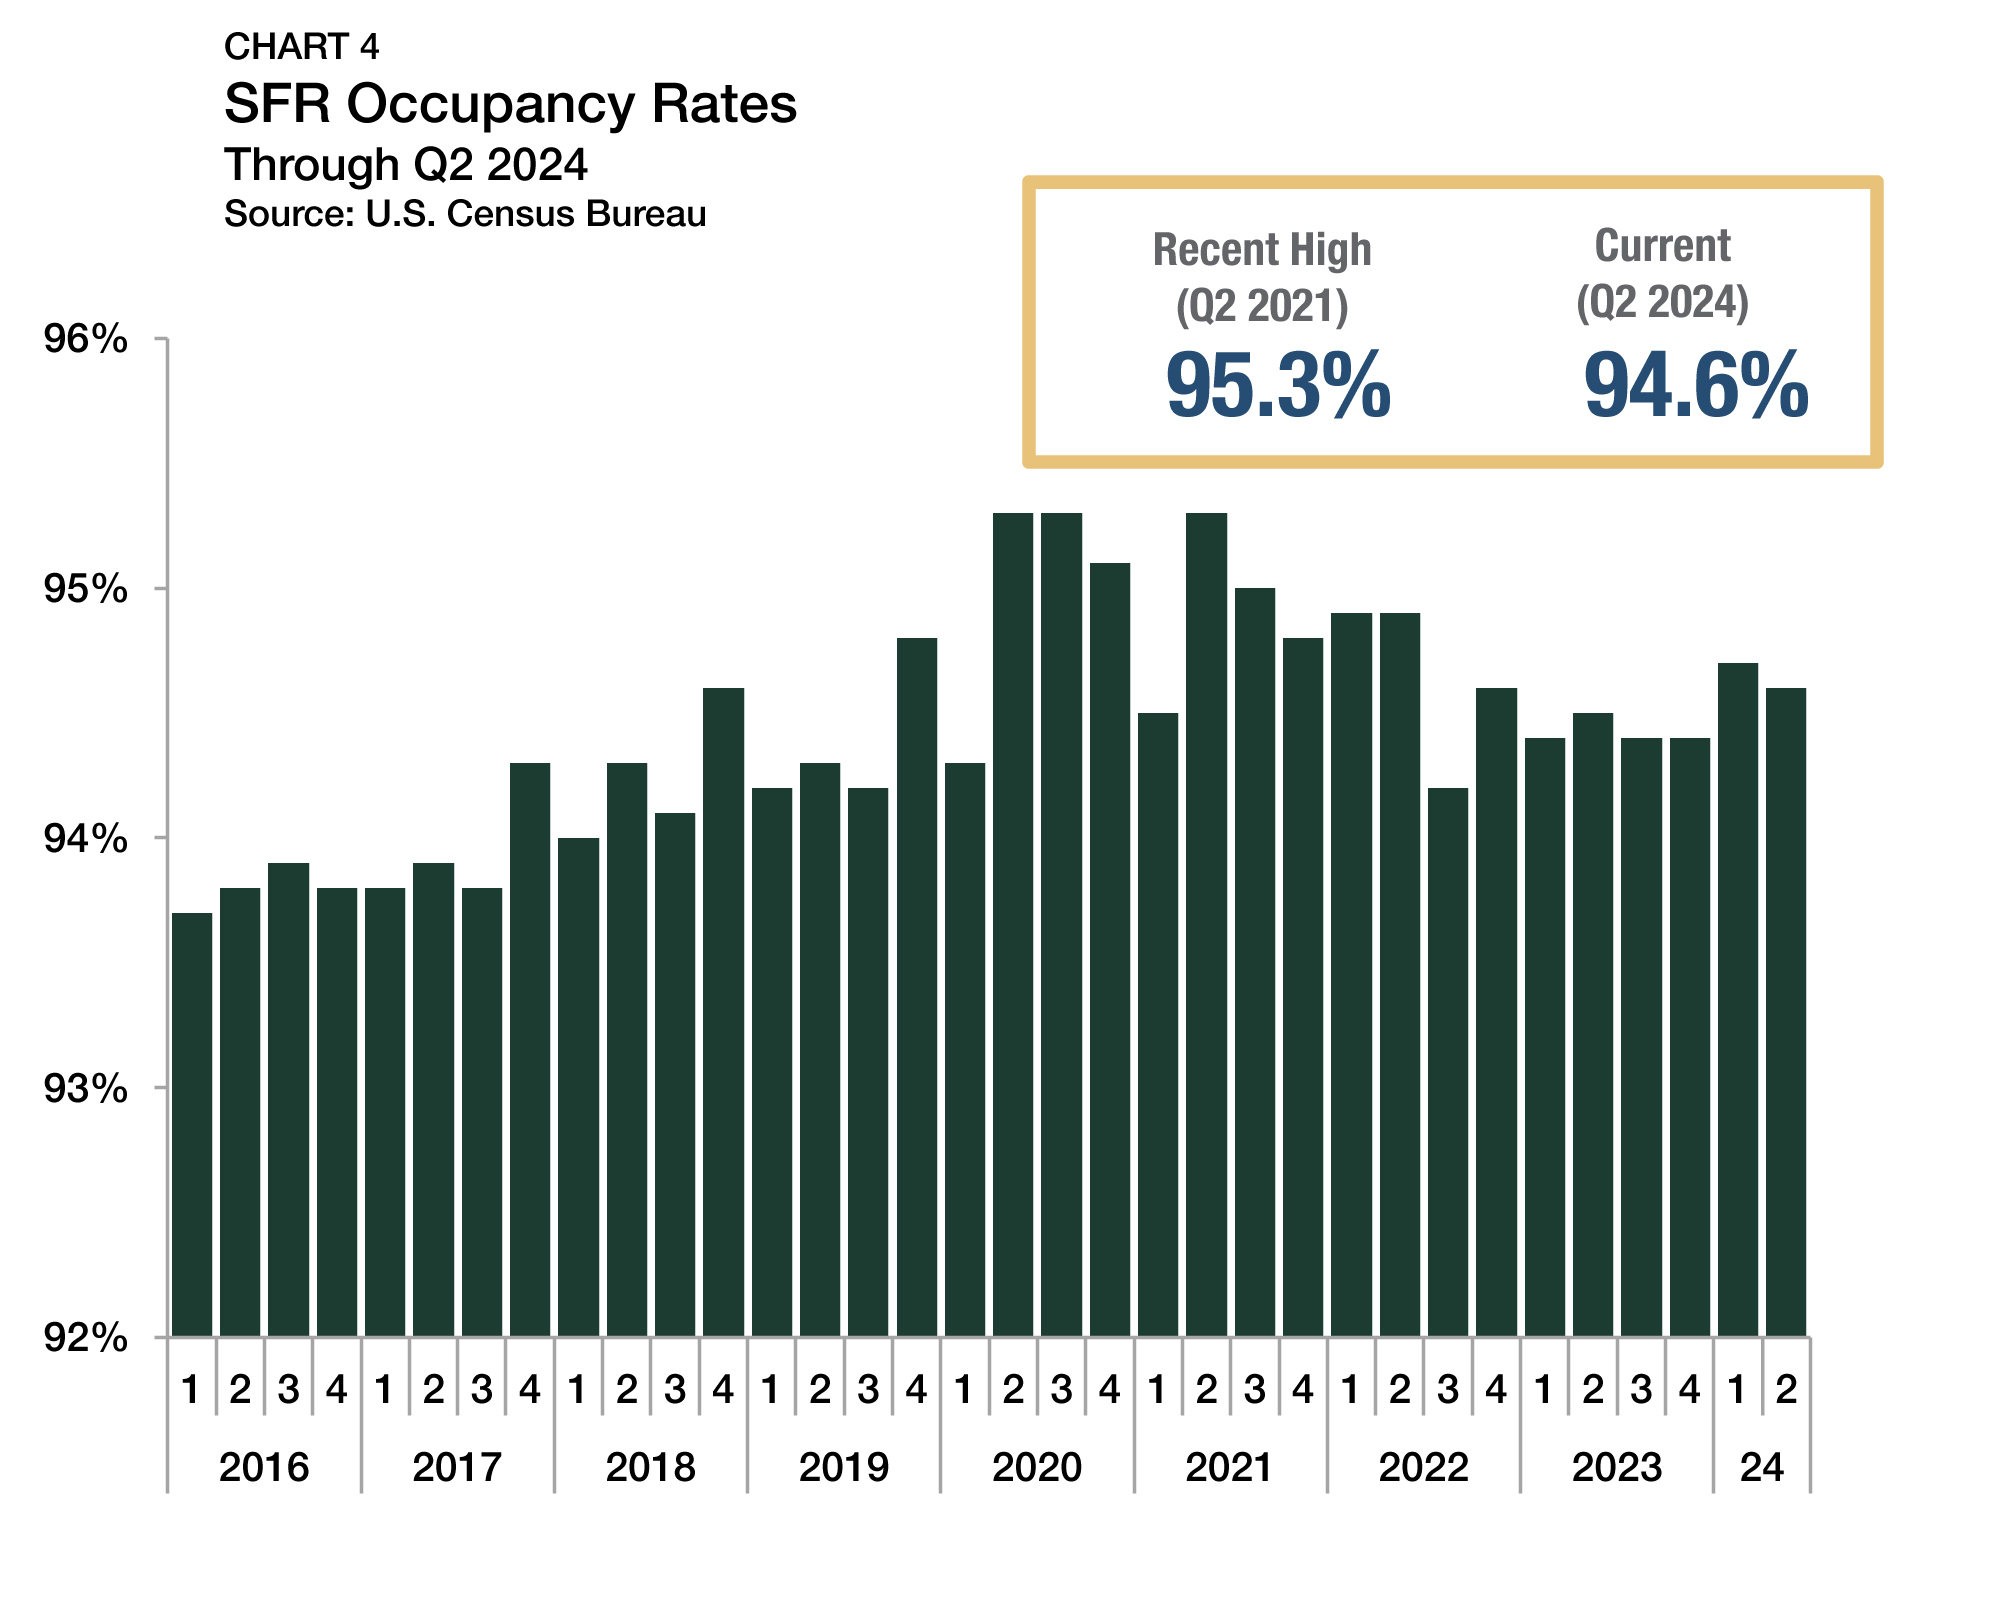
Occupancy and Retention
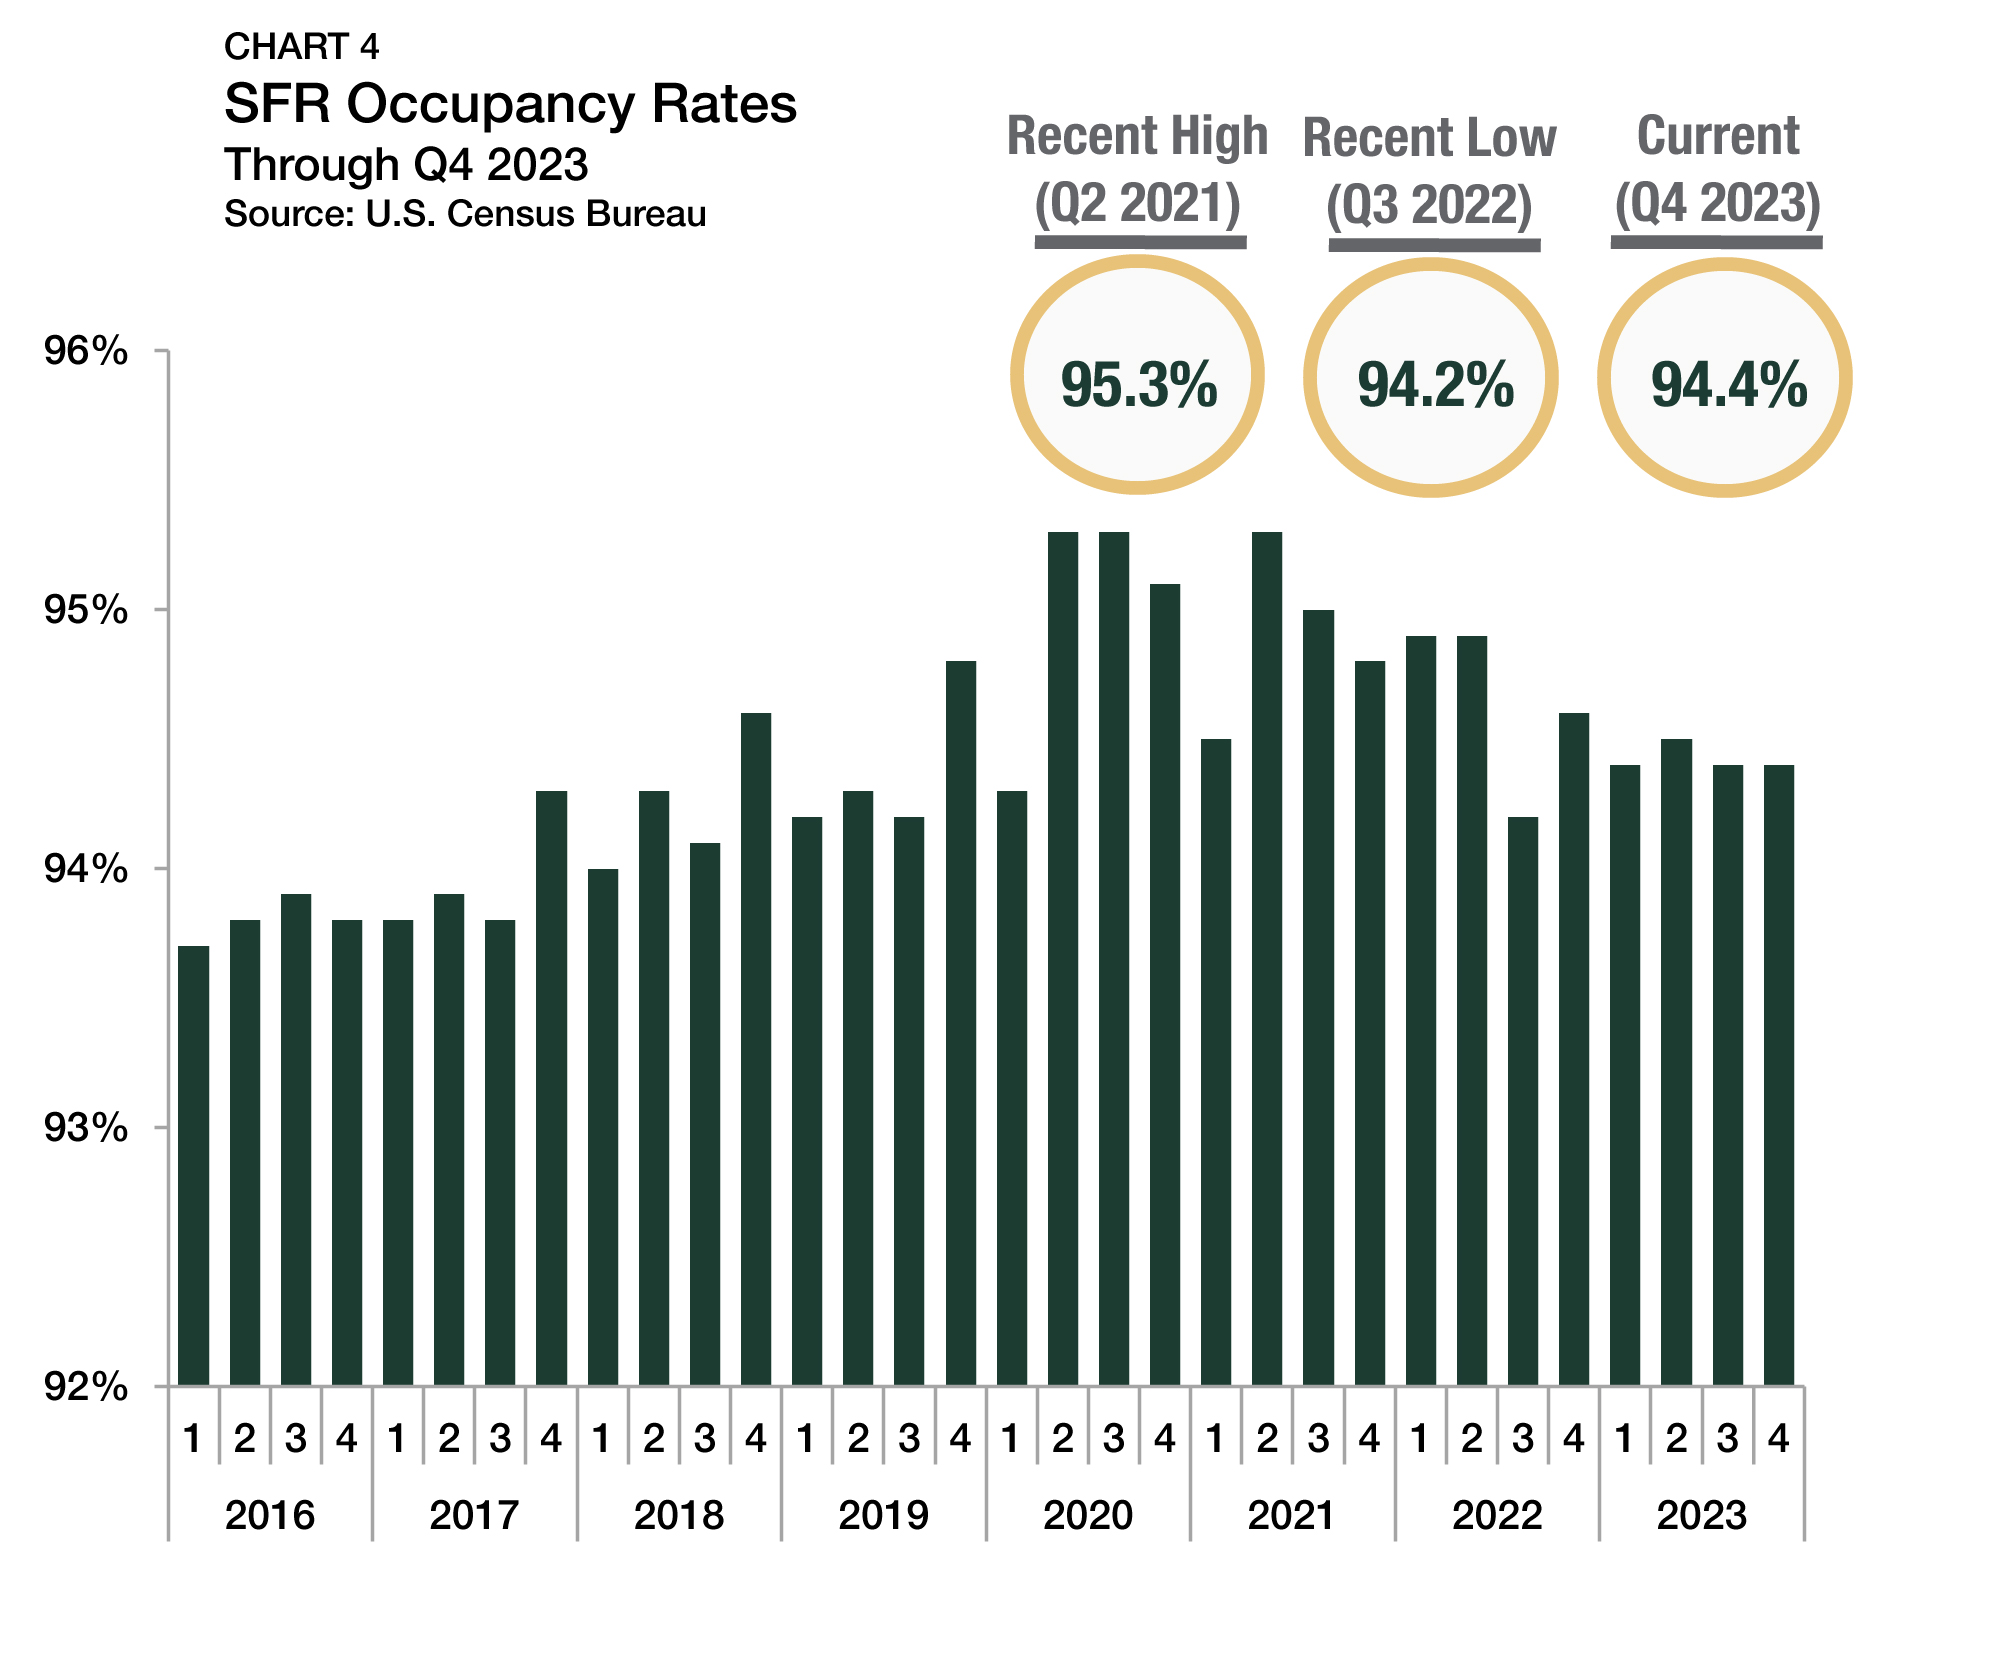
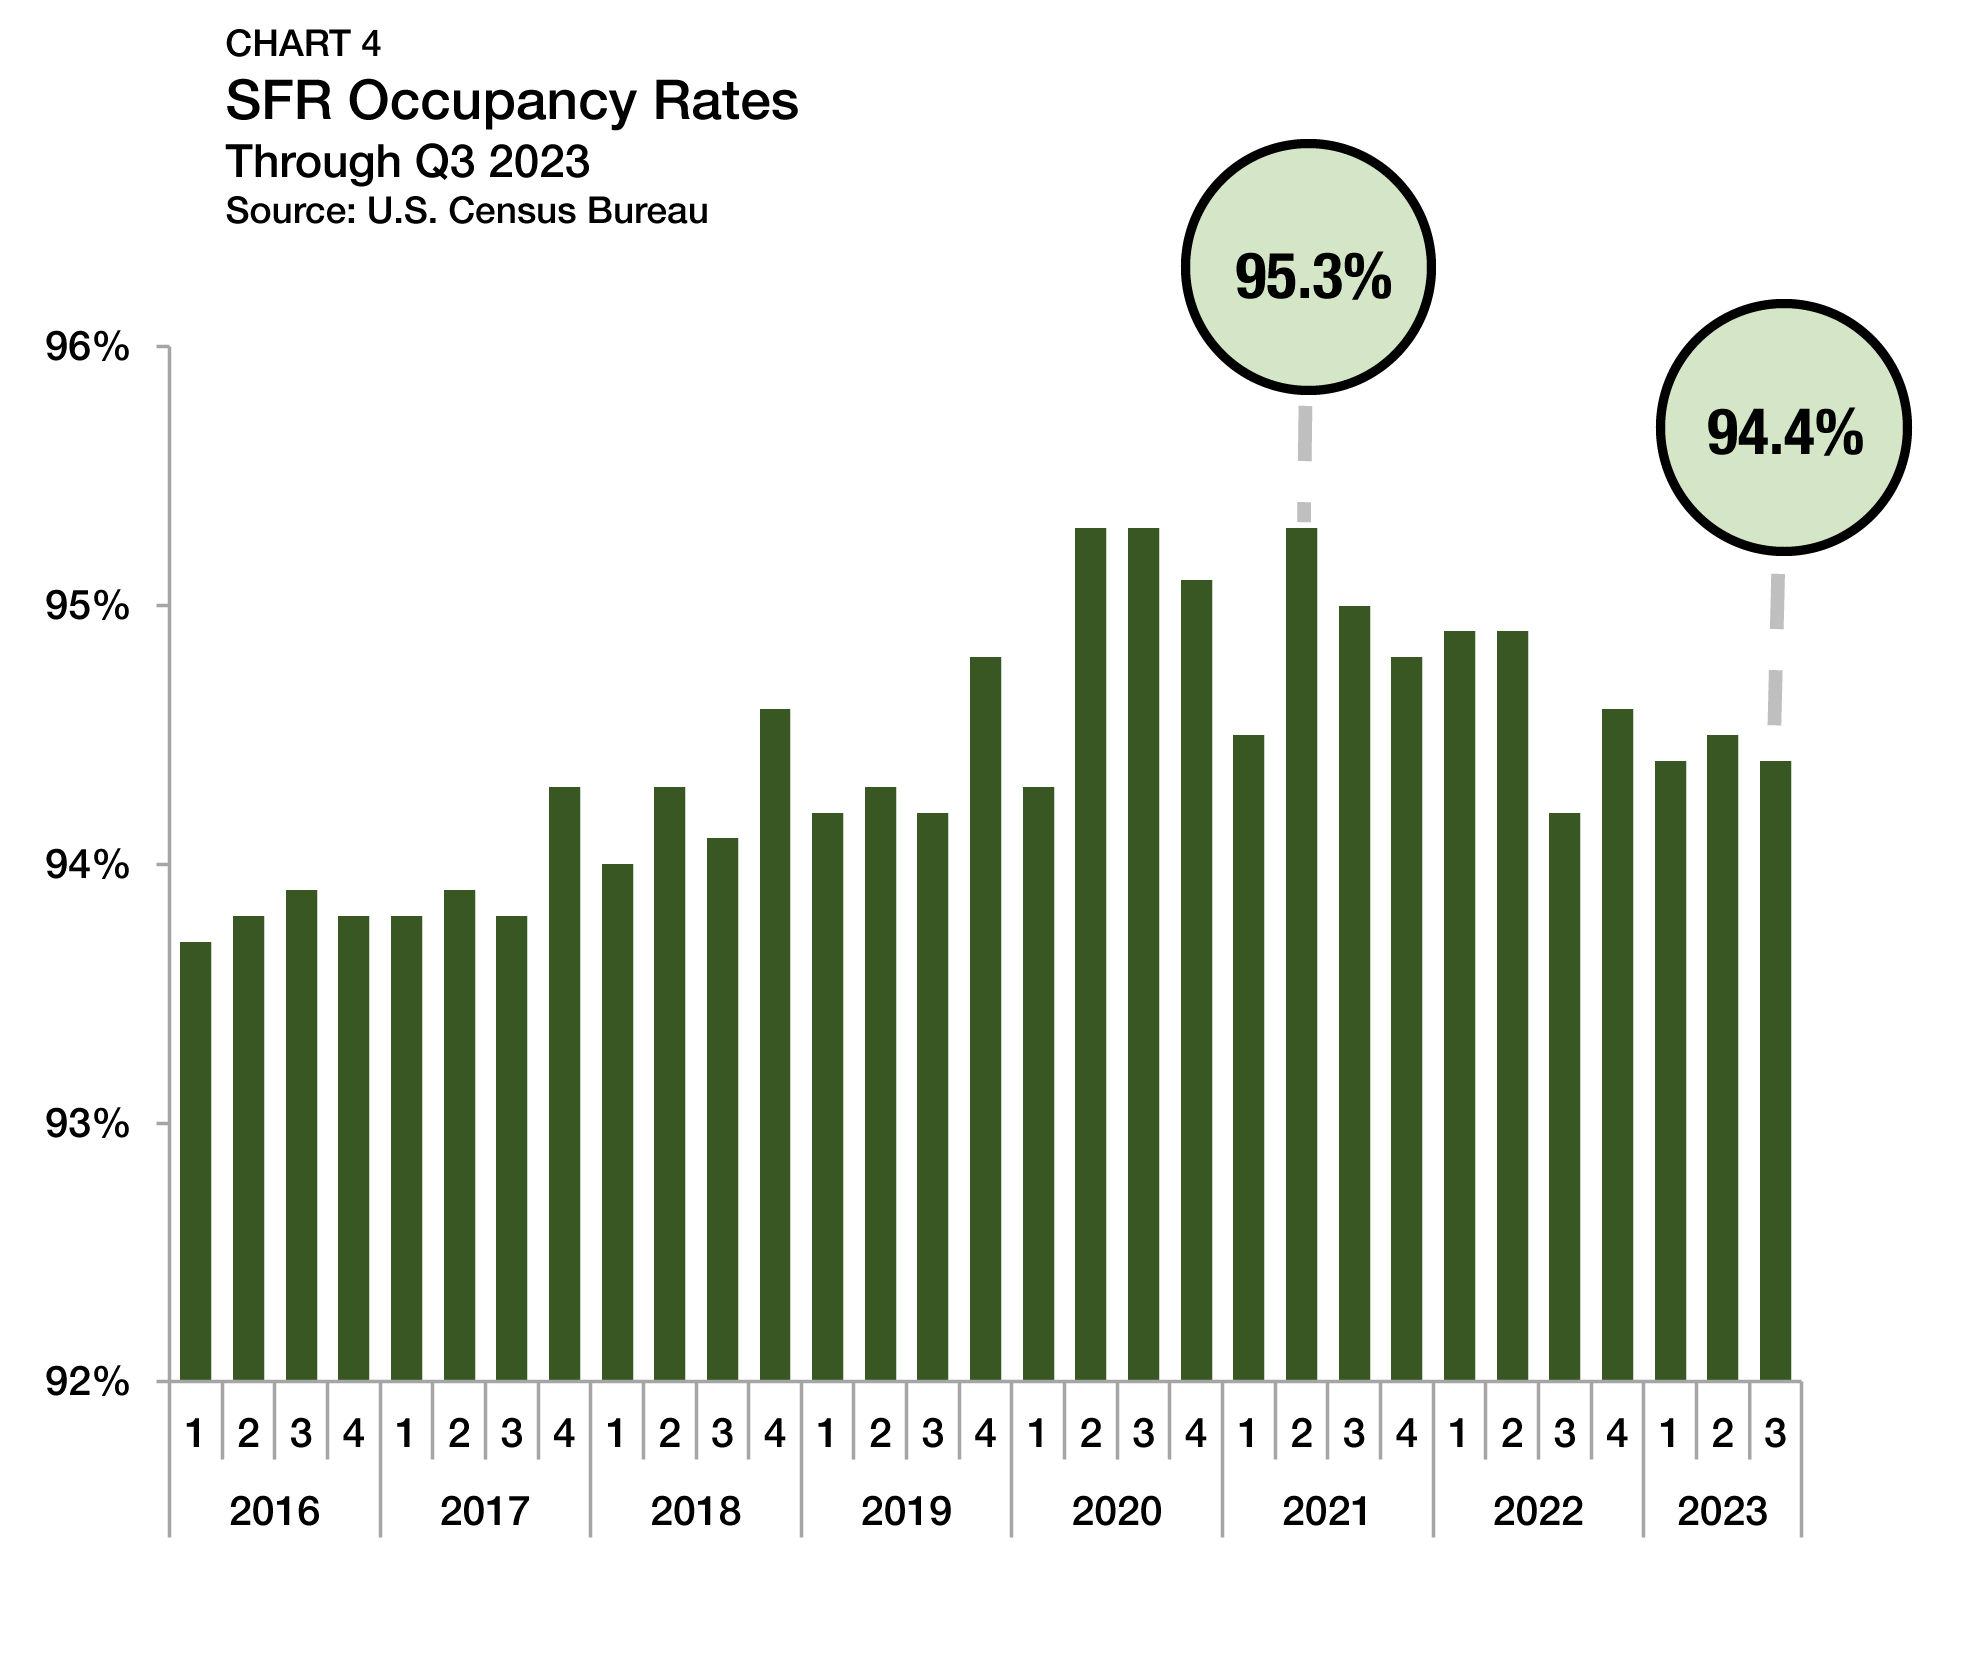
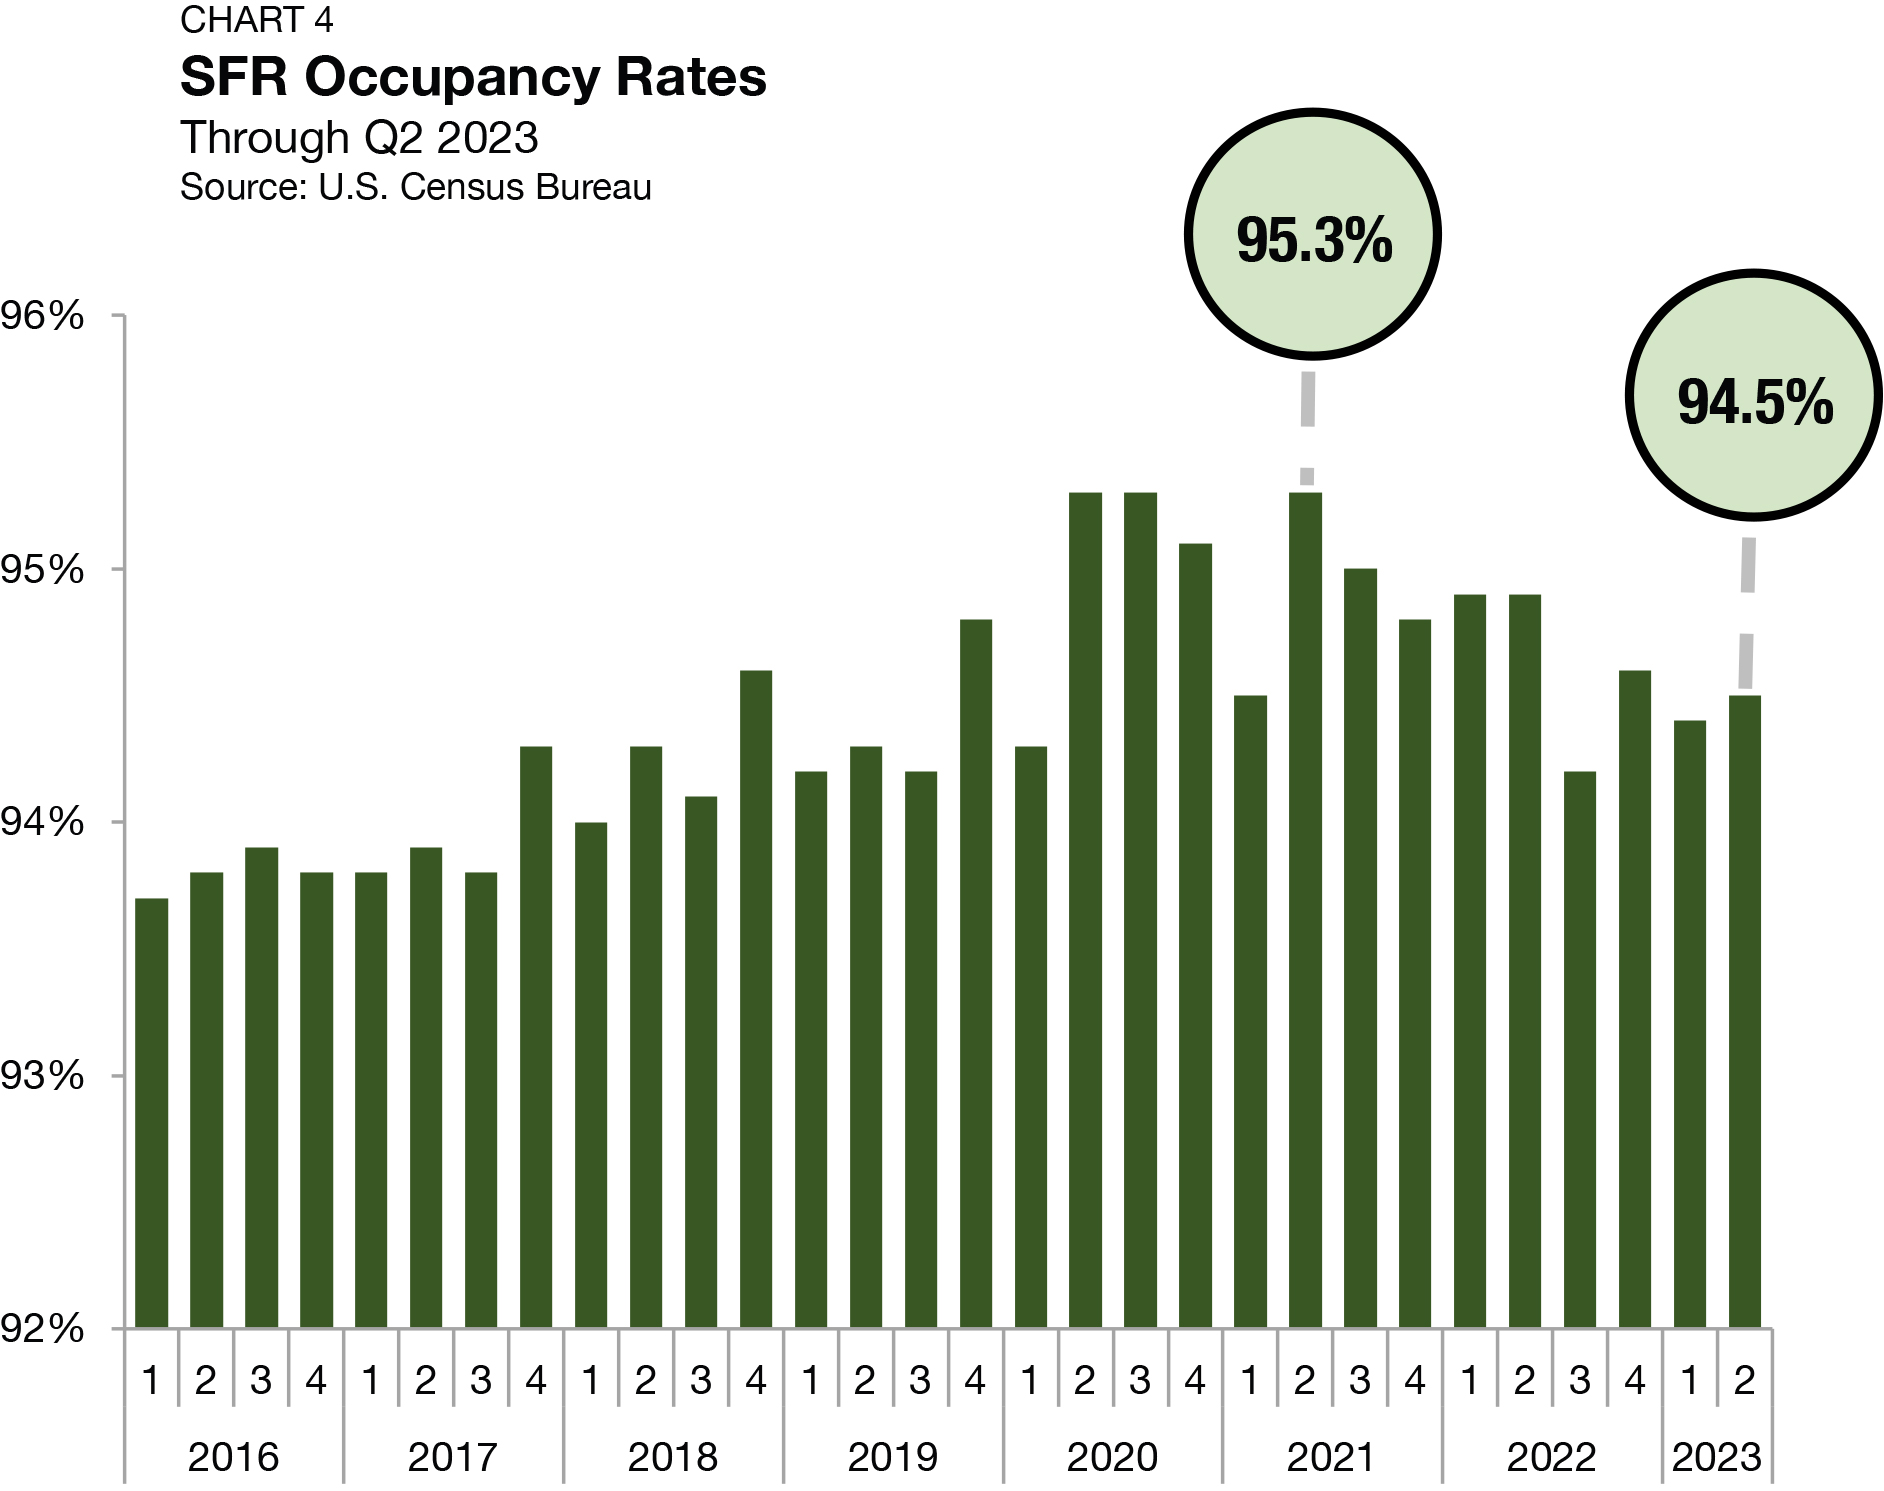
According to the U.S. Census Bureau, occupancy rates across all SFR property types averaged 94.0% in the third quarter of 2024 (Chart 2), which was 60 bps lower than in the second quarter, a relatively sizeable single-period drop-off. Seasonal factors may partially explain the variation. SFR vacancy rates have either risen or held steady during the third quarter in each of the past eight years. Nevertheless, occupancy rates have slid by a cumulative 130 bps from a 2021 peak, showing a sustained uptick in vacancies.

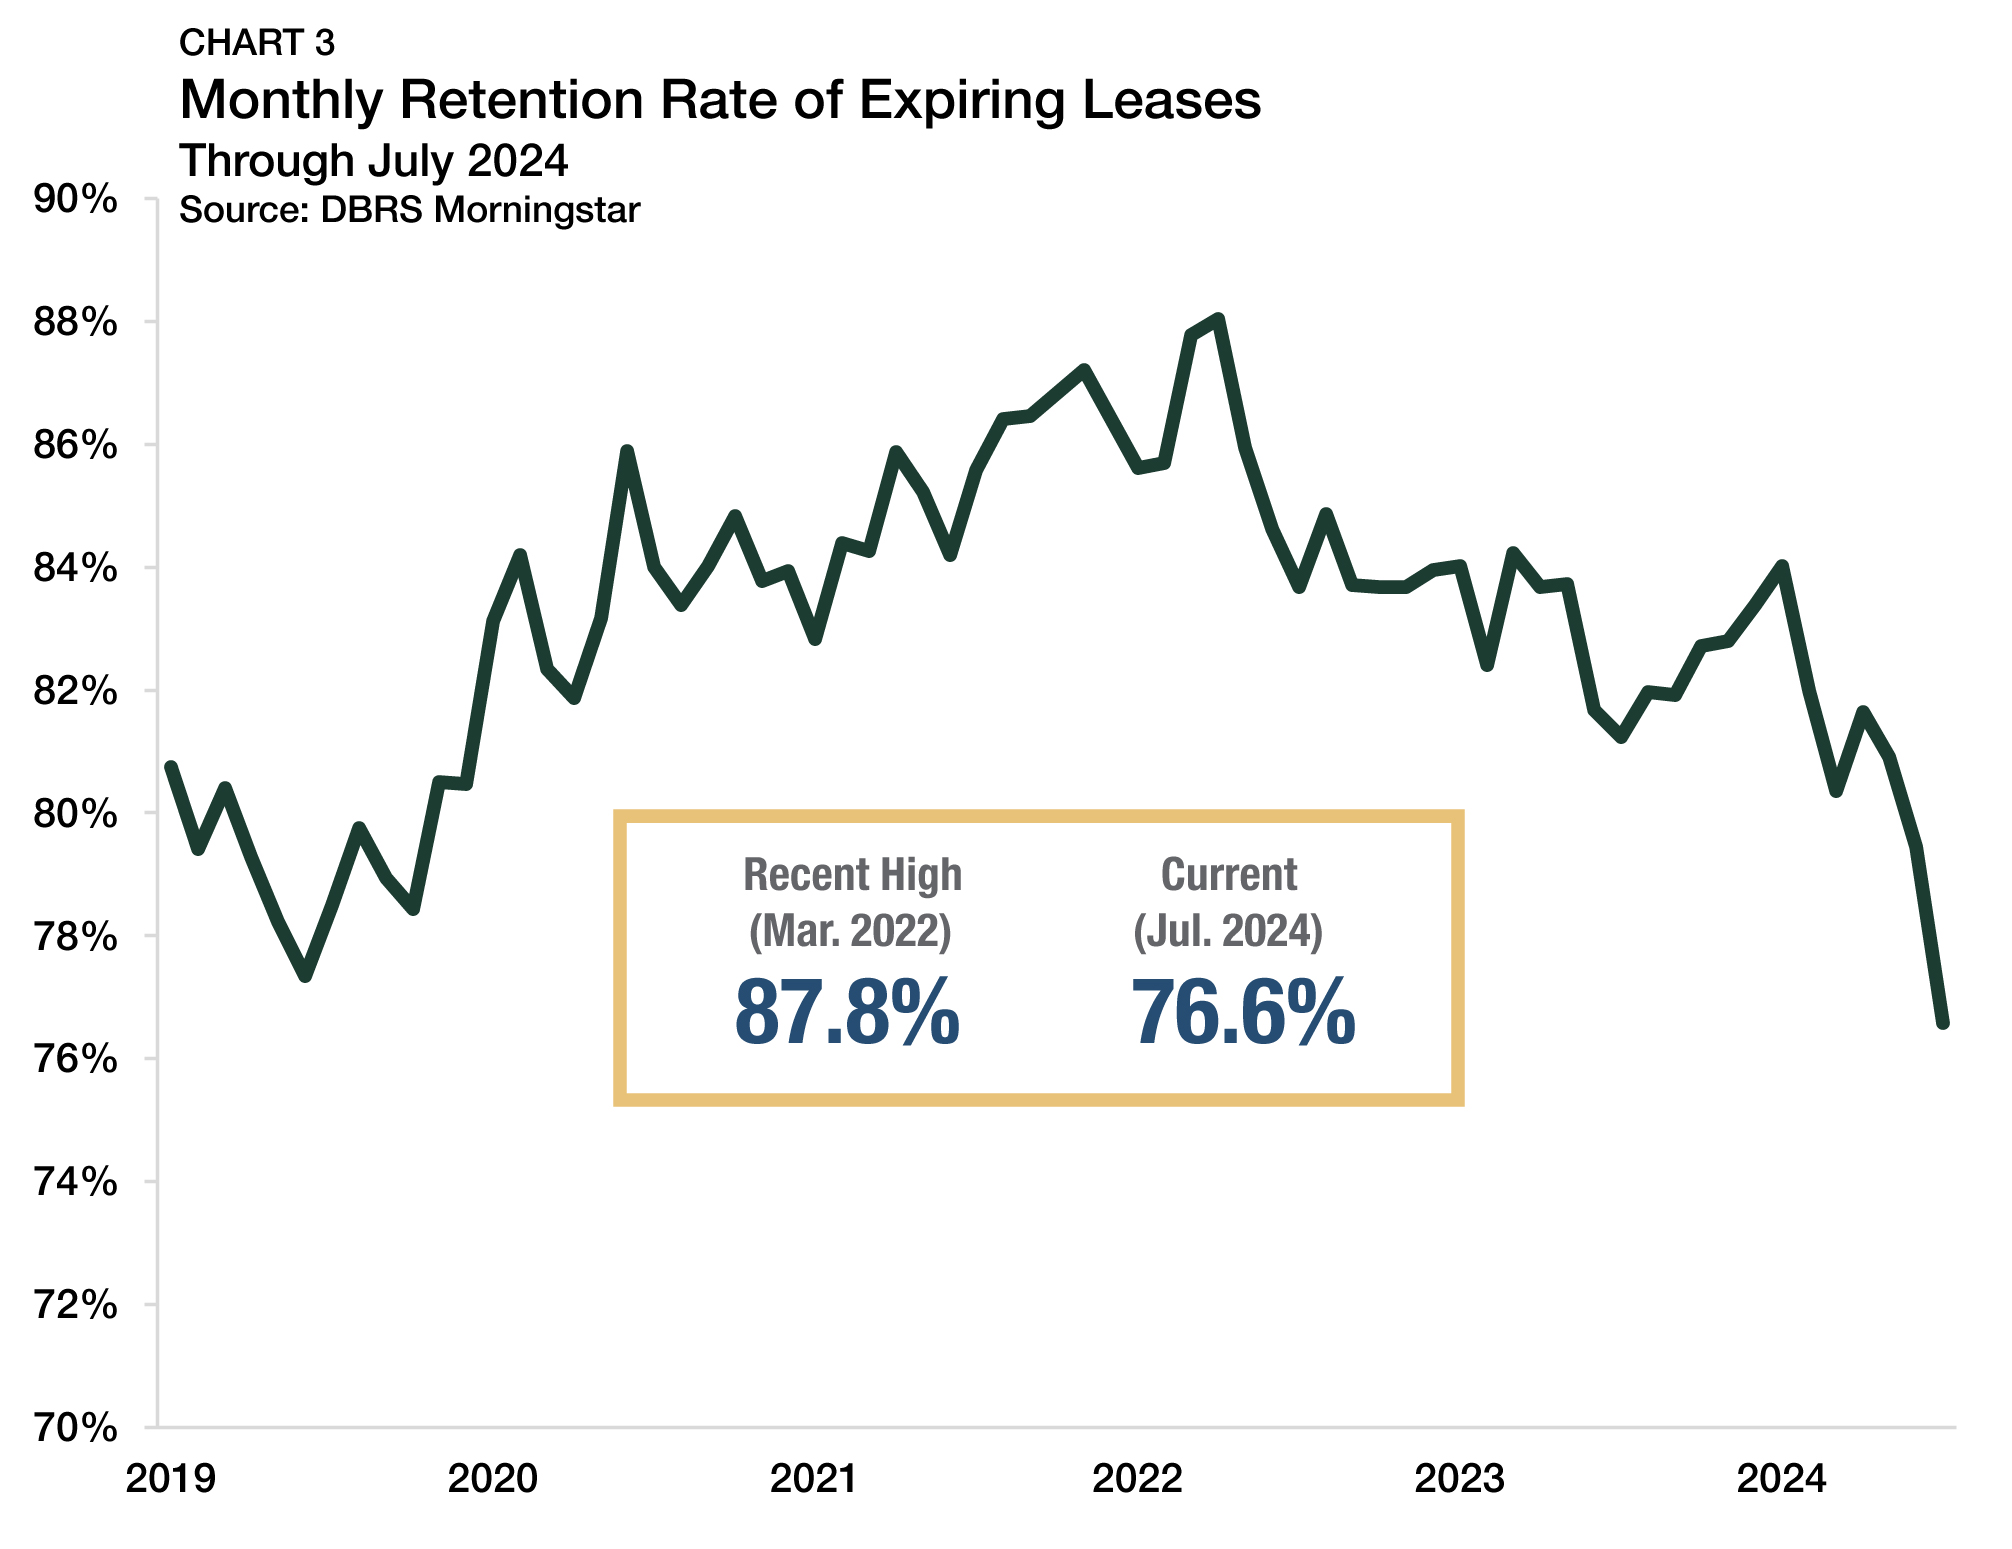
Data from DBRS Morningstar shows that retention rates for expiring leases have dipped significantly this year, falling to a recent low point of 76.6% through July 2024 (Chart 3), which indicates that fewer tenants are re-signing. Compared to a high of 87.8% in March 2022, retention rates have decreased by 11.2 percentage points on average. With fewer tenants re-signing leases, increased unit turnovers have put downward pressure on occupancy rates.
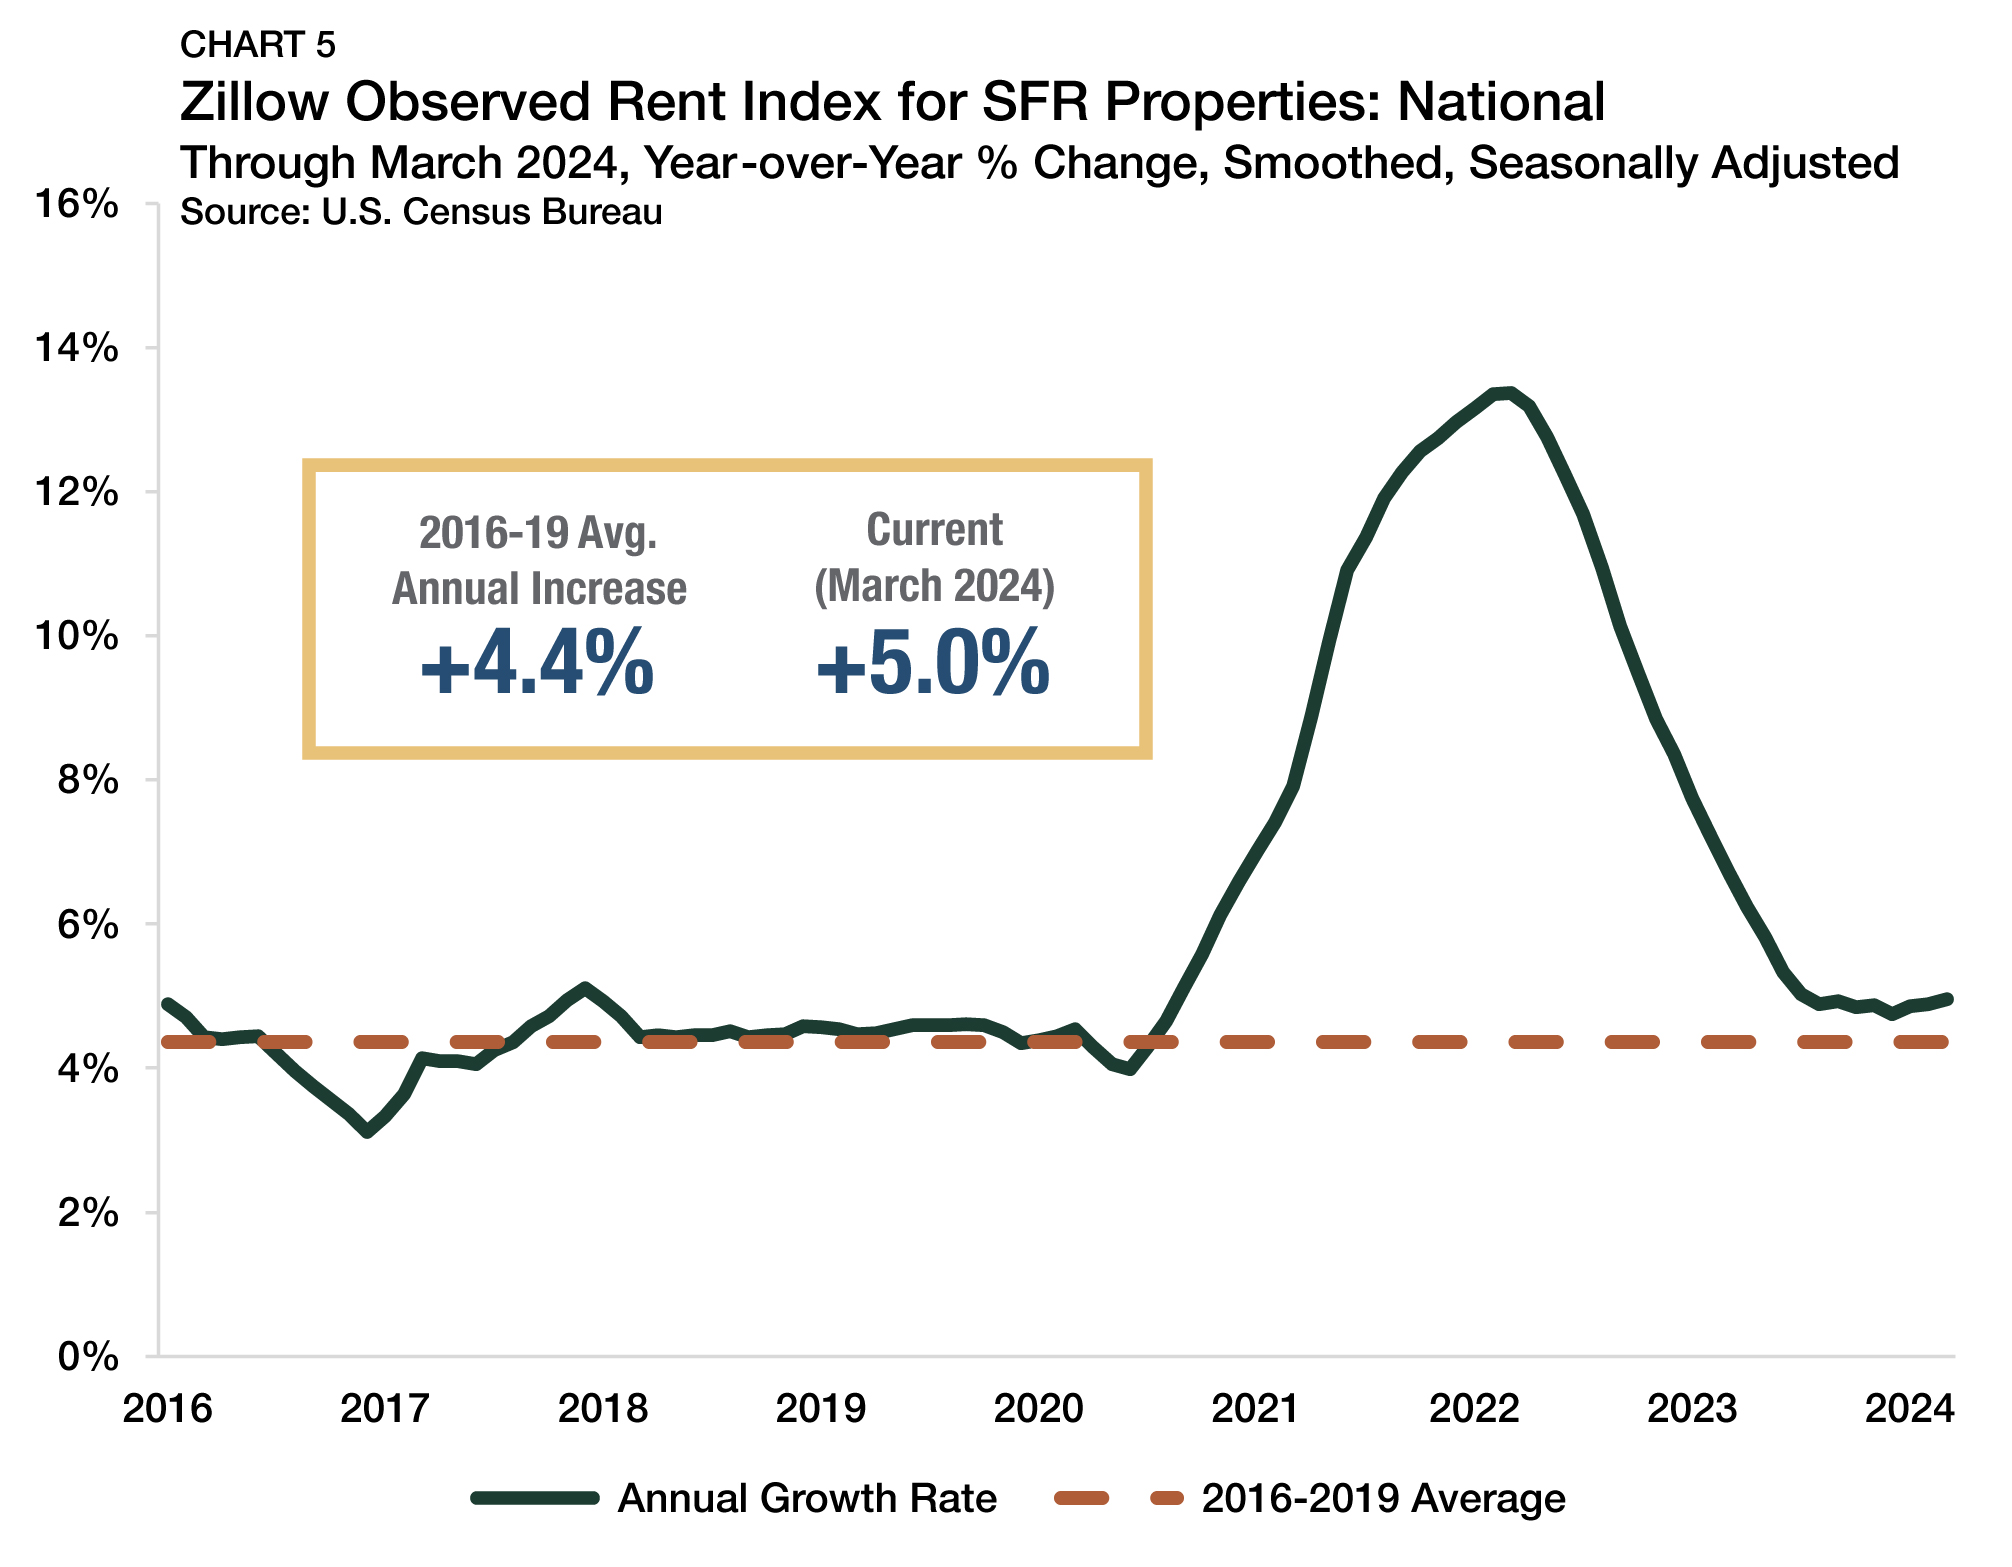
Rent Growth: National
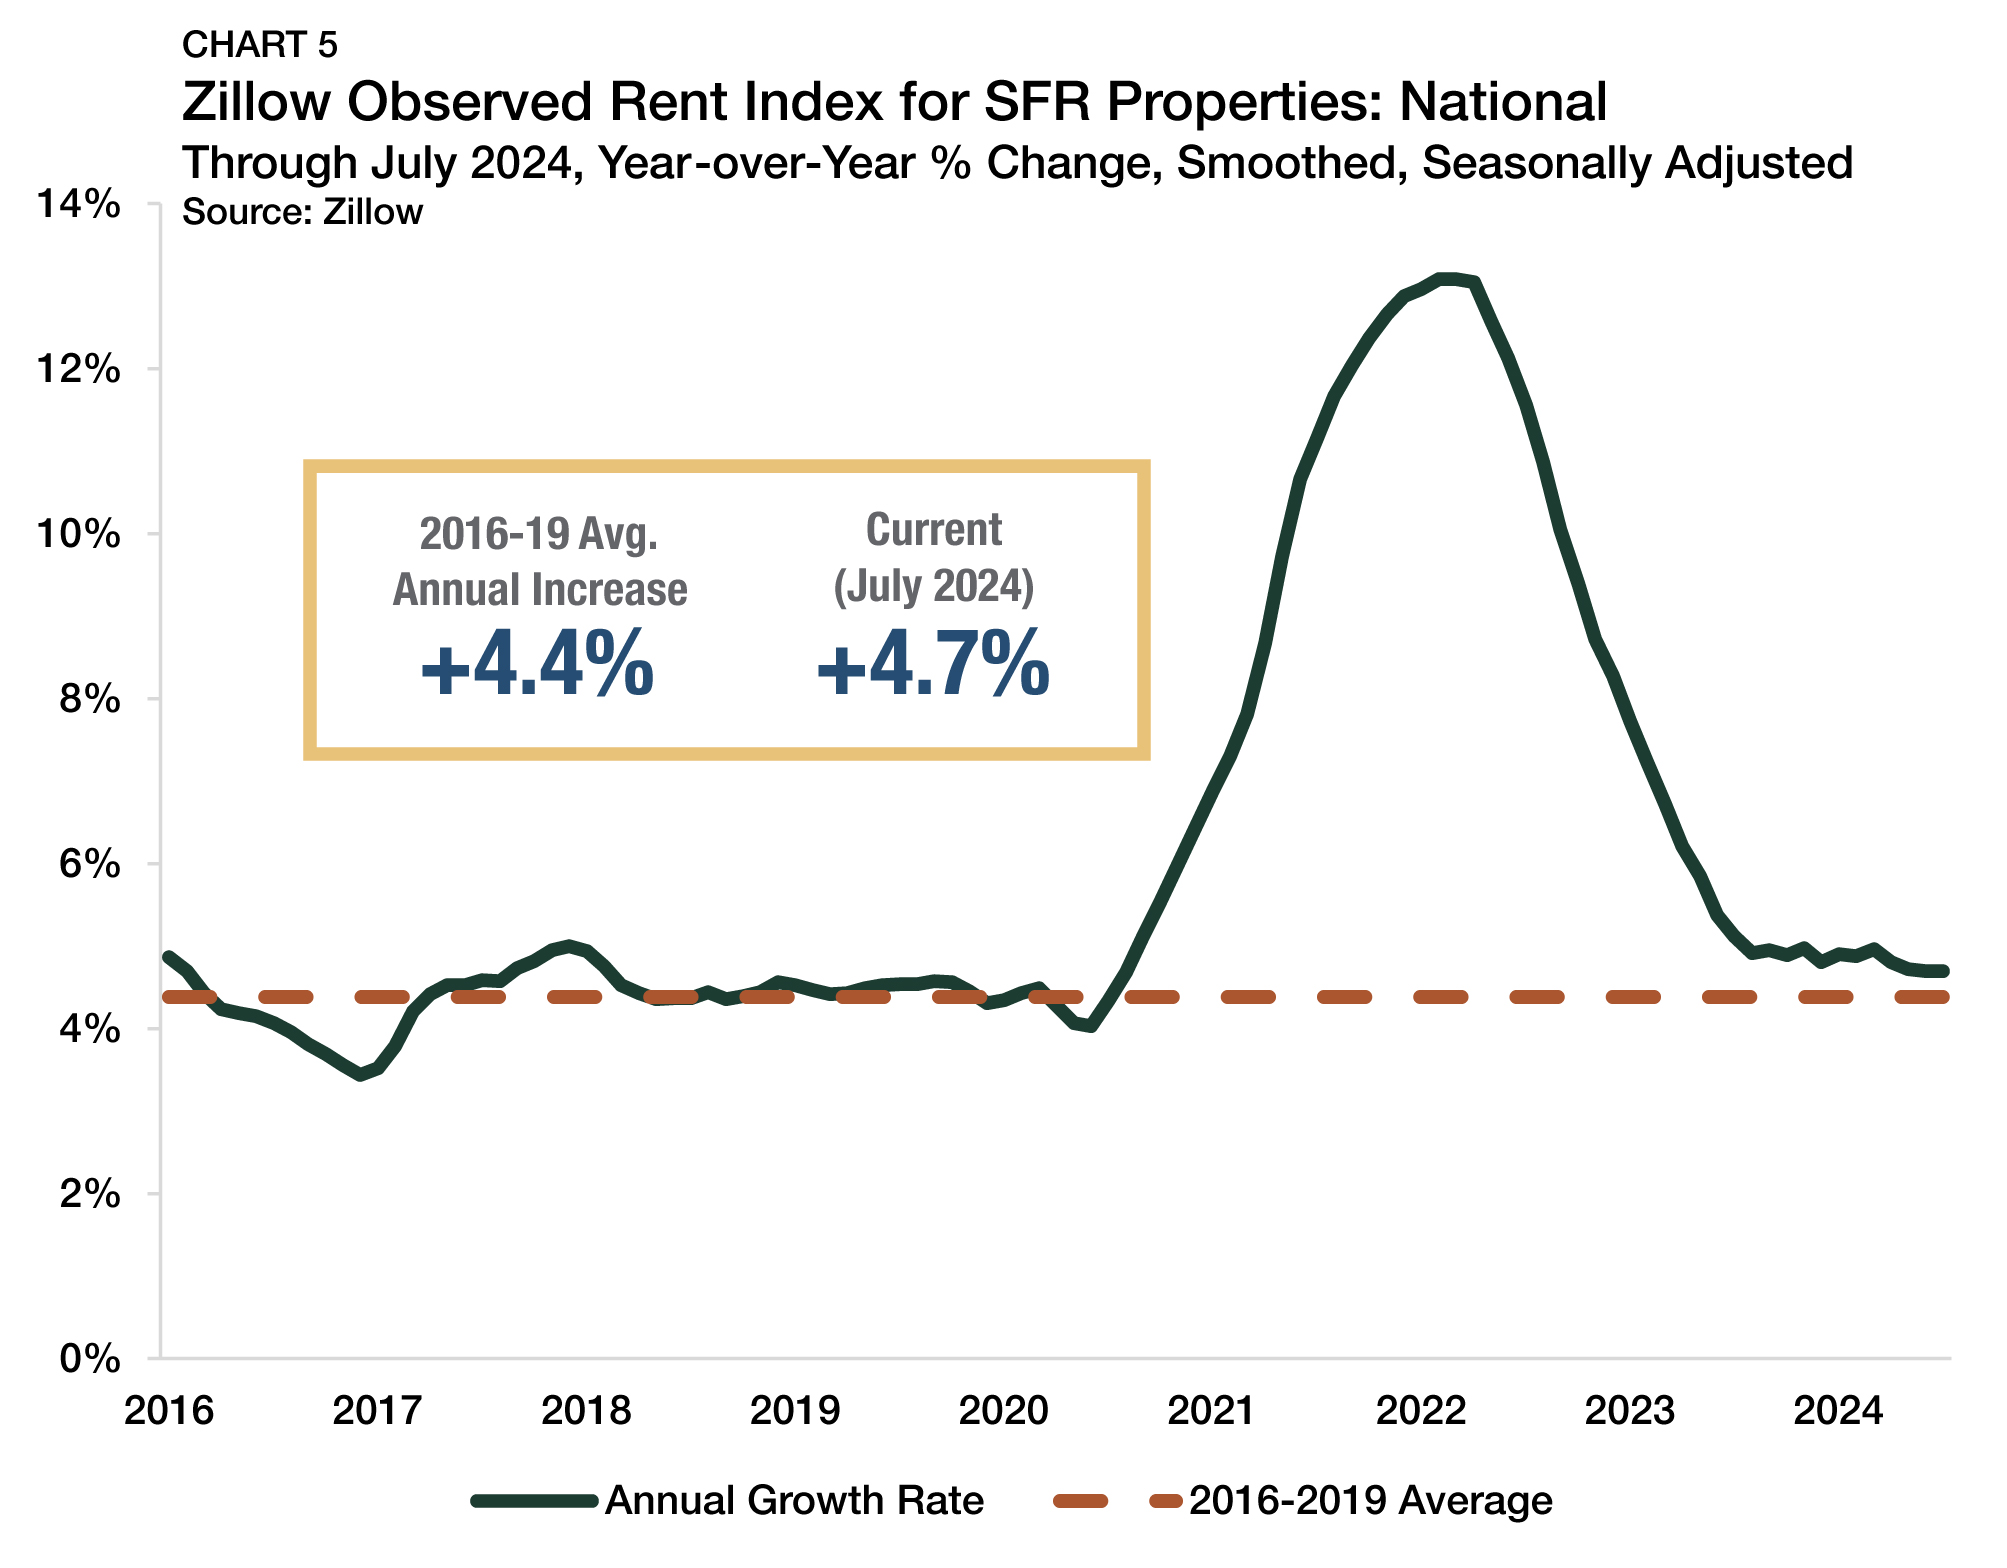
National SFR rent growth continued to increase at a healthy pace. According to Zillow’s Observed Rent Index, rents in the sector were up 4.4% from a year earlier through October 2024 (Chart 4). While rent growth has retreated from the double-digit growth rates of 2021 and 2022, its most recent pace remains in line with the sector’s pre-pandemic track record. Between 2016 and 2019, SFR rents grew at an average annual pace of 4.4%, identical to the current growth rate.
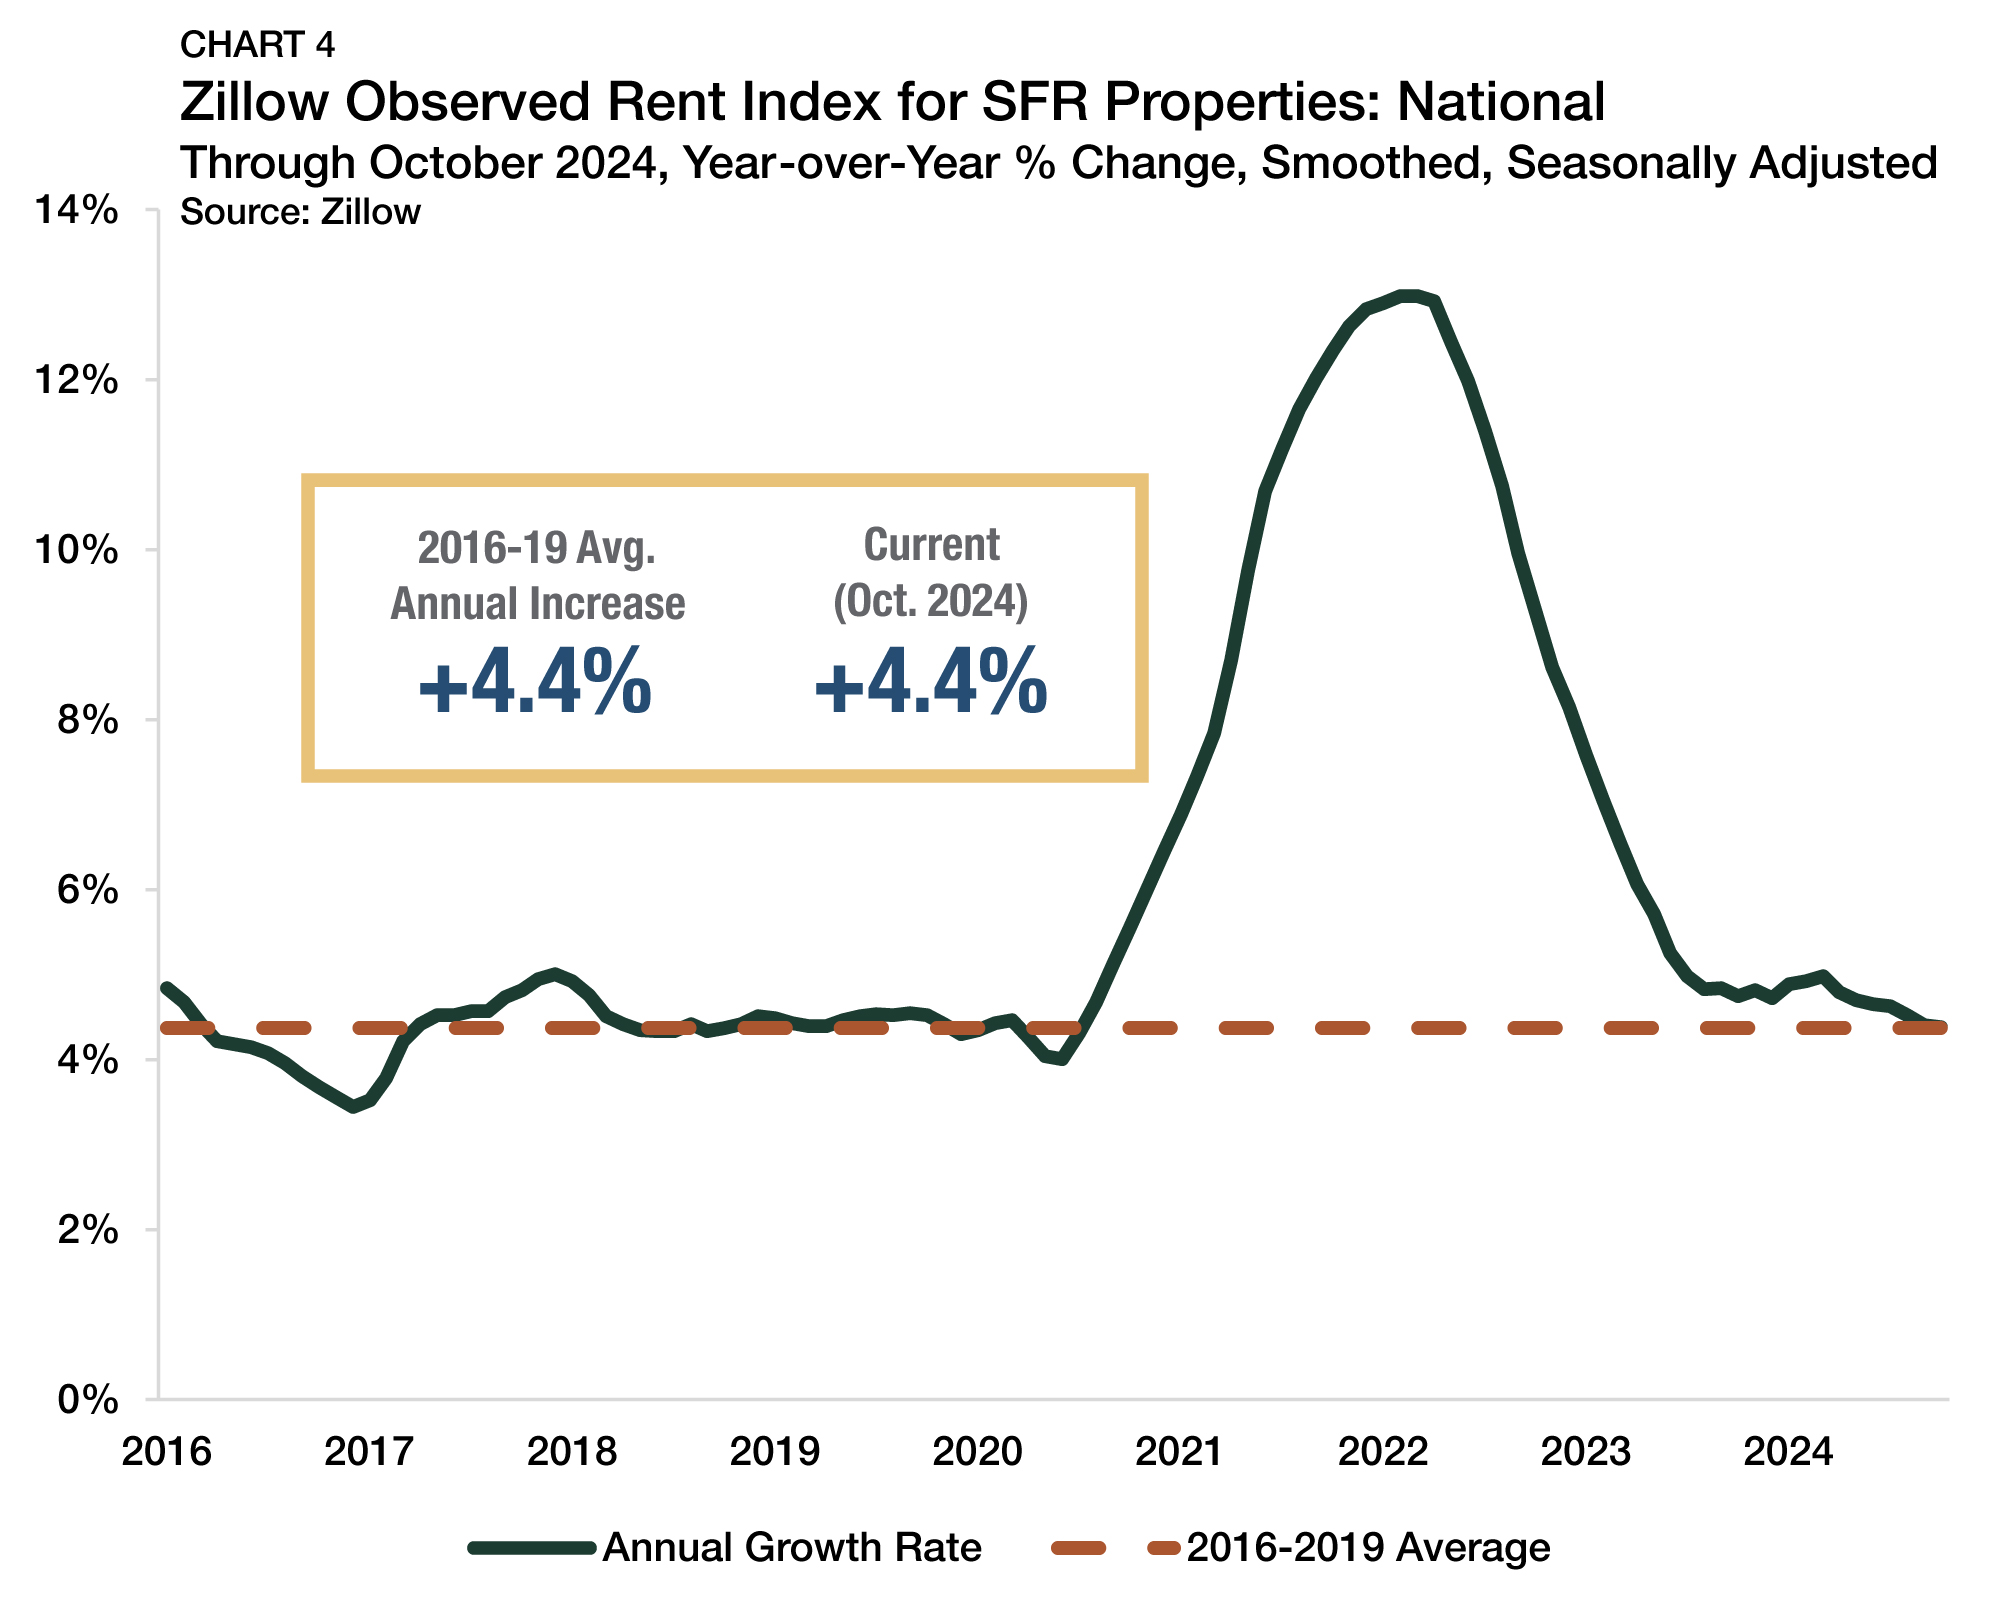
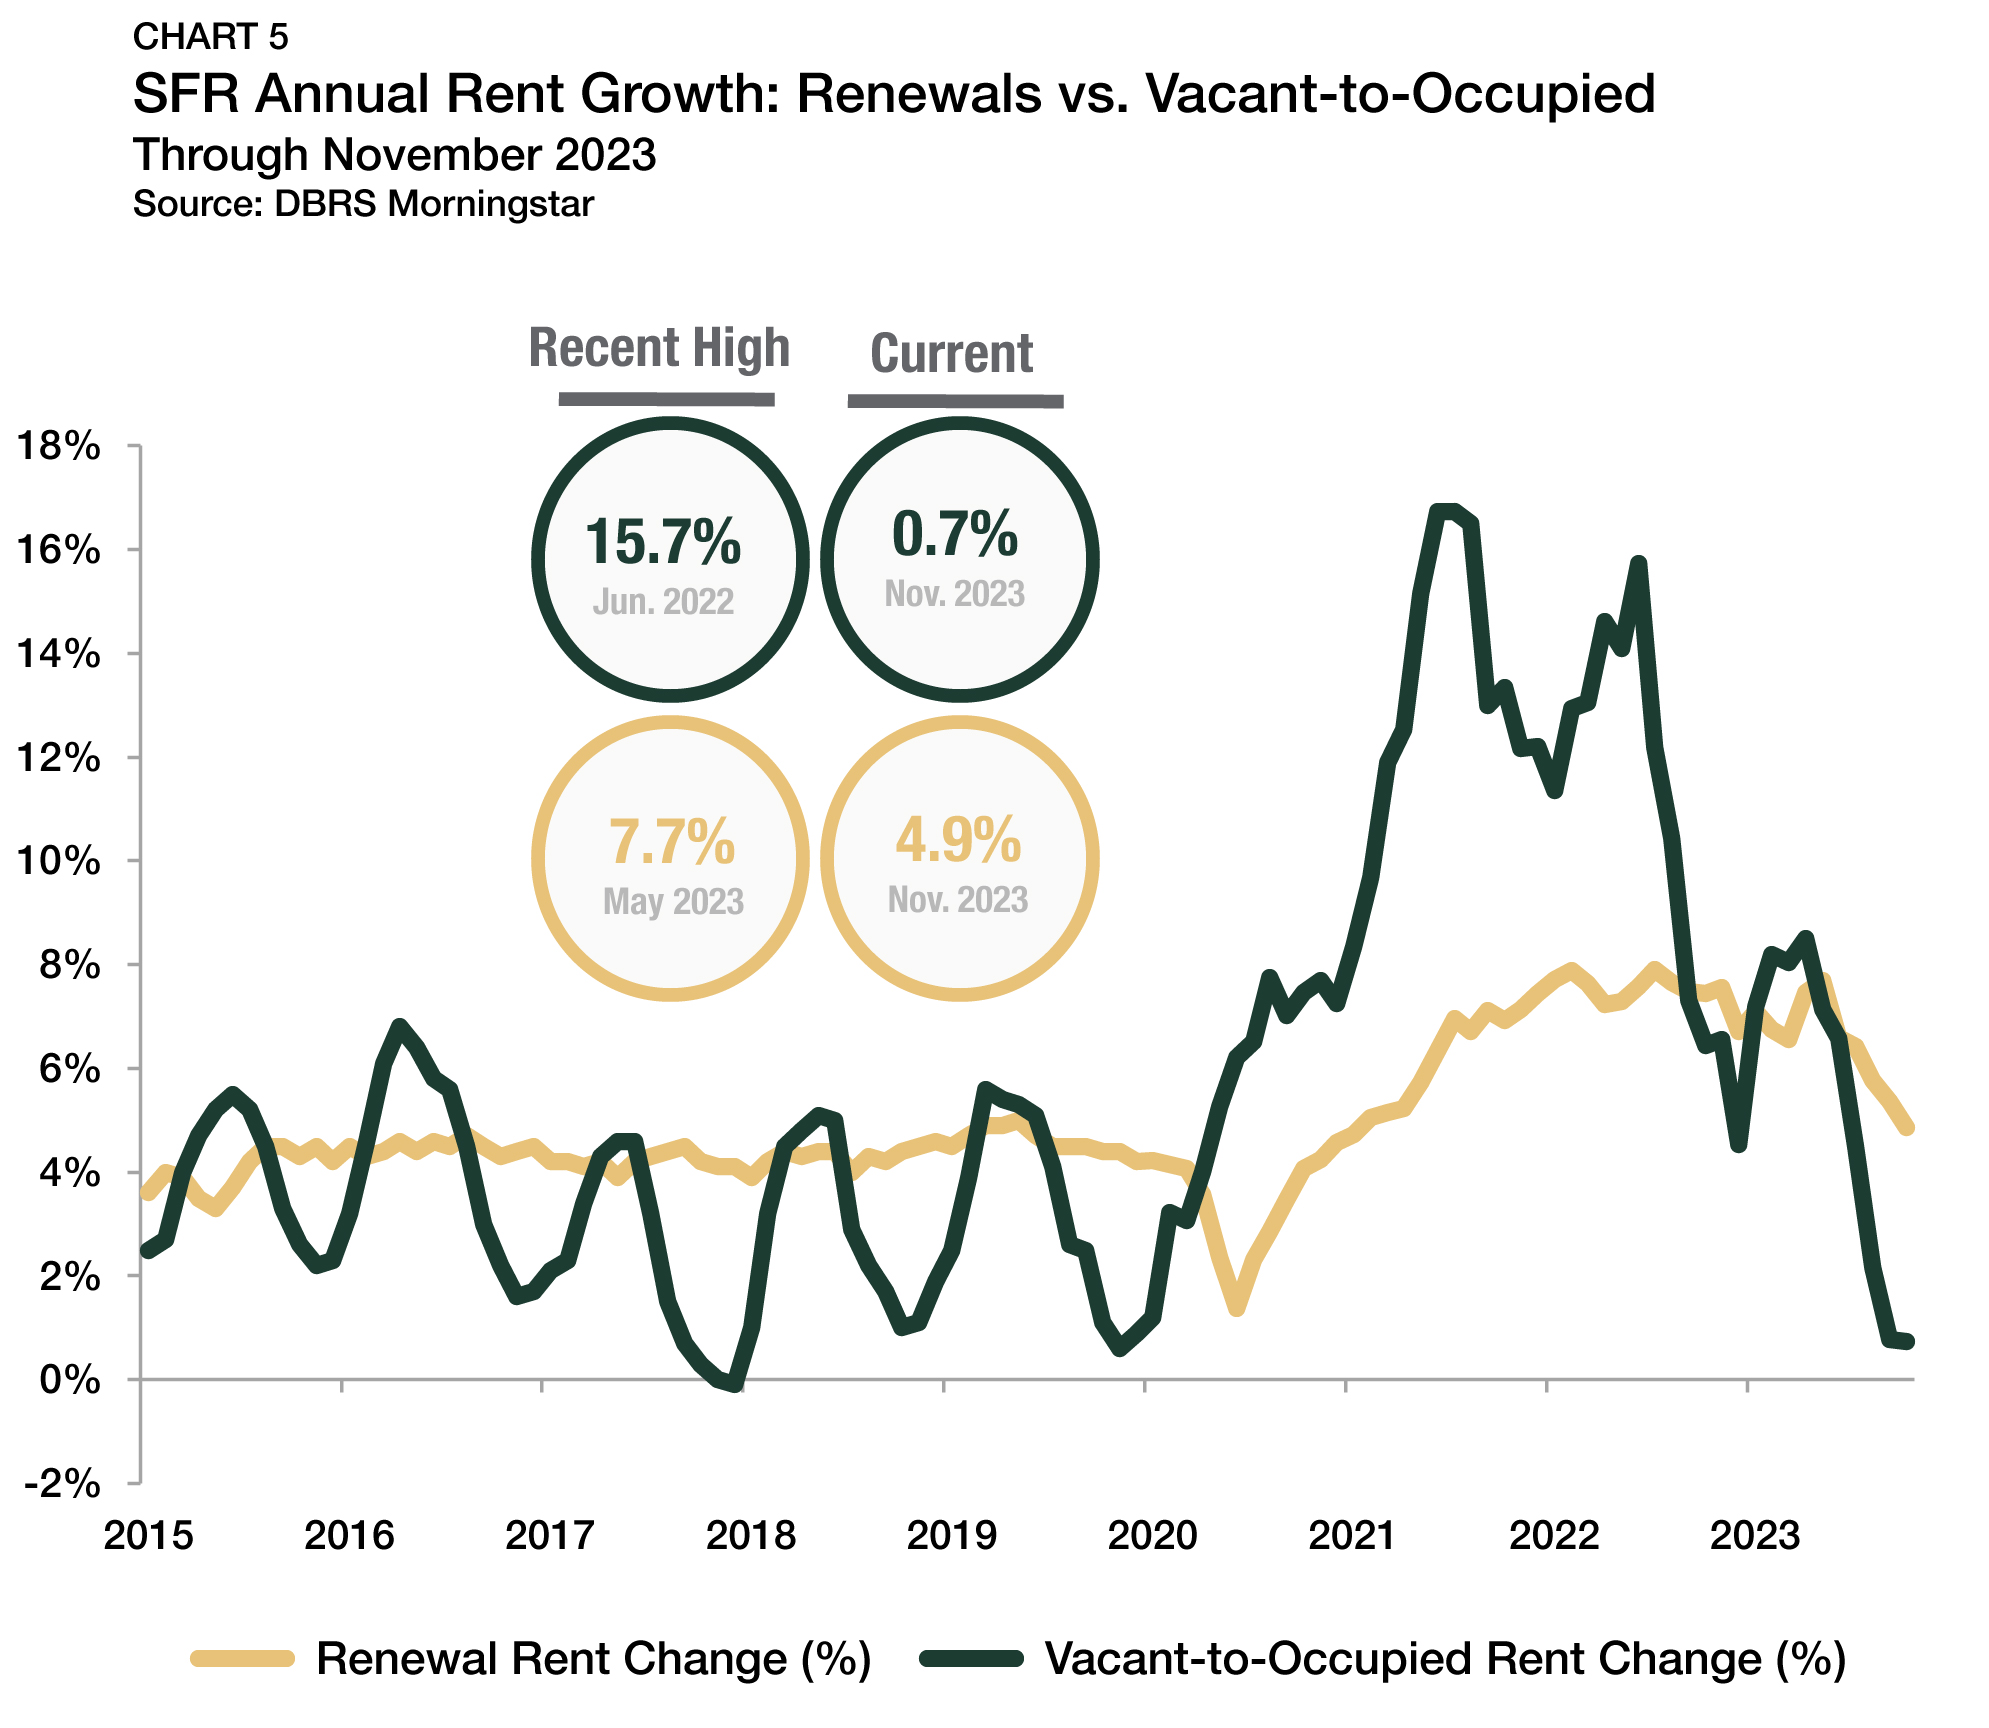
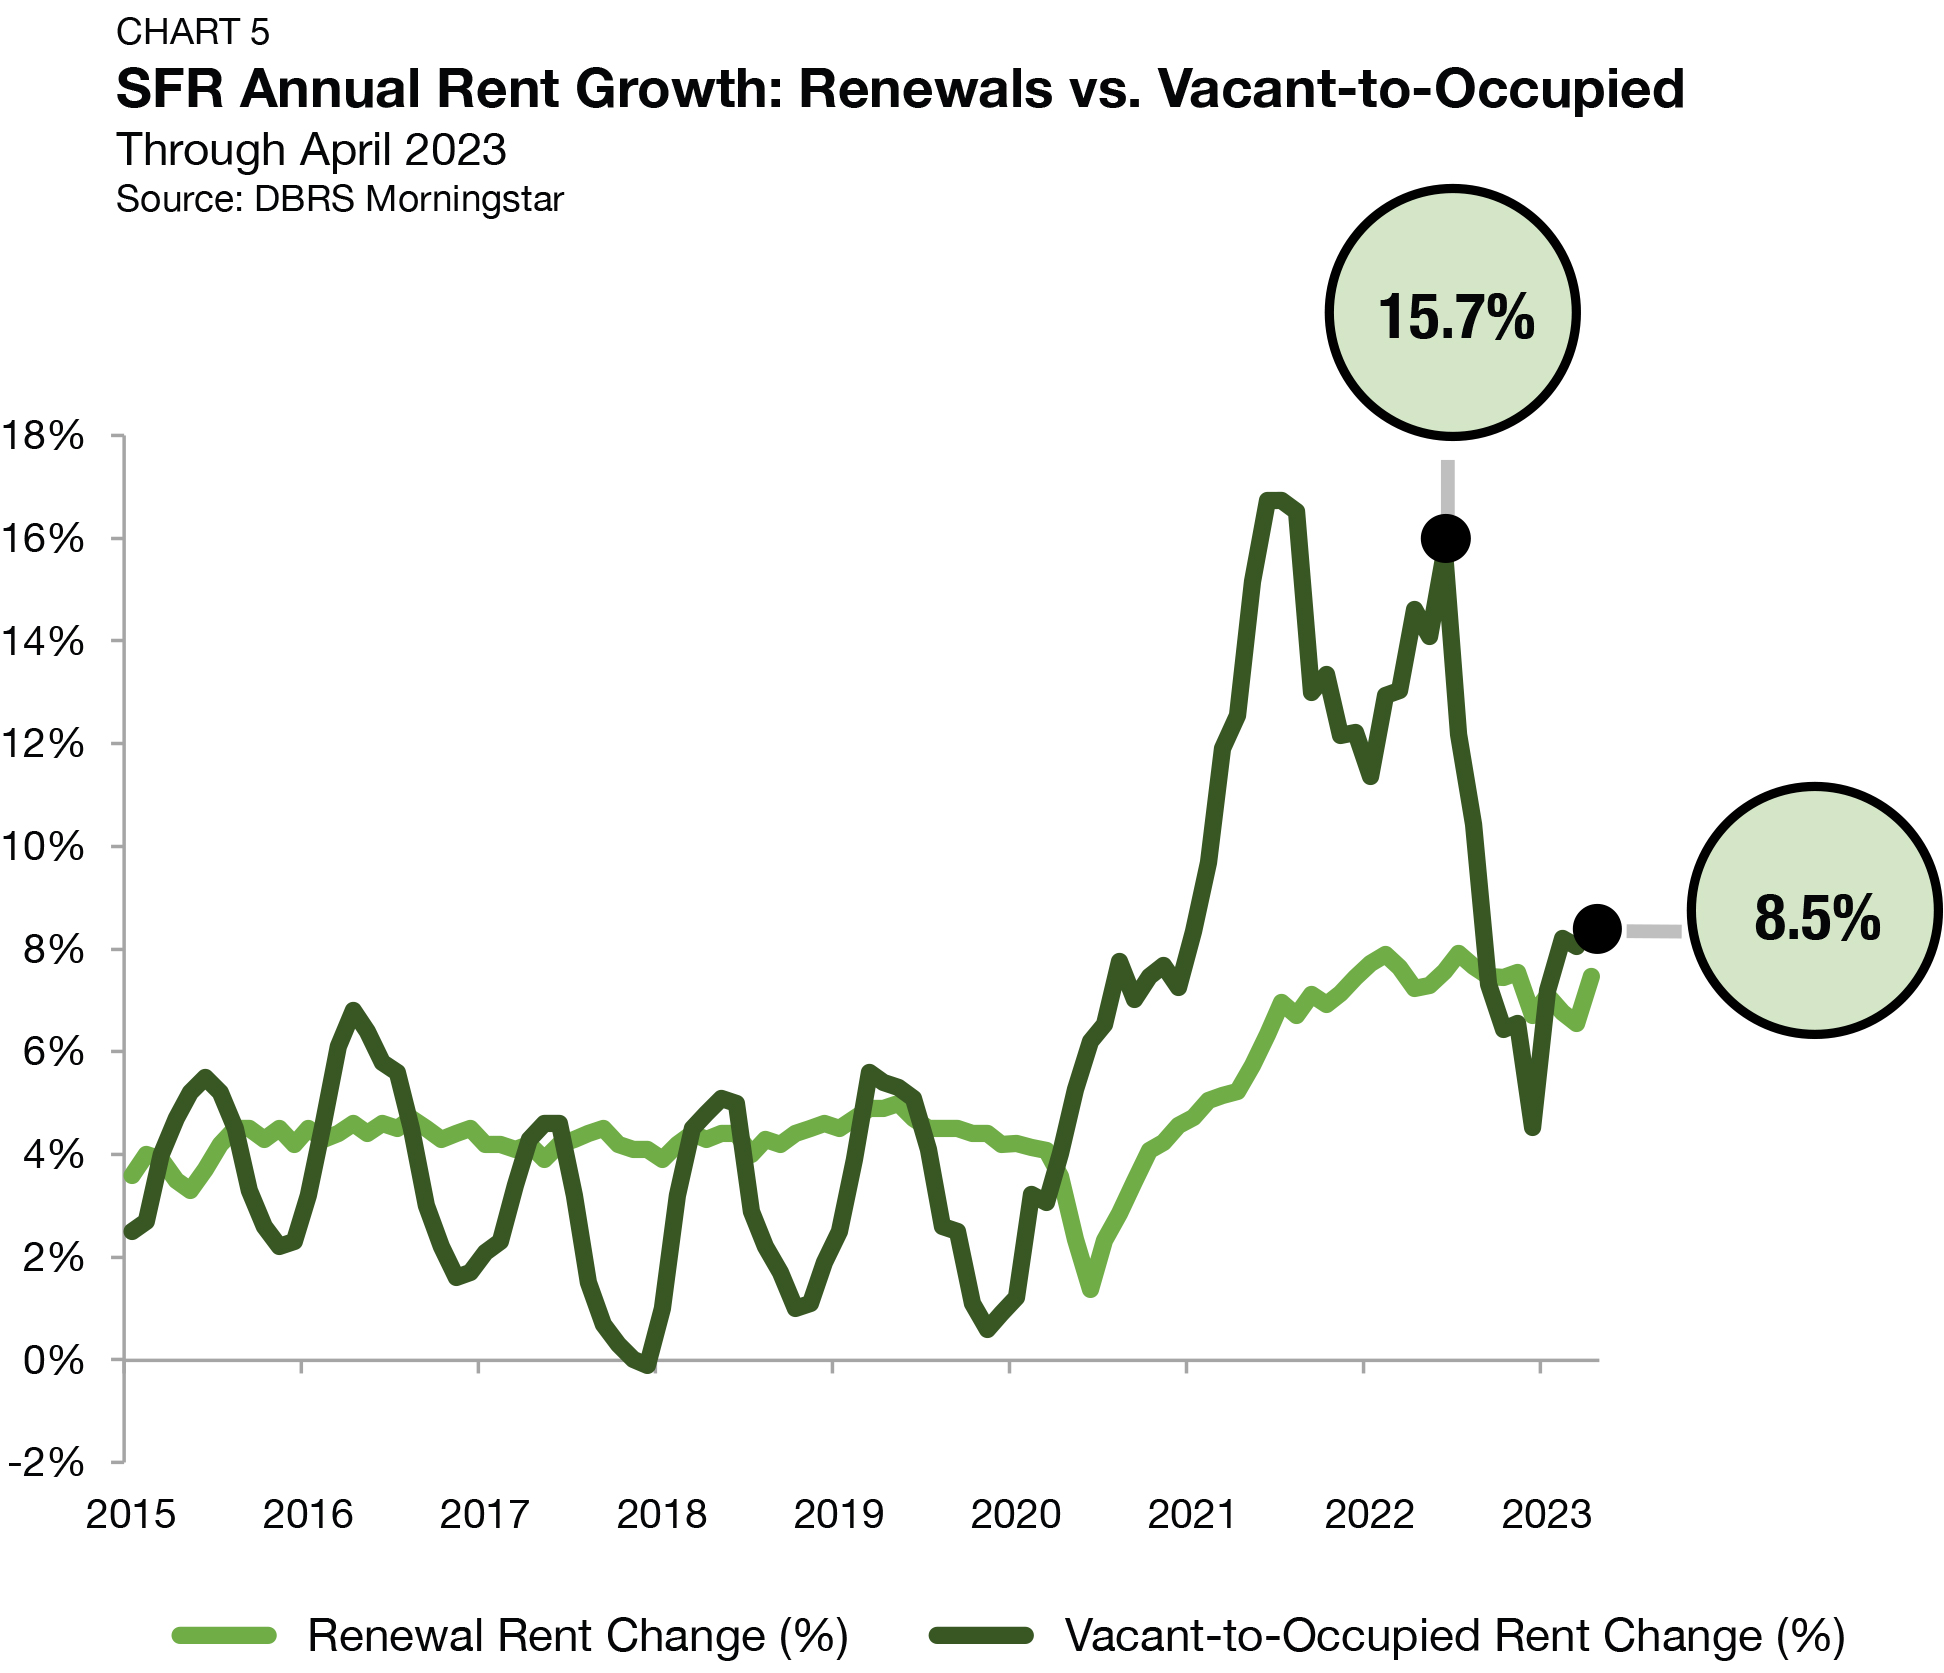
DBRS Morningstar’s latest SFR report shows the resumption of seasonal patterns for rent growth, lease renewals, and tenant turnover. Vacant-to-occupied (V2O) rent growth sat at just 0.9% through July, down from a 2024-high point of 4.0% set in February. Meanwhile, renewal rent growth, which generally accounts for 80%-85% of the sector’s units, stood higher at 5.5% over the same period.
Rent Growth: Metros
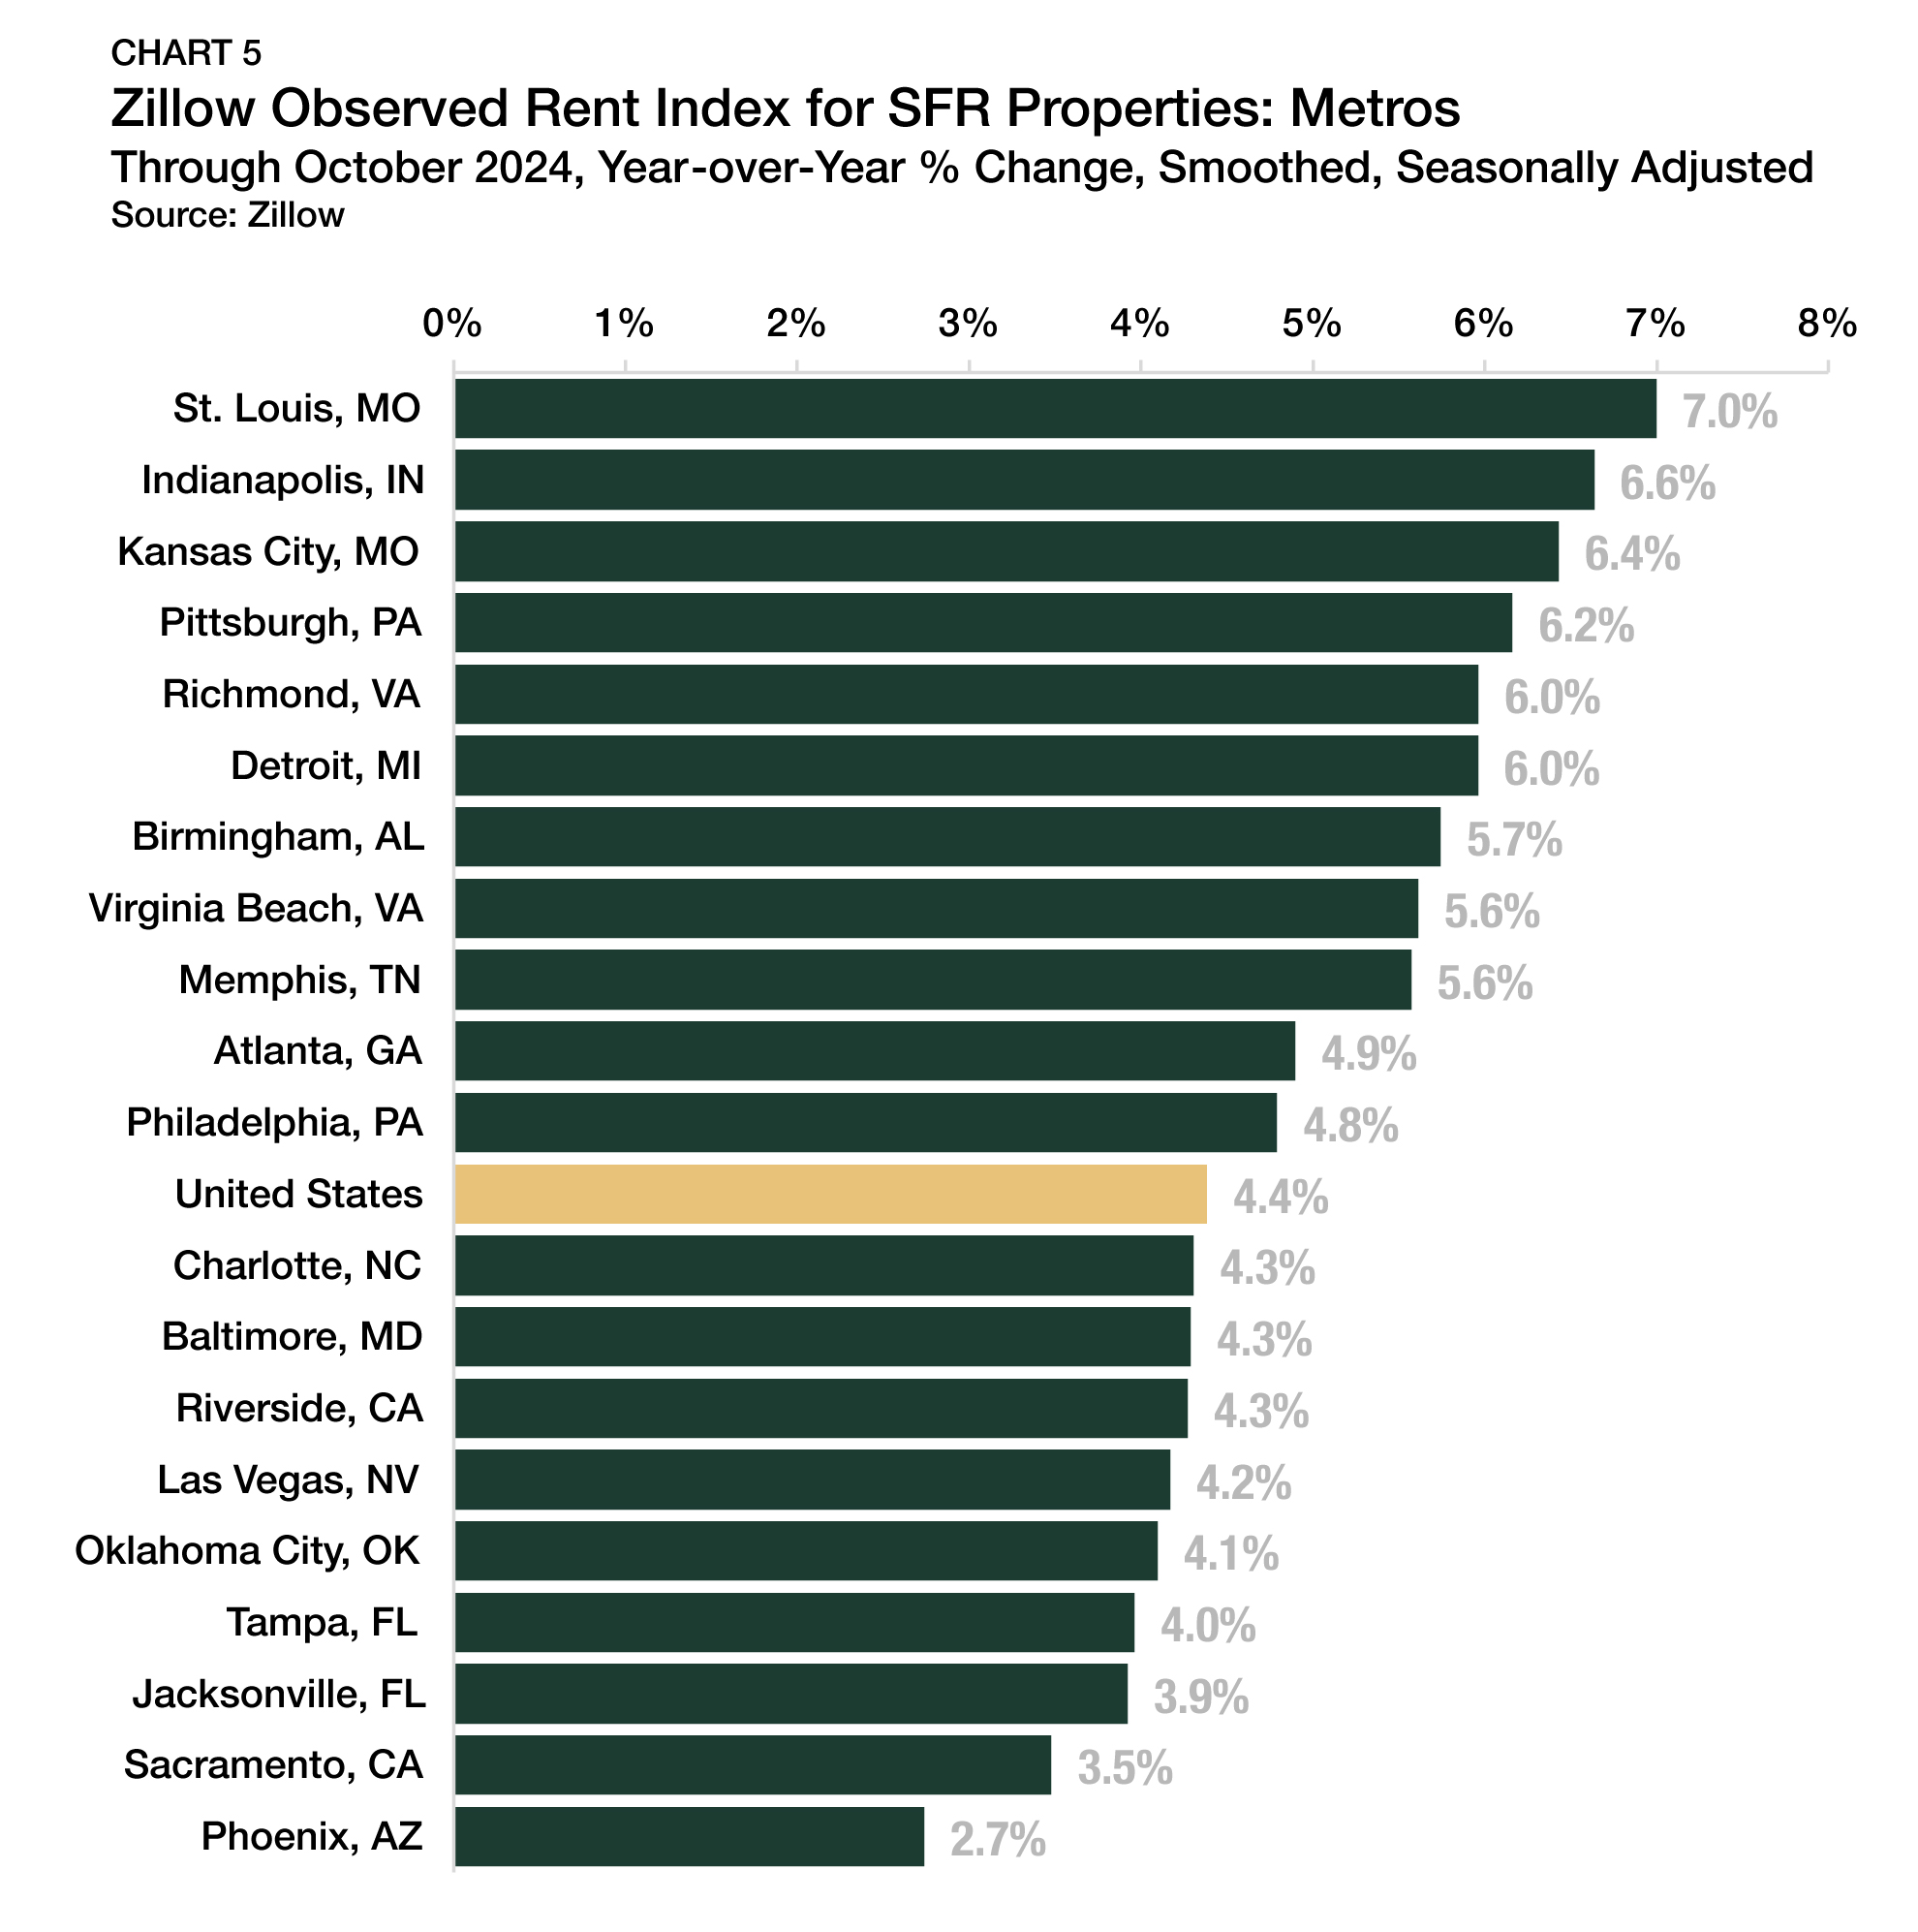
Among the top 20 hotspot markets (defined here as markets with the highest SFR share of rentals across the top 50 metros by population), St. Louis, MO, has been seeing the most robust levels of annual rent growth, with prices rising 7.0% from a year earlier through October 2024 (Chart 5). Indianapolis, IN (+6.6%) and Kansas City, MO (+6.4%) followed closely behind. Several Sun Belt markets that accelerated most quickly during the post-pandemic boom and cooled afterward, including Phoenix, AZ (+2.7%), Sacramento, CA (+3.5%), and Jacksonville, FL (+3.9%), sit at the other end of the spectrum.
Cap Rates
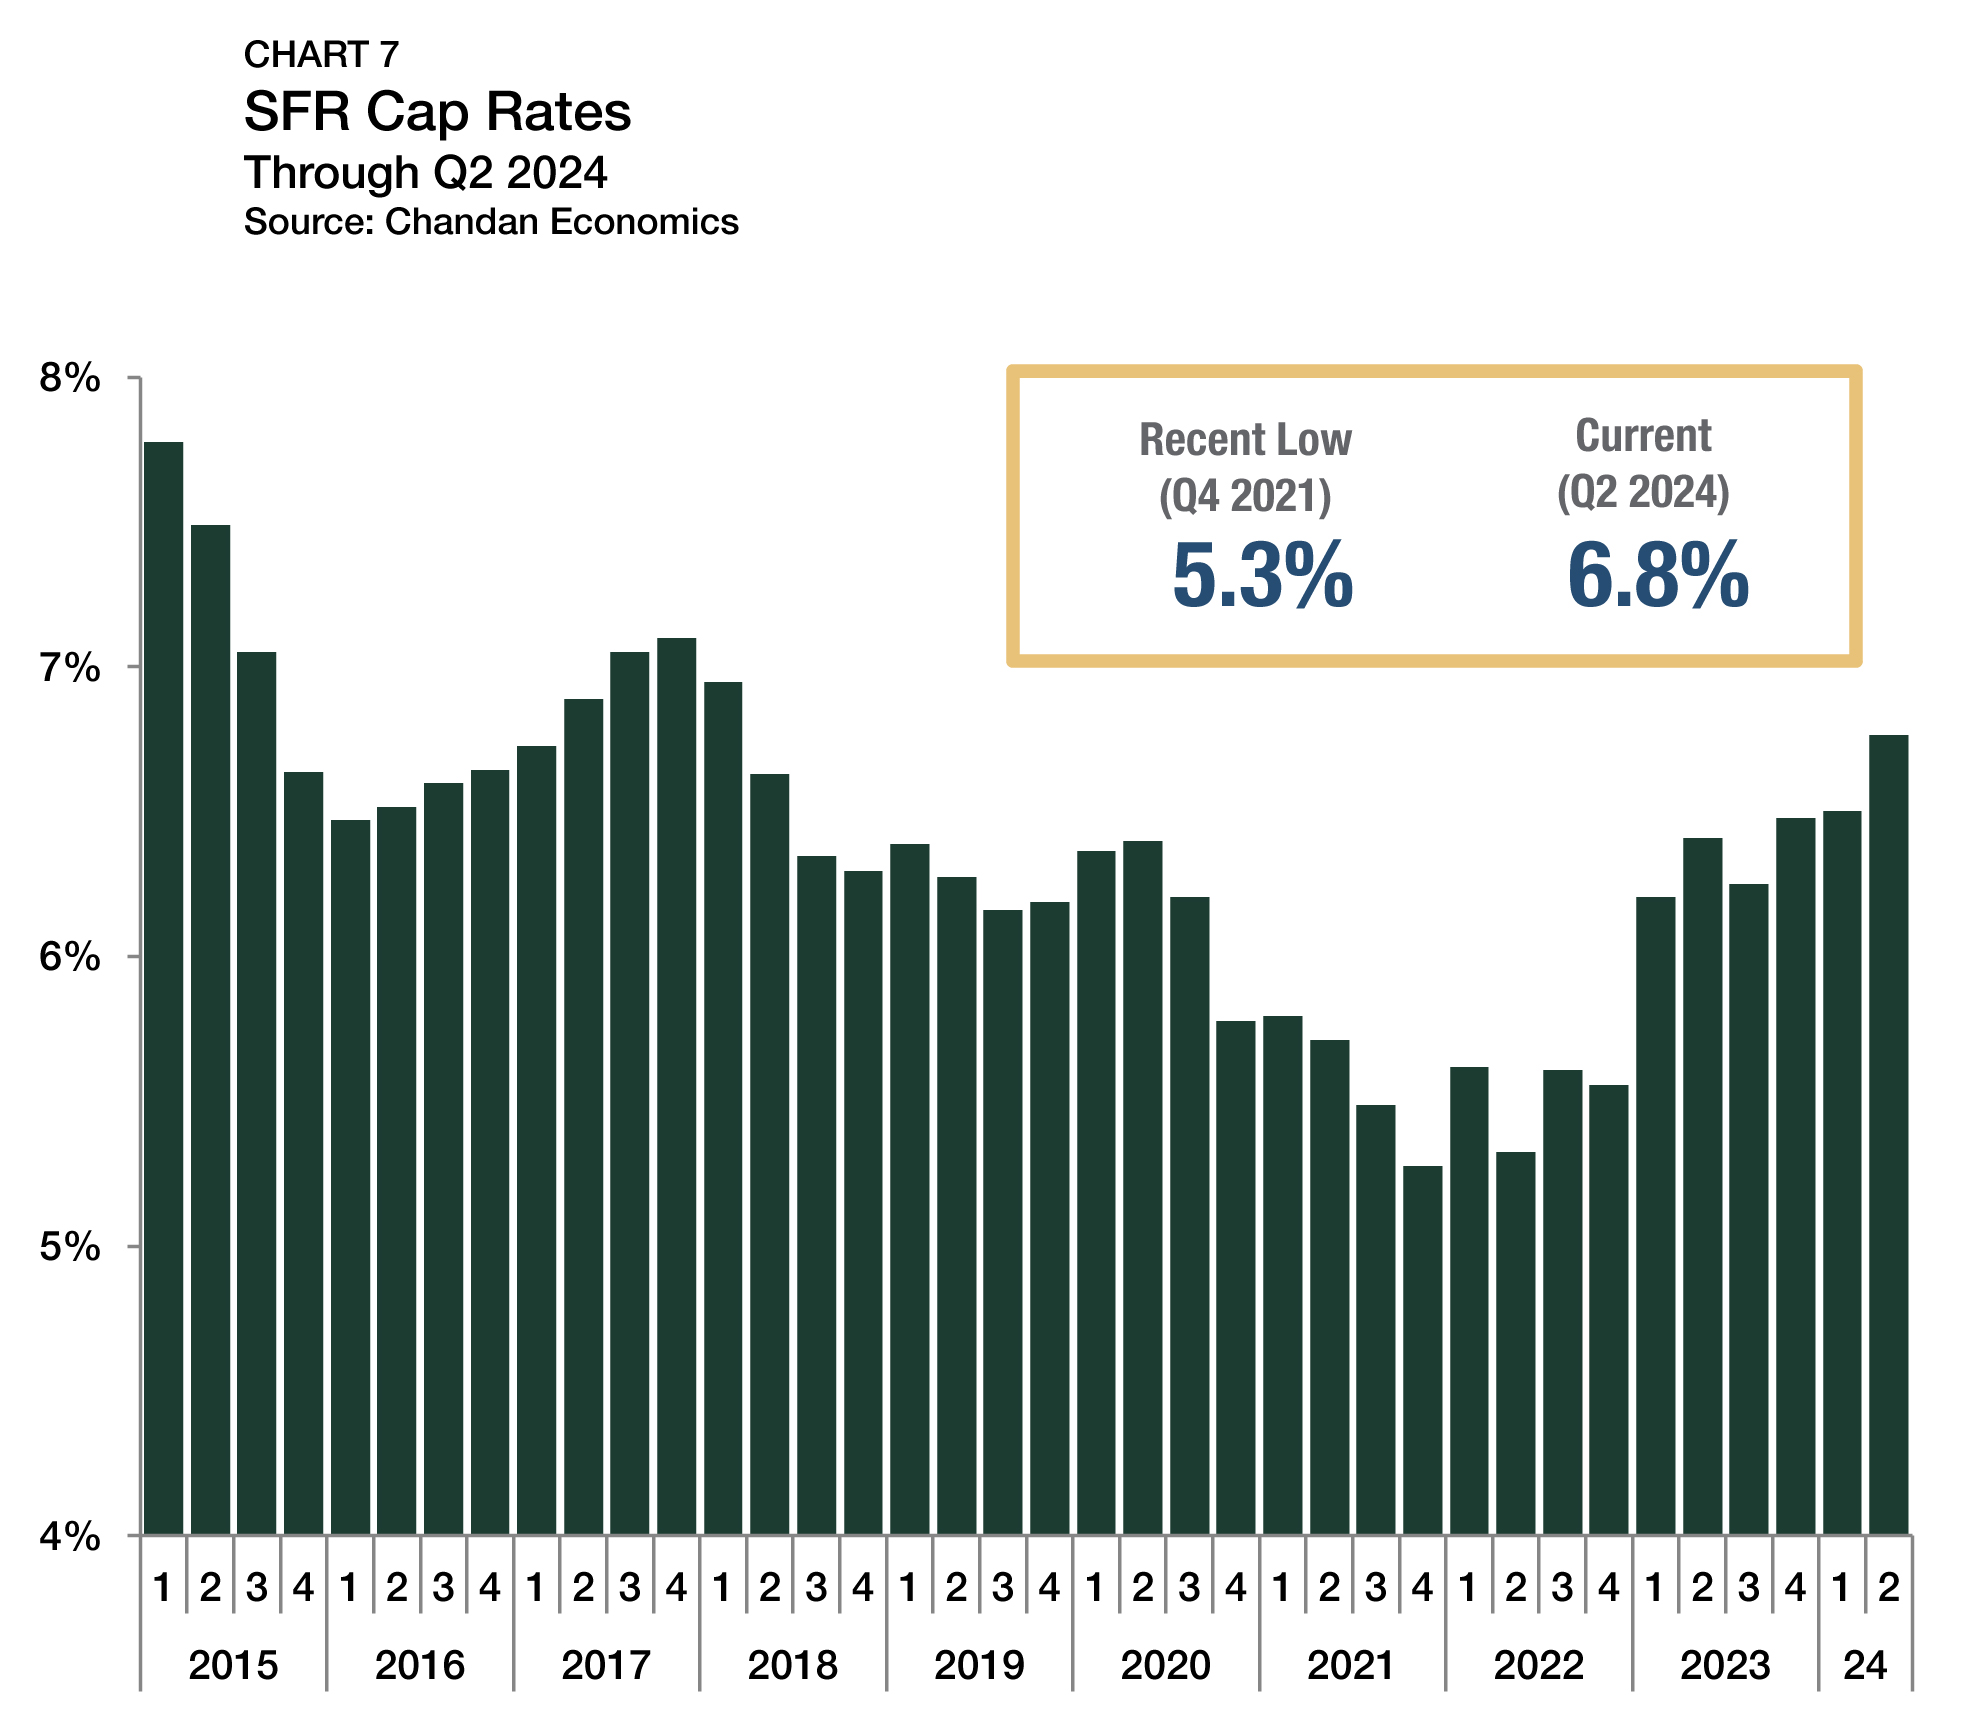
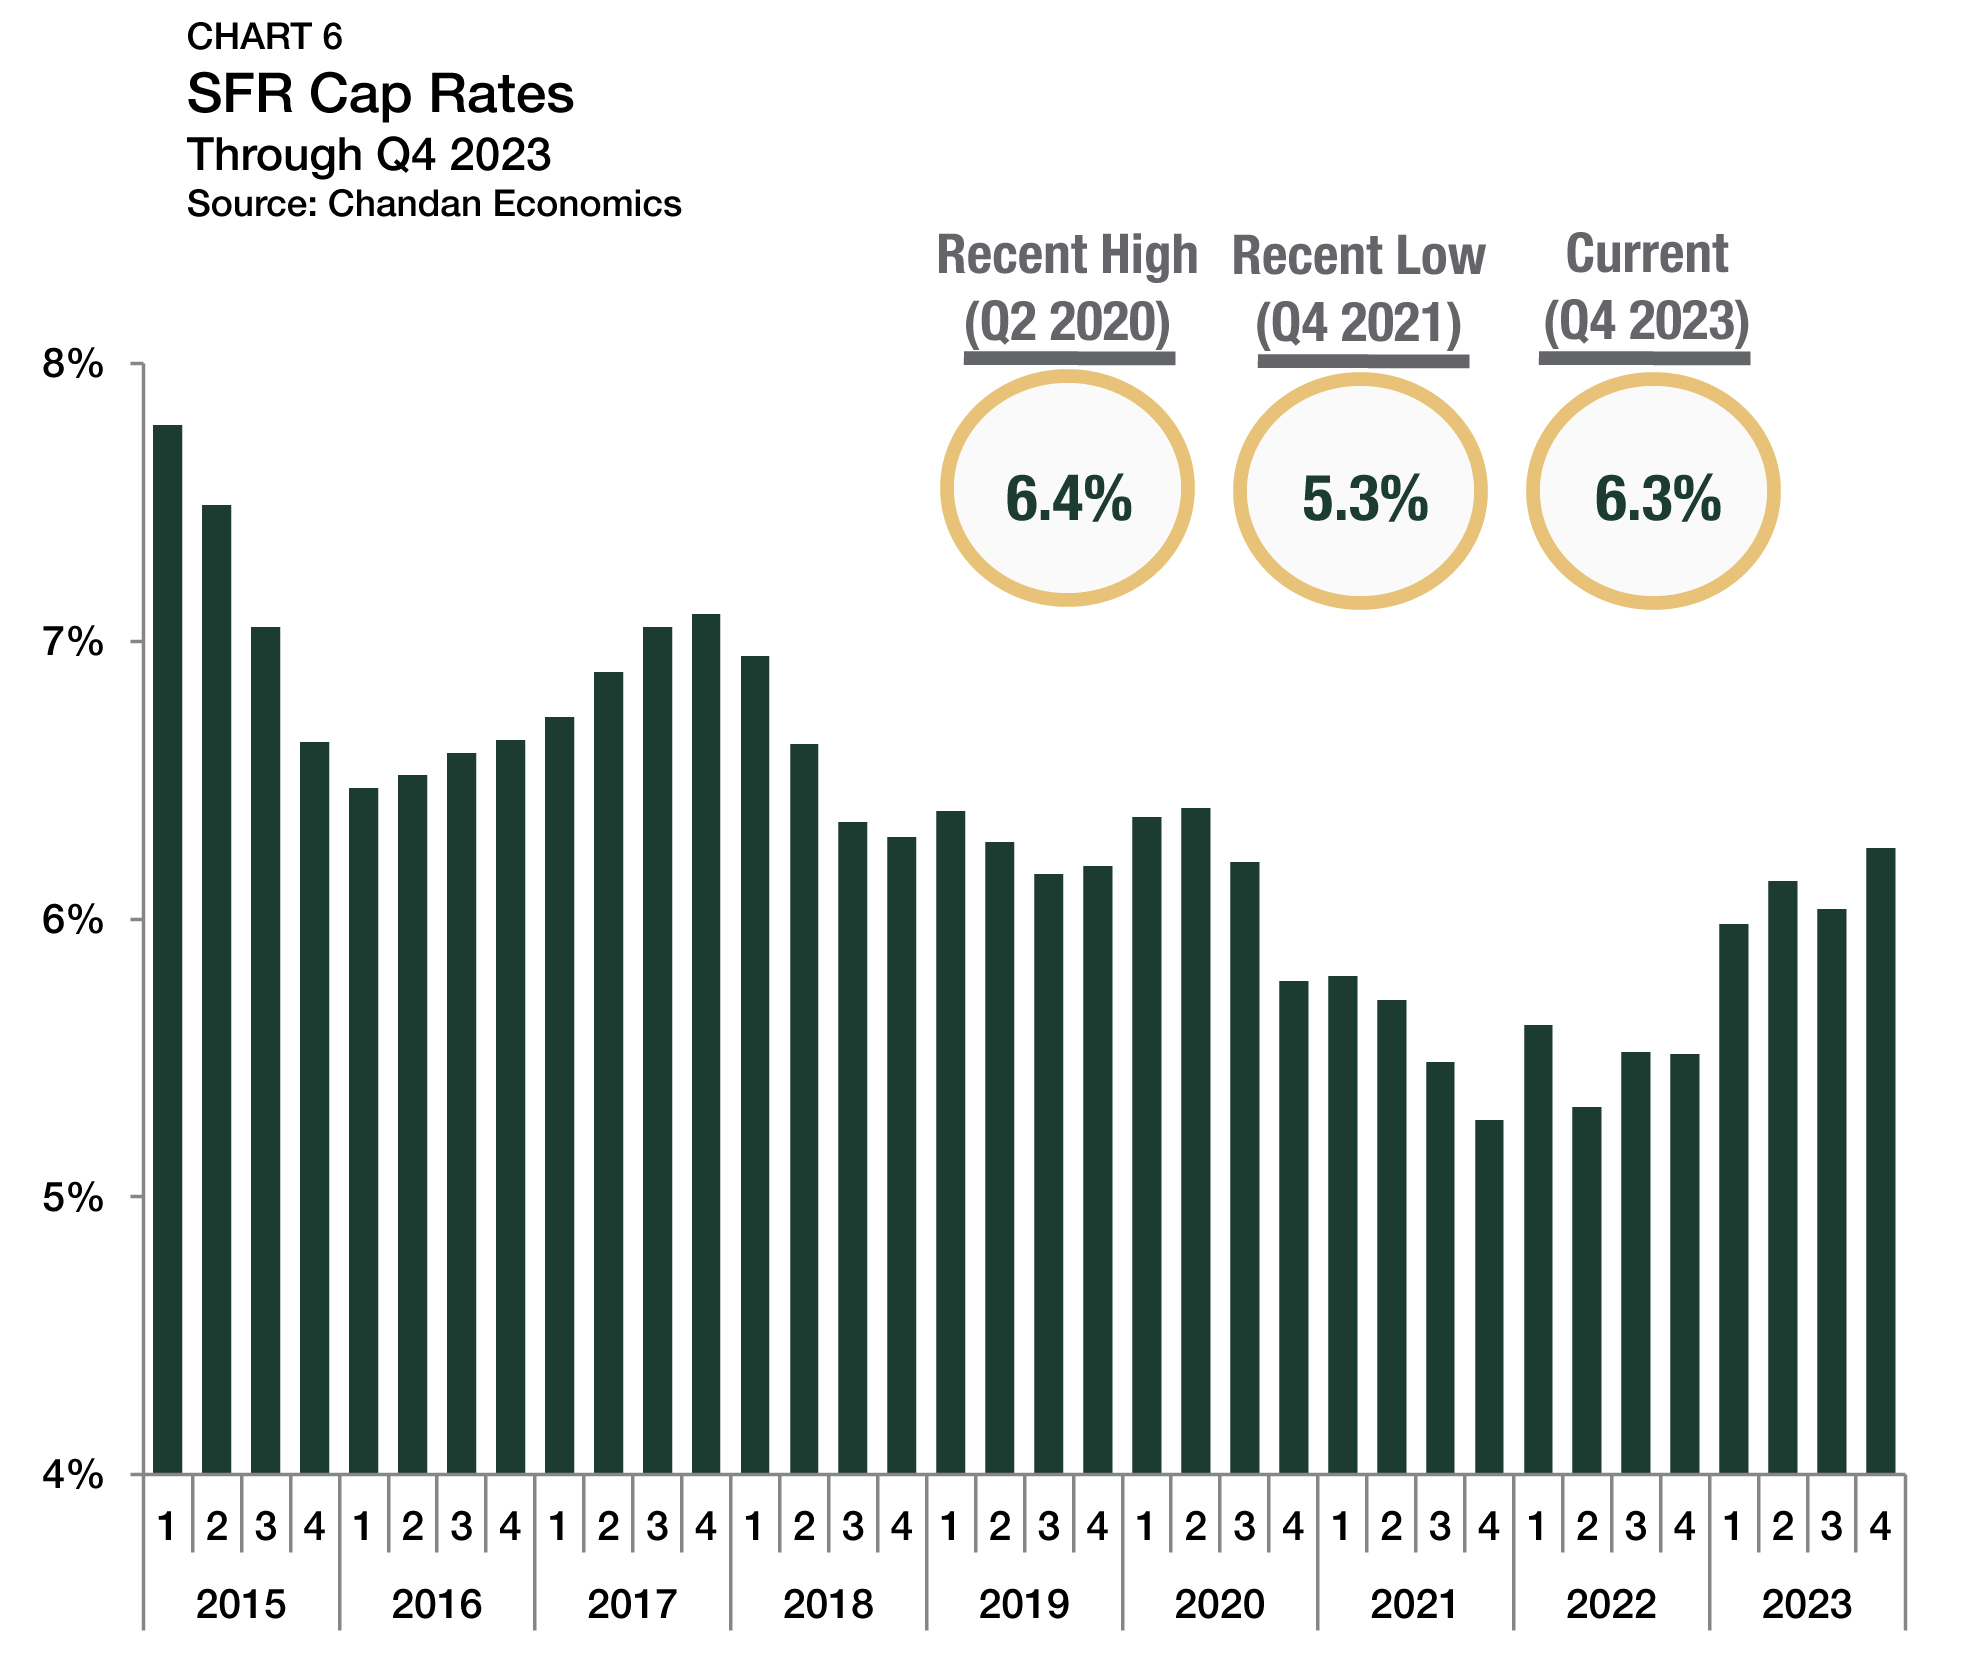
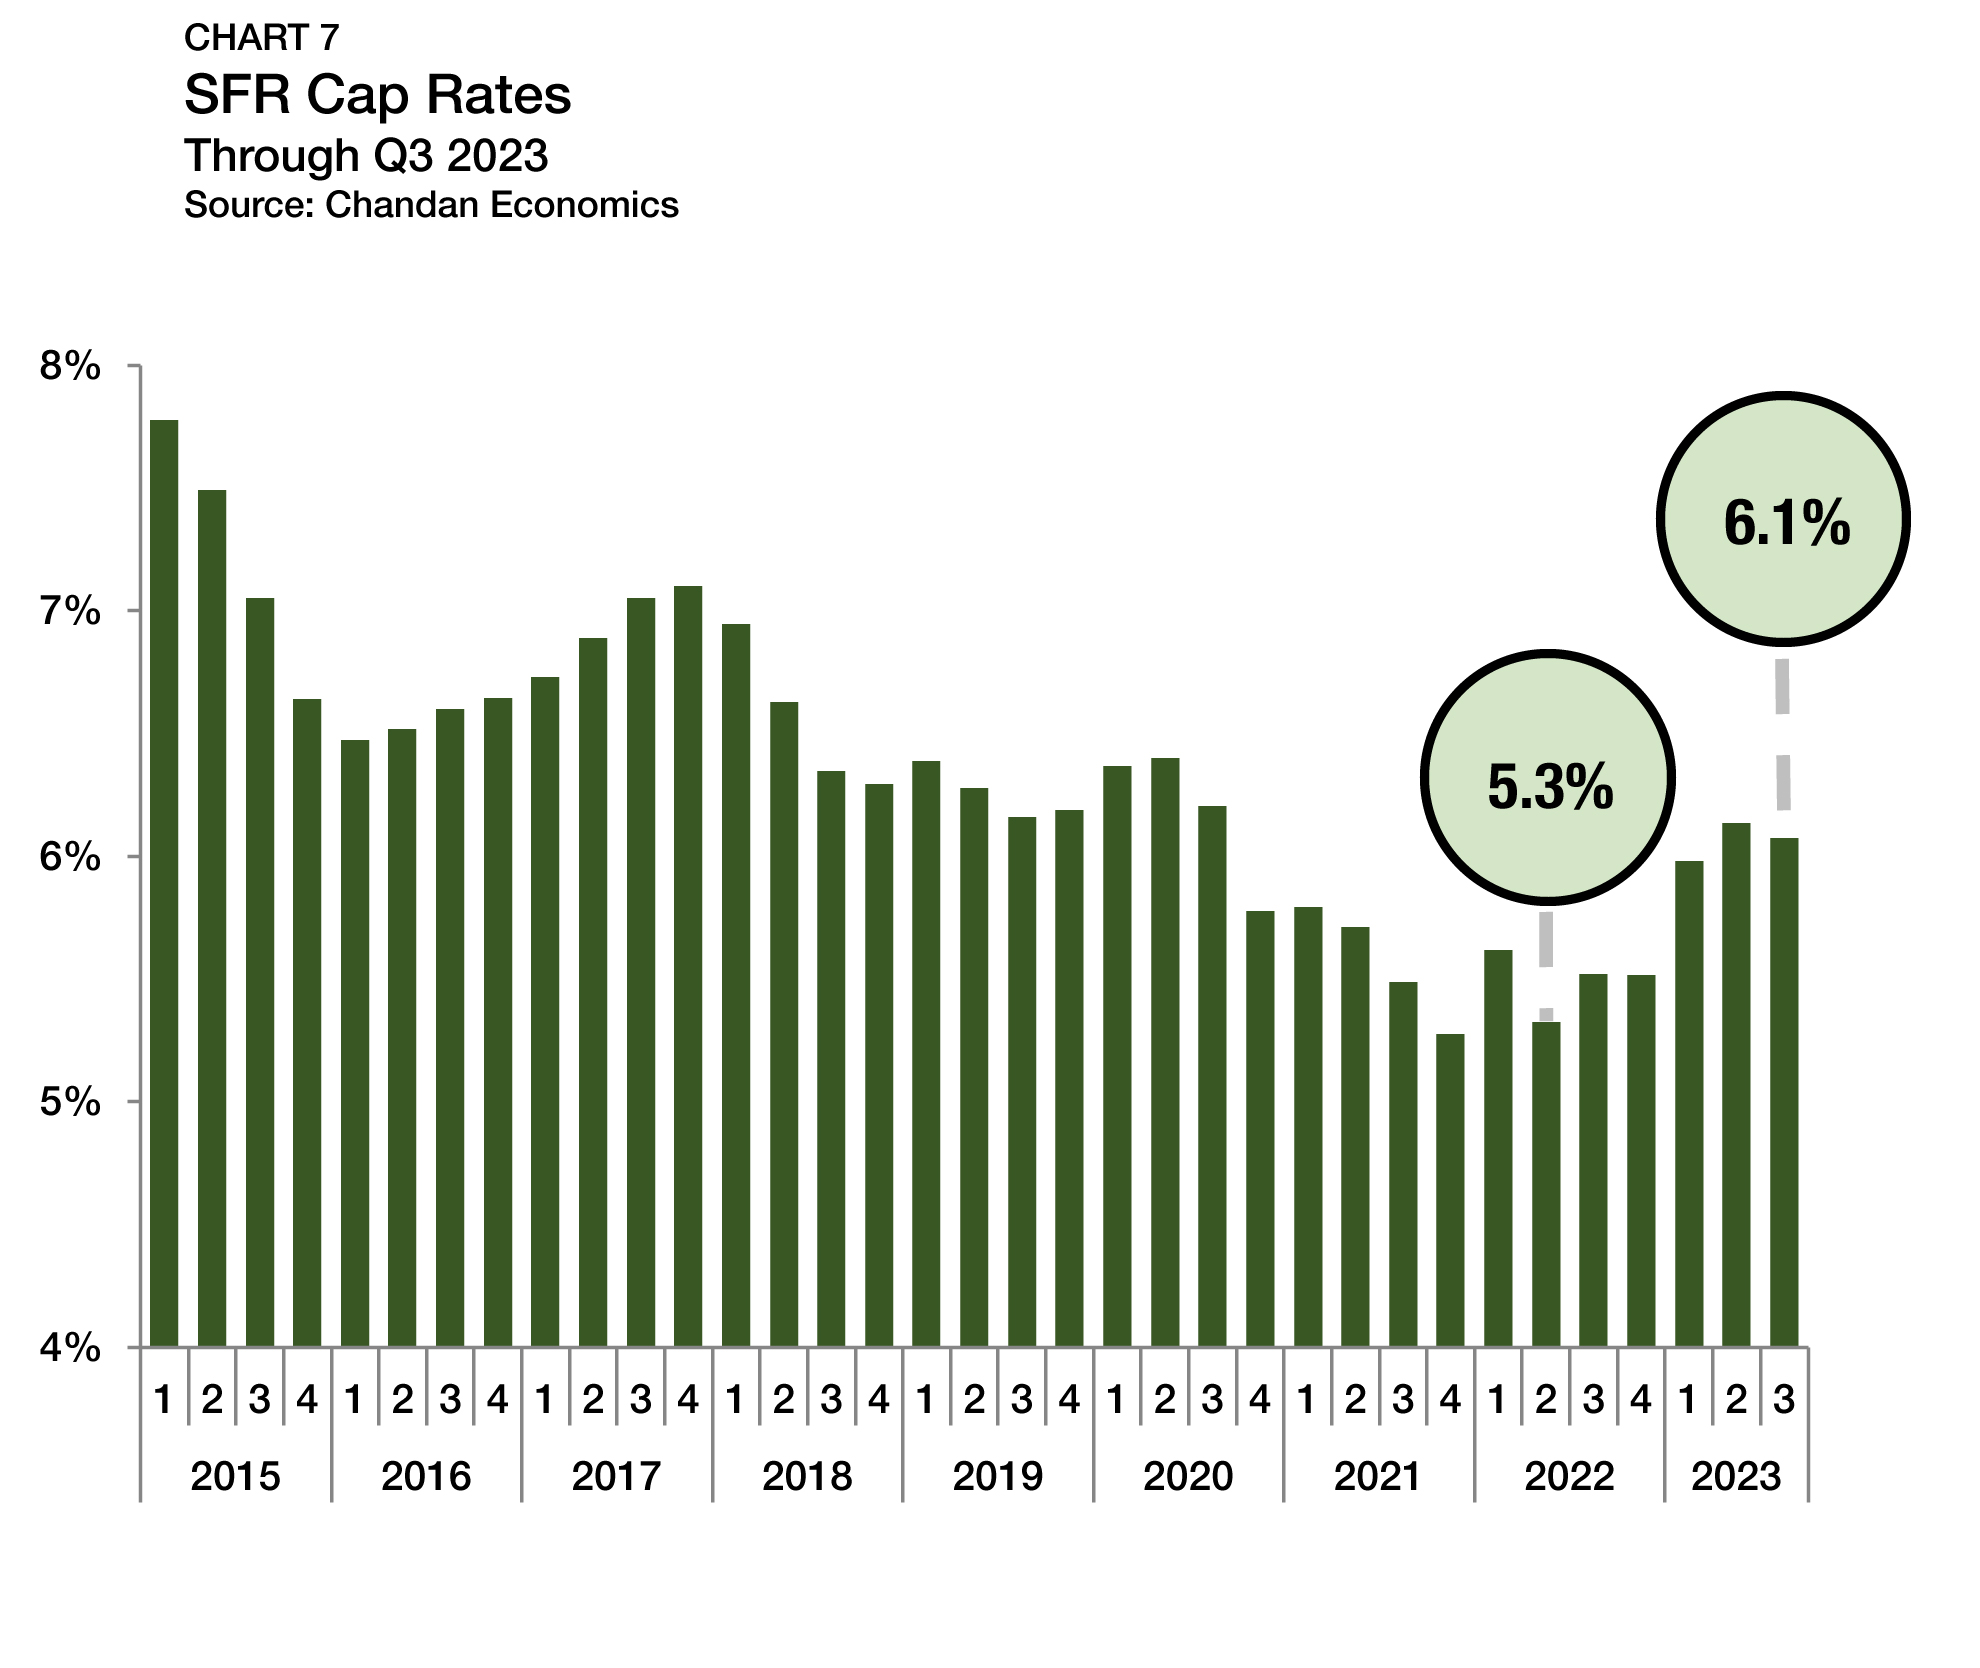
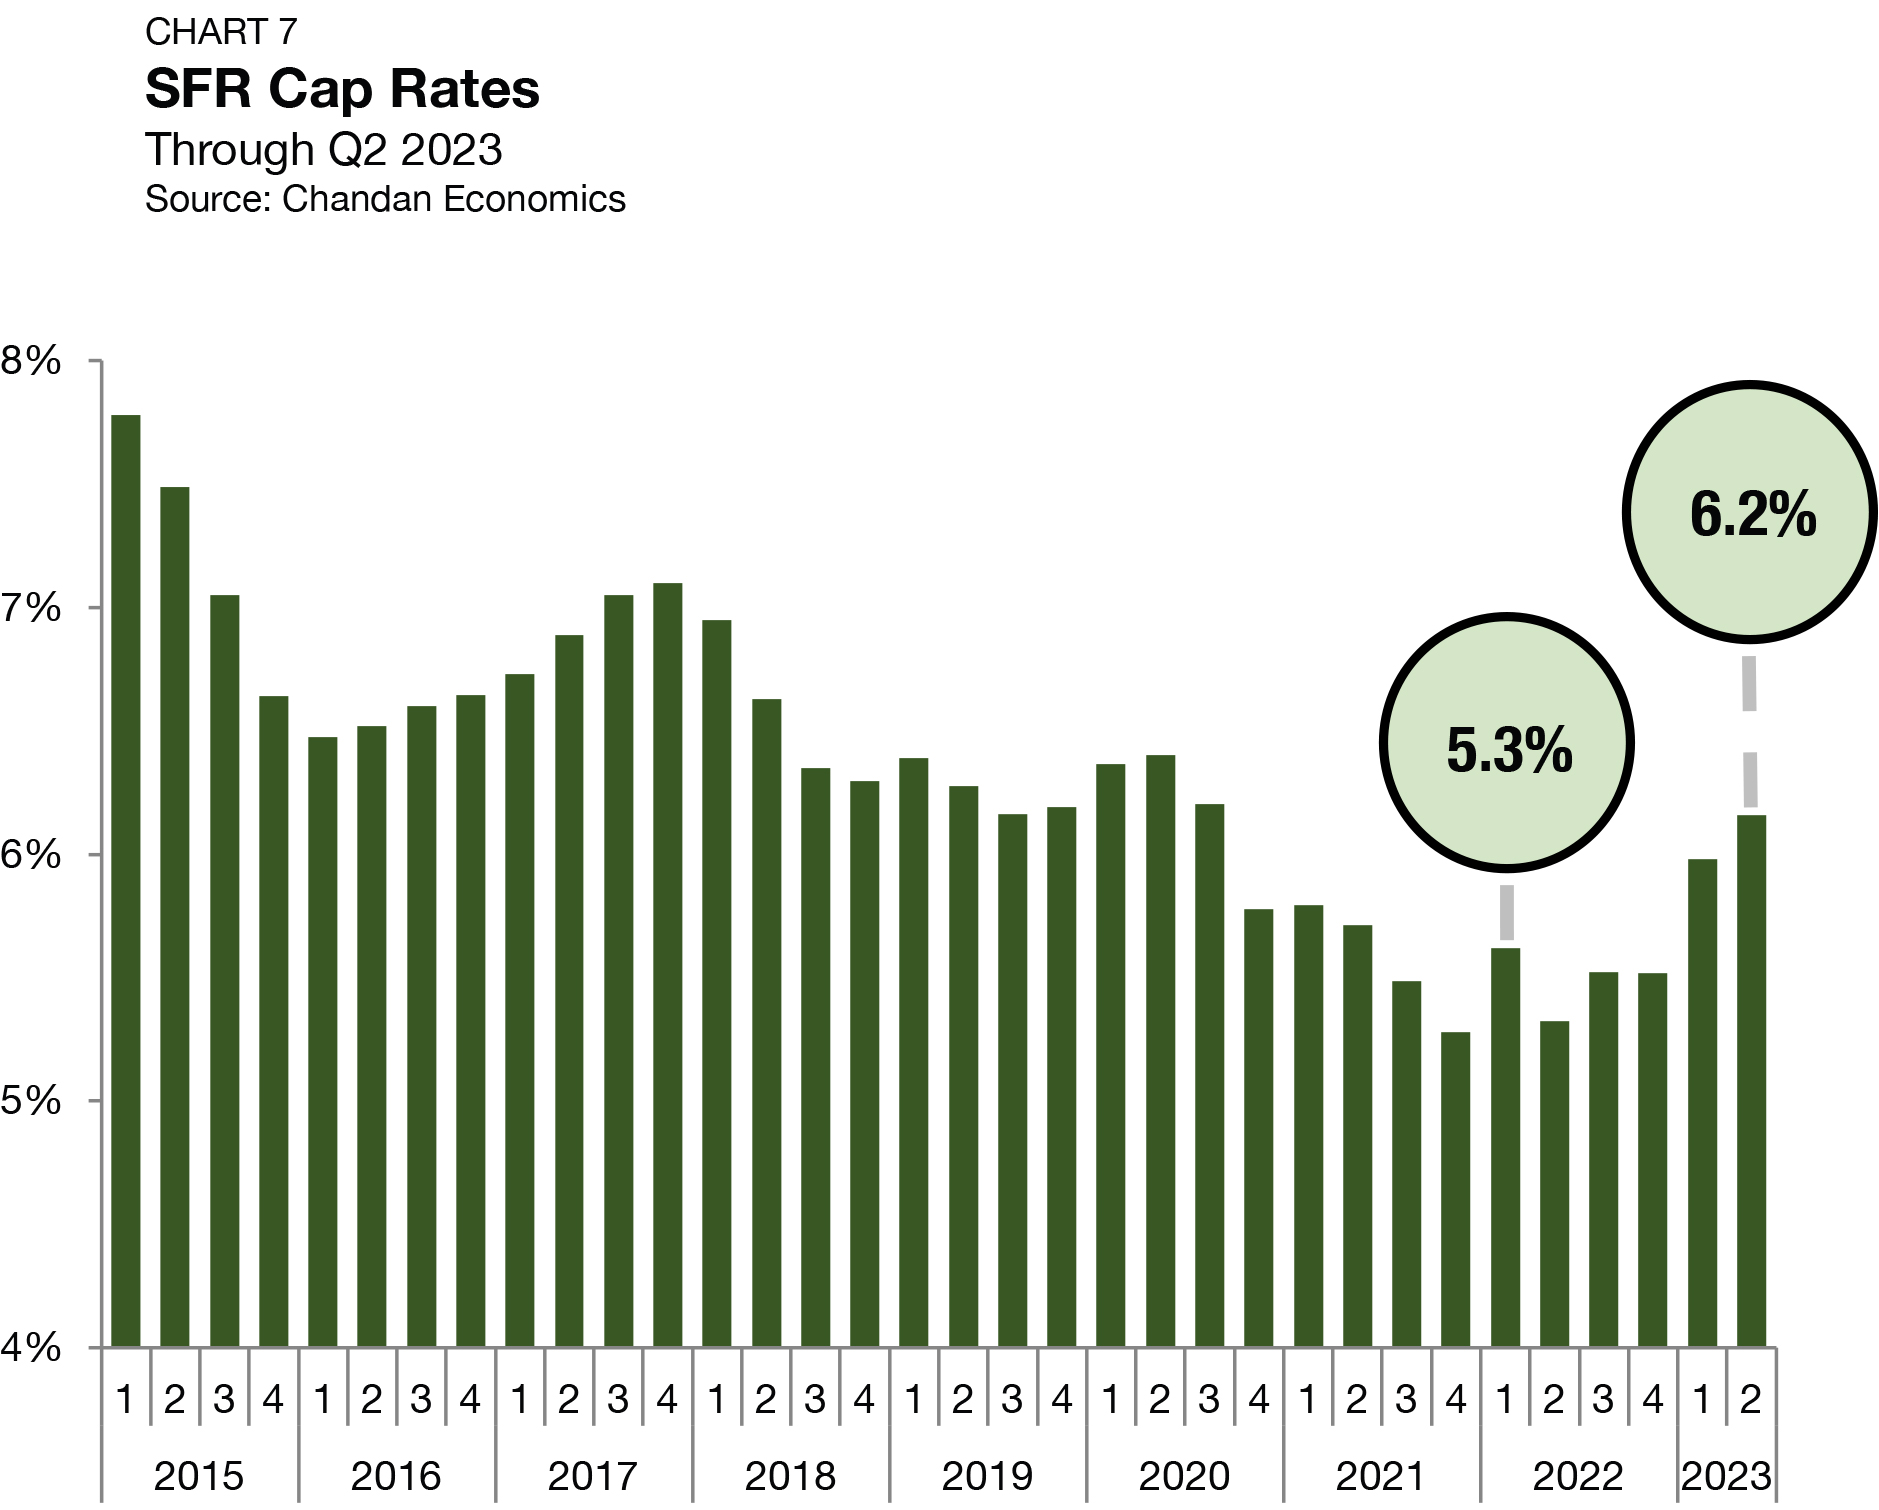
SFR cap rates fell slightly in the third quarter of 2024 to 6.7% (Chart 6).1 While the drop-off was negligible, the third quarter movement marked just the fourth time cap rates have fallen in the past 11 quarters. Nevertheless, cap rates in the sector remain close to post-pandemic highs. After cap rates reached a record low of 5.3% near the end of 2021, they have since risen by a cumulative 140 bps.
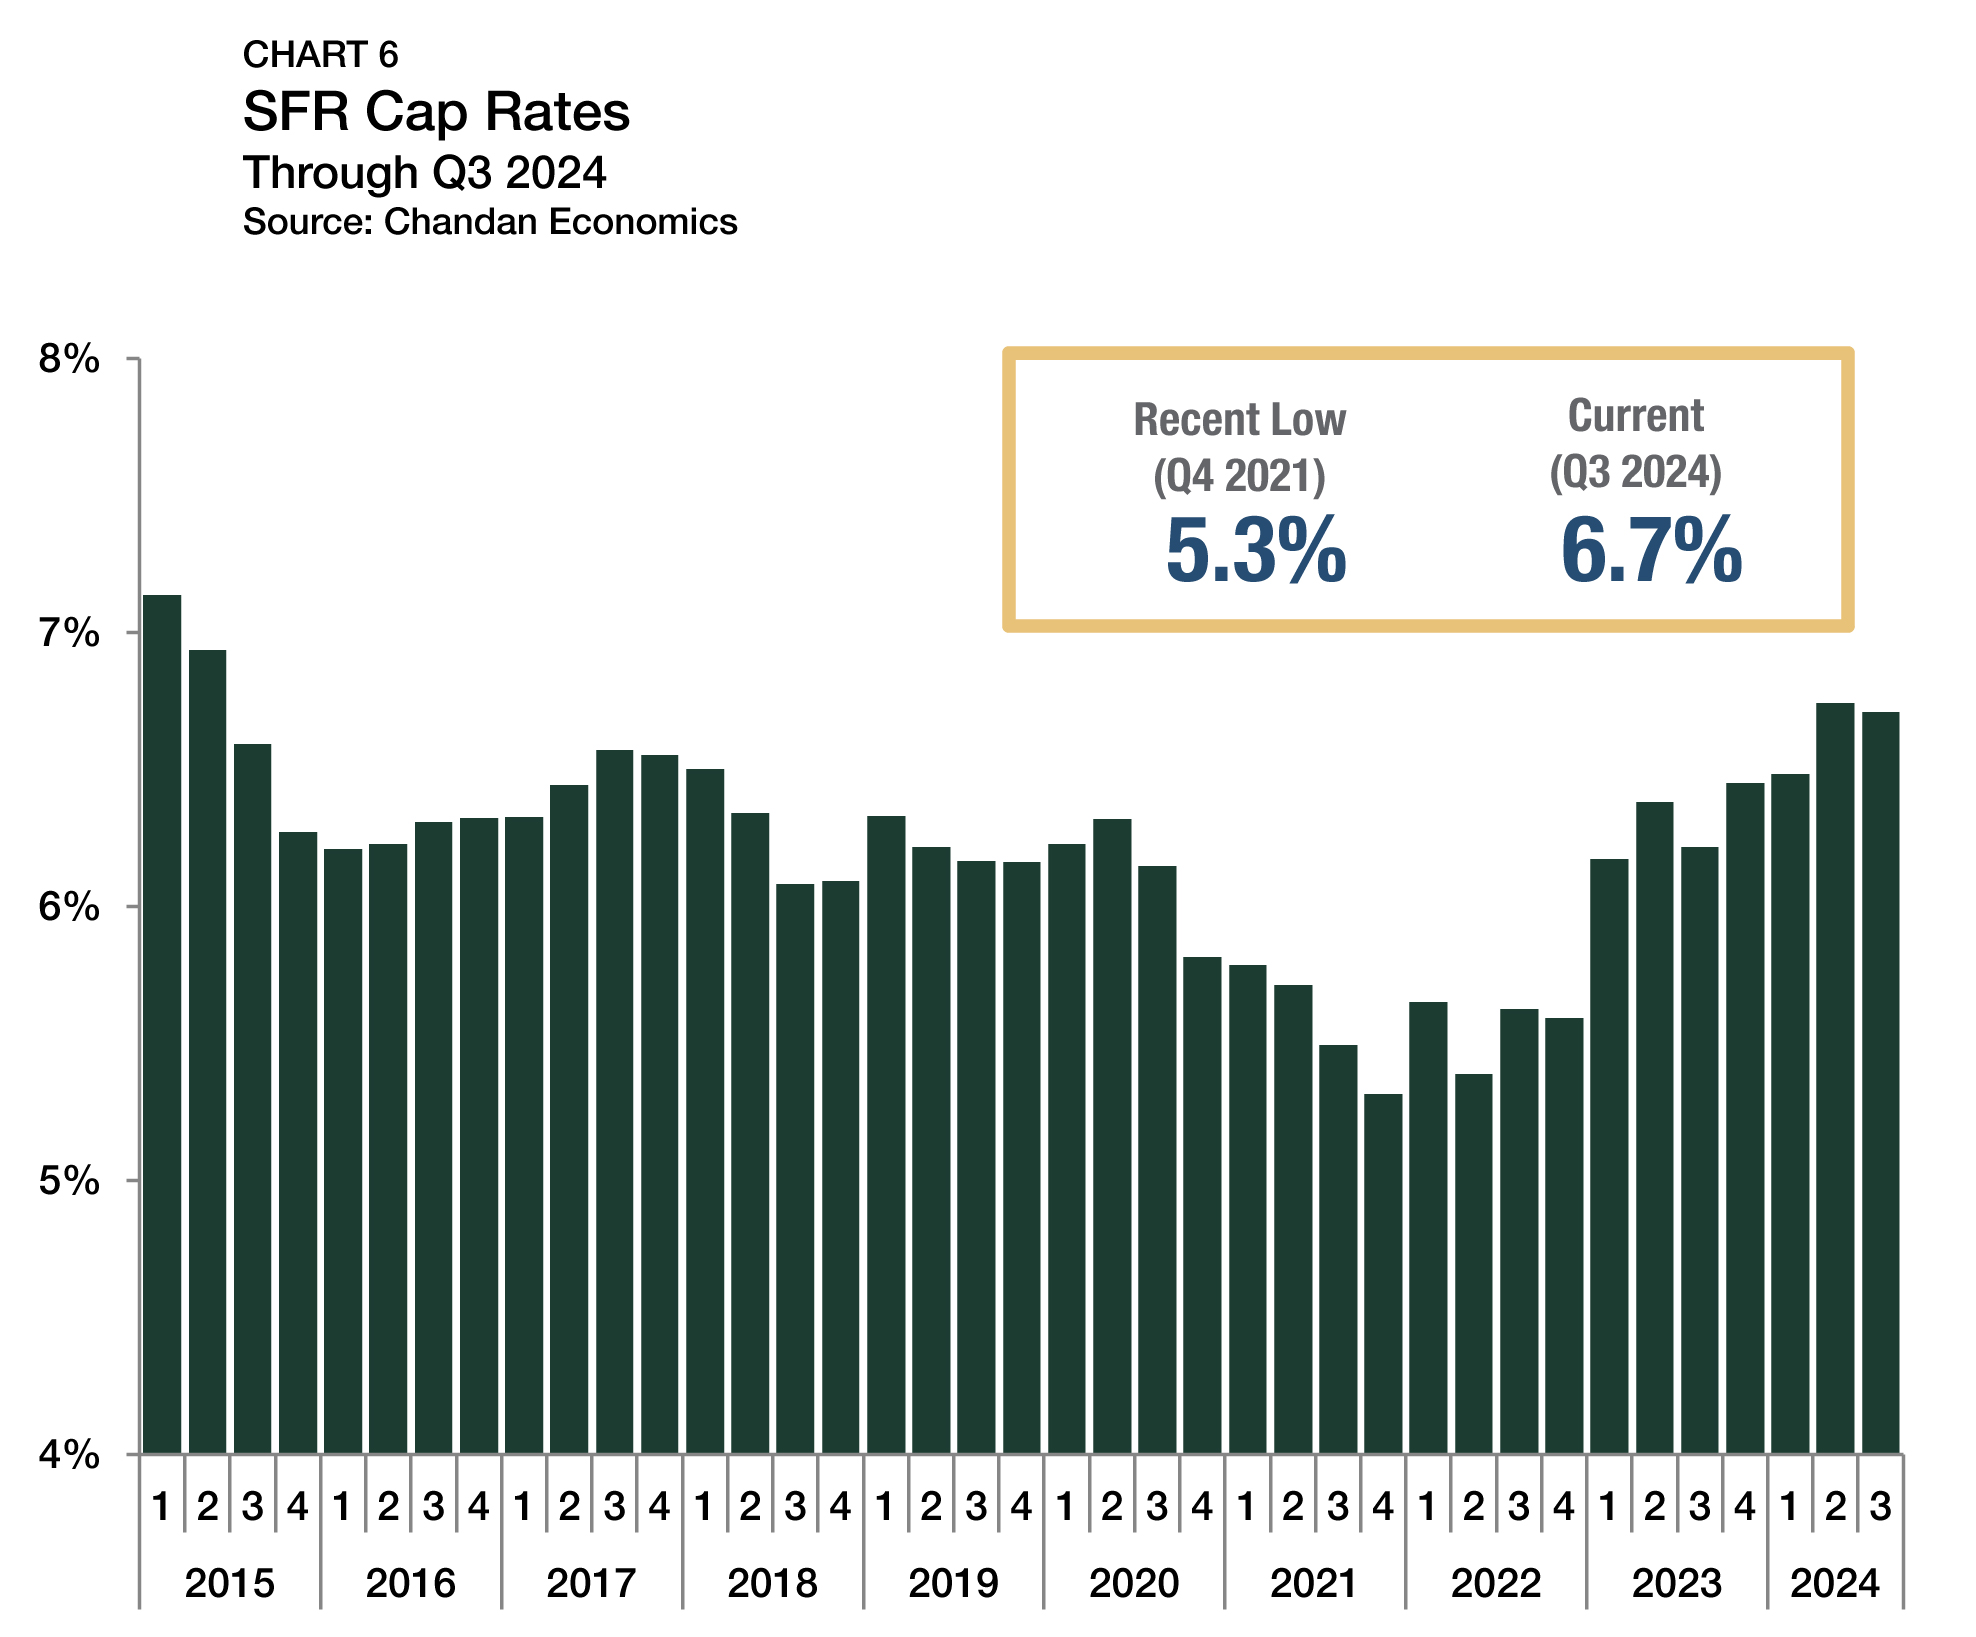
1 Unless otherwise noted, the Chandan Economics data covering single-family rental cap rates and debt yields are based on model estimates and a sample pool of loans. Data are meant to represent conditions at the point of origination.
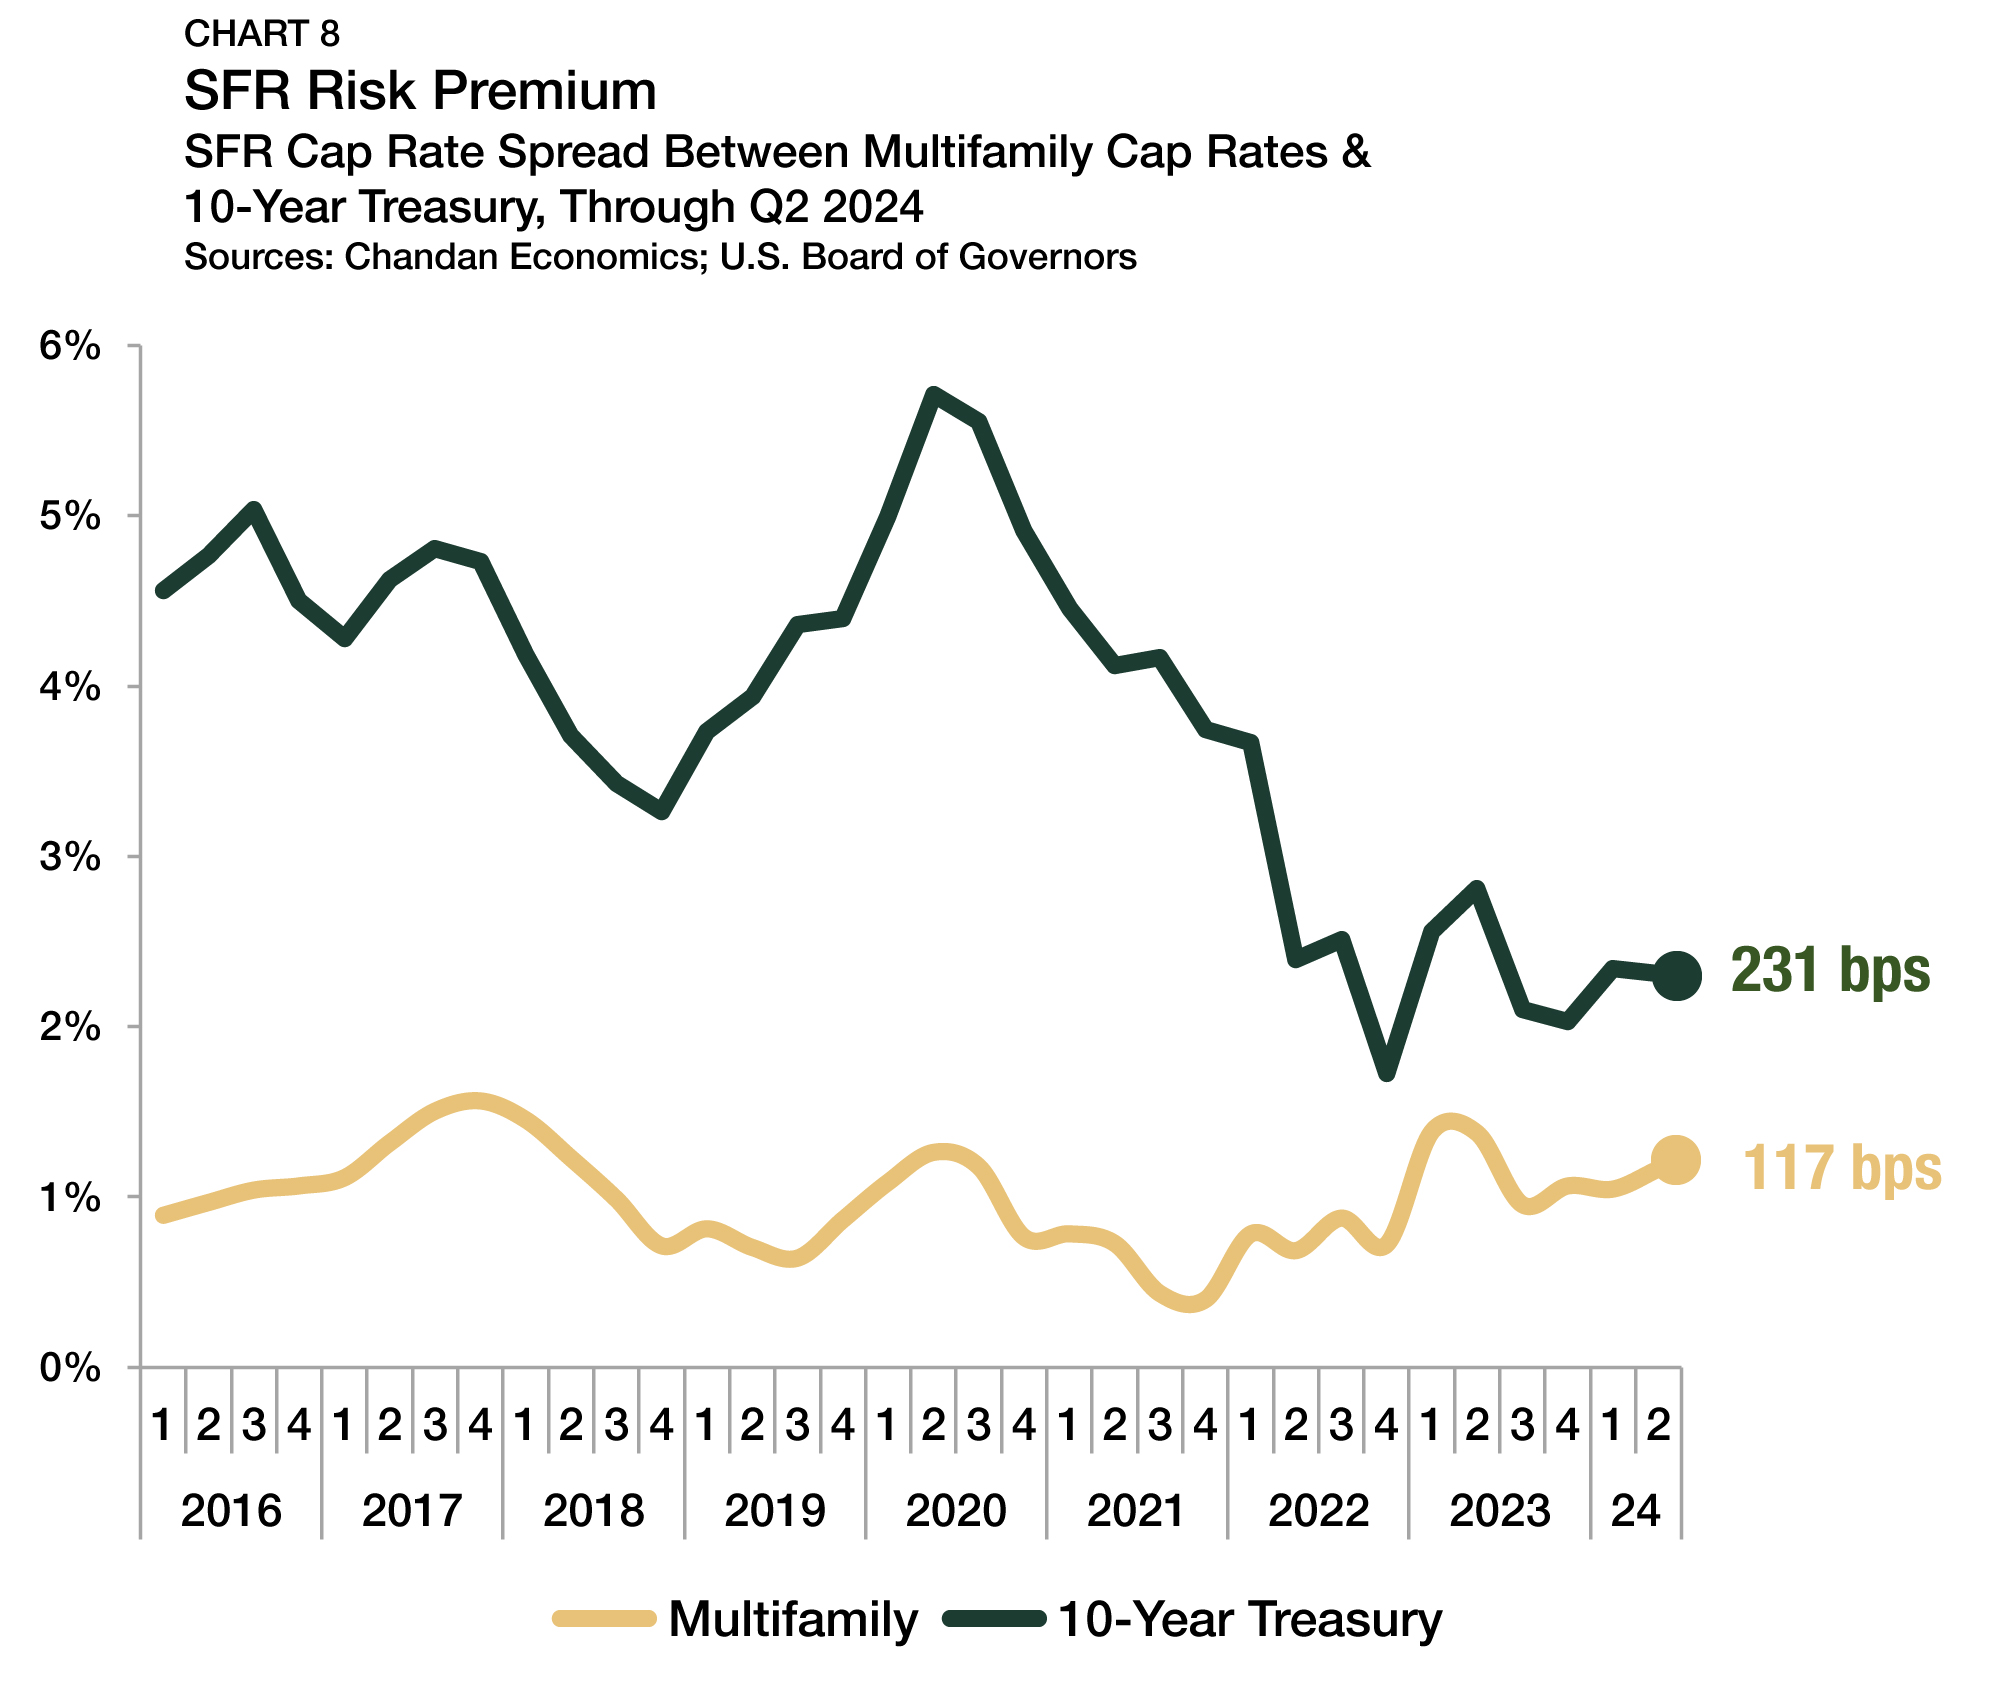
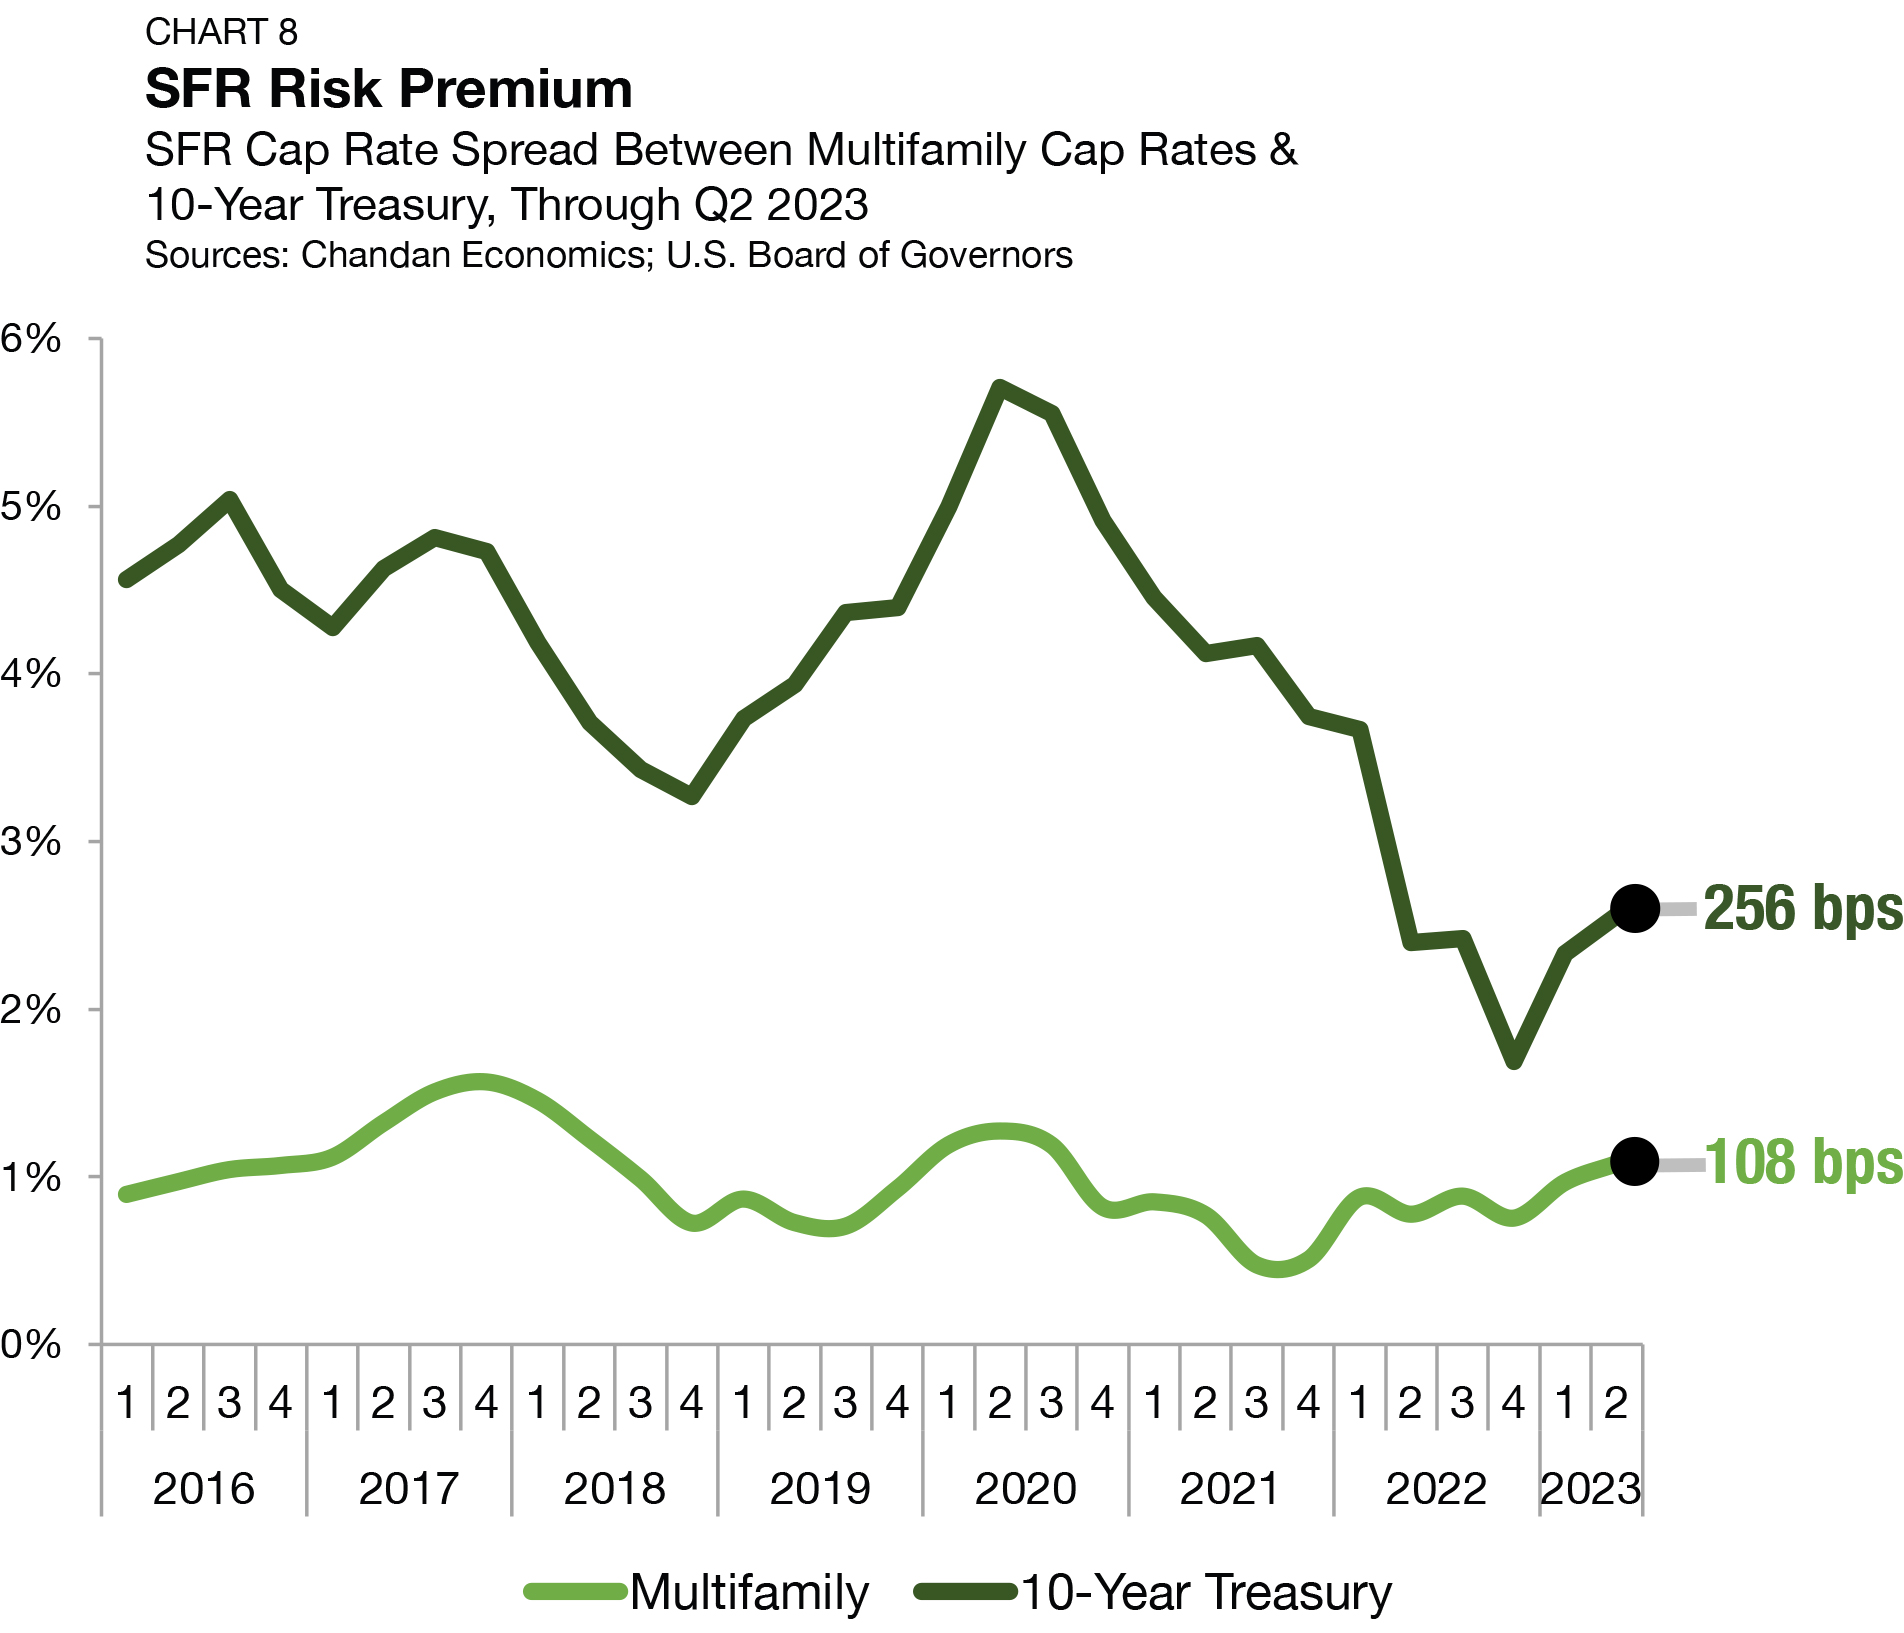
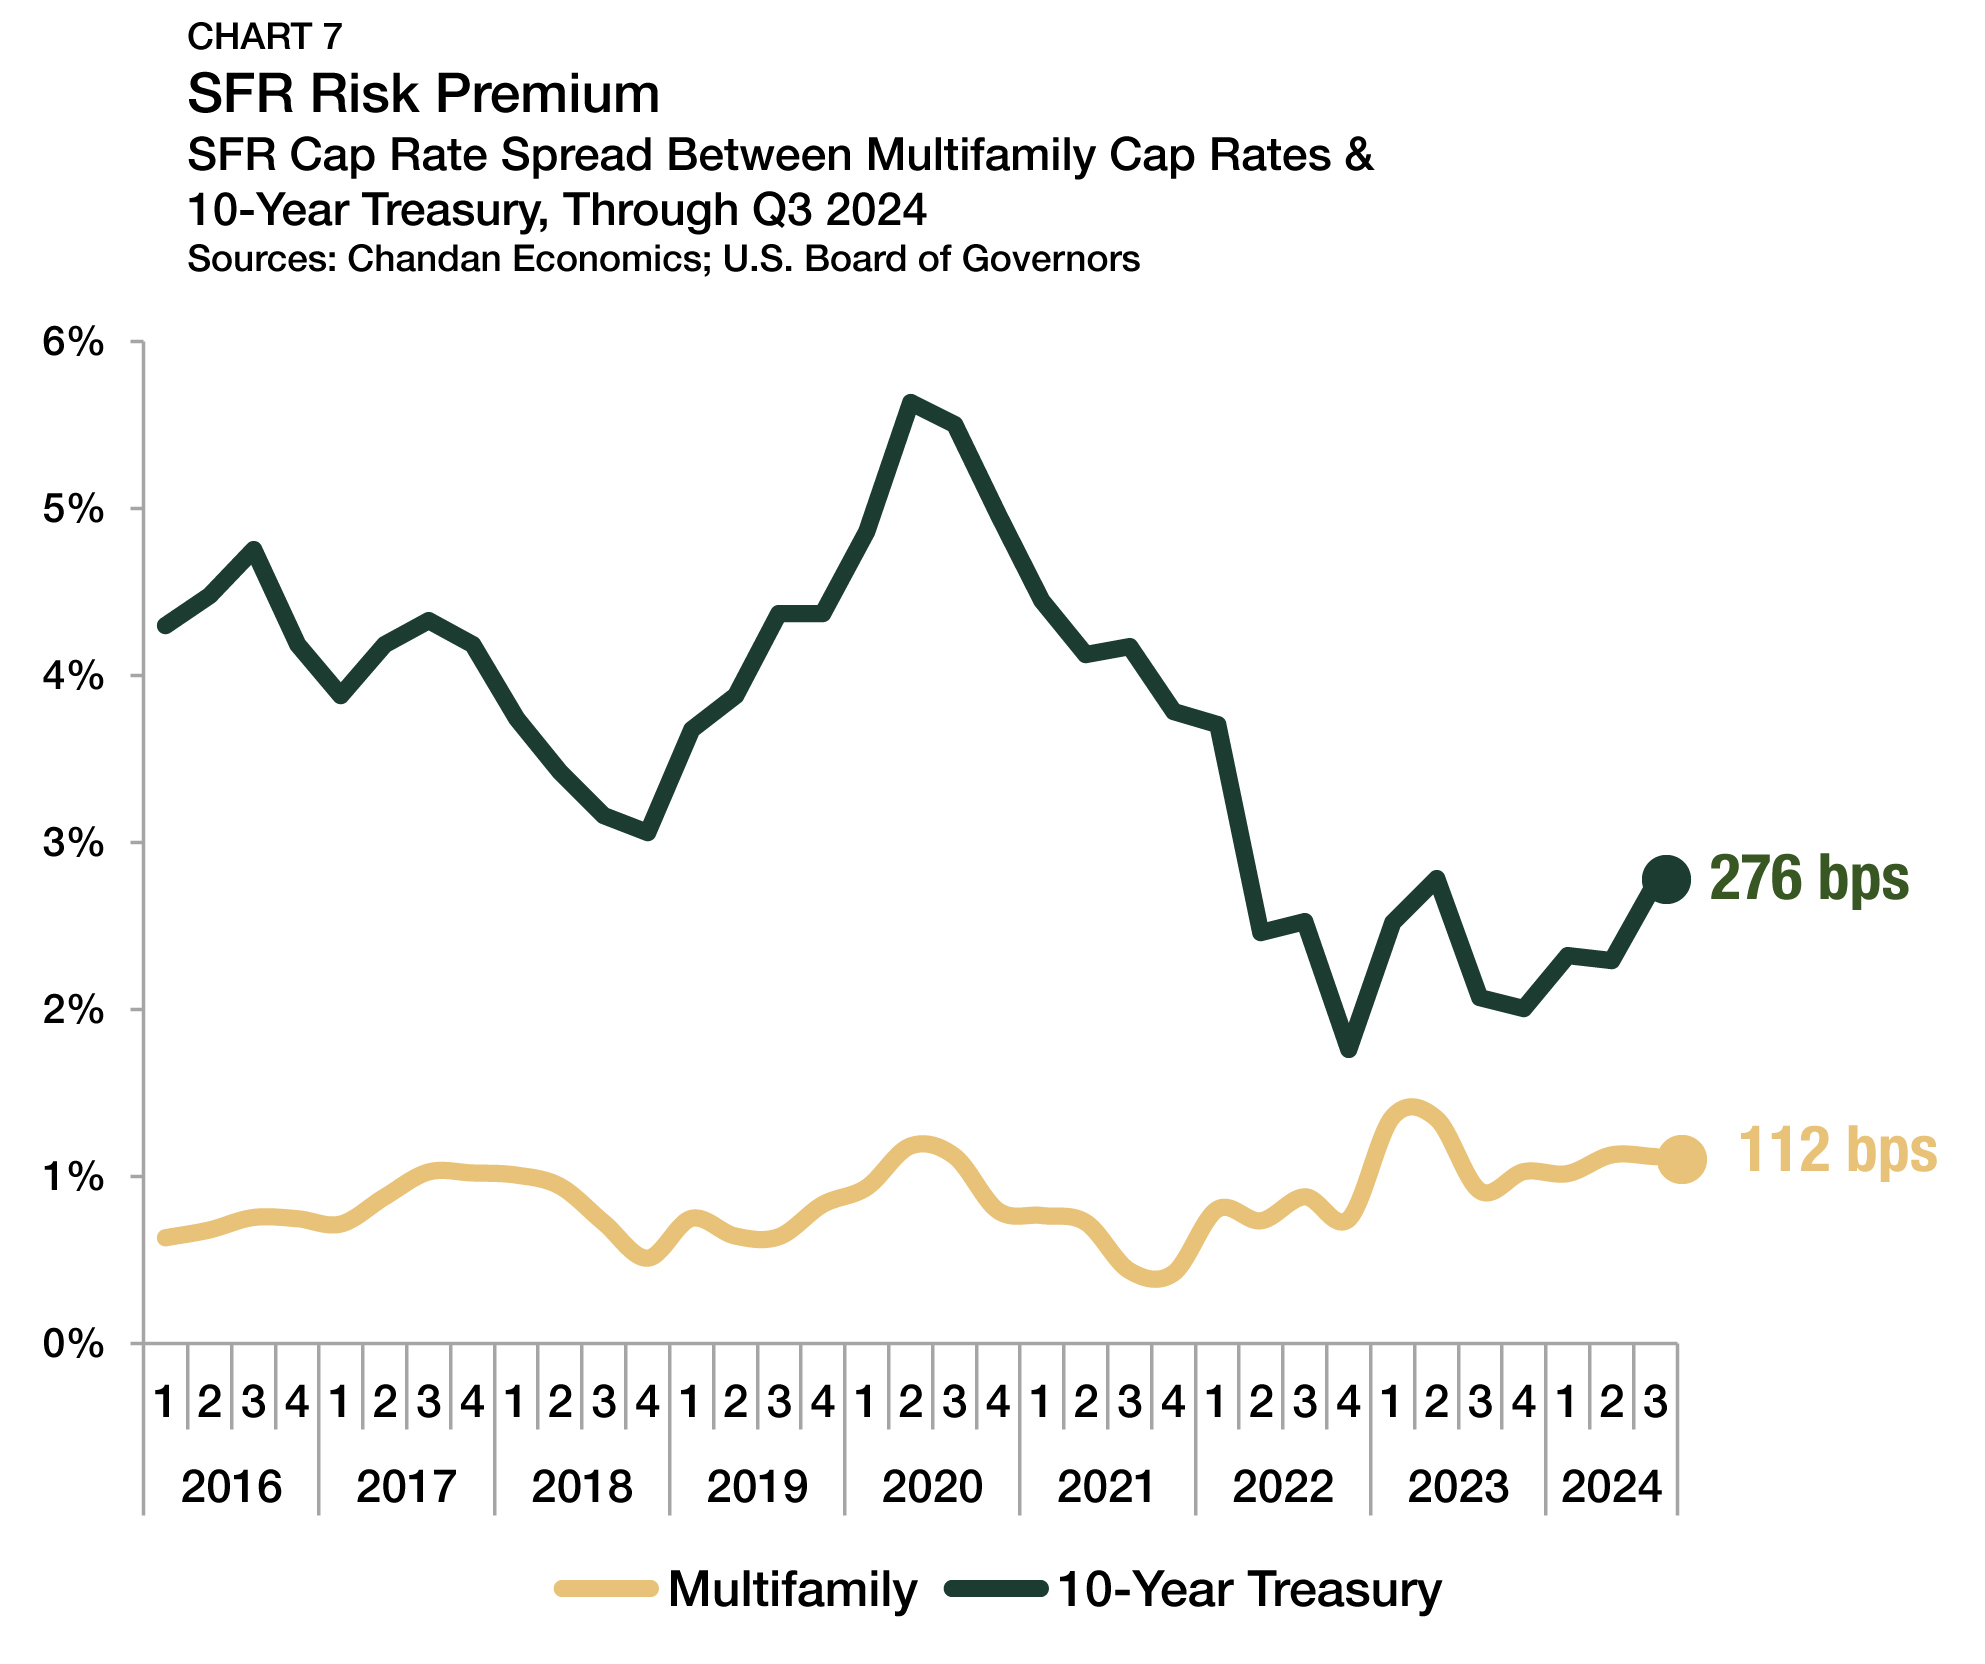
The spread between SFR cap rates and 10-year Treasury yields approximates the SFR risk premium. In the third quarter of 2024, 10-year Treasury notes carried an average yield of 4.0%, falling from 4.5% in the second quarter. With average Treasury yields falling by significantly more than SFR cap rates were rising, the SFR/Treasury risk premium jumped by 47 bps, settling at 276 bps in the third quarter (Chart 7). Meanwhile, the spread between SFR and multifamily properties remained virtually unchanged (-1 bps) from the previous quarter, averaging 112 bps.
Pricing
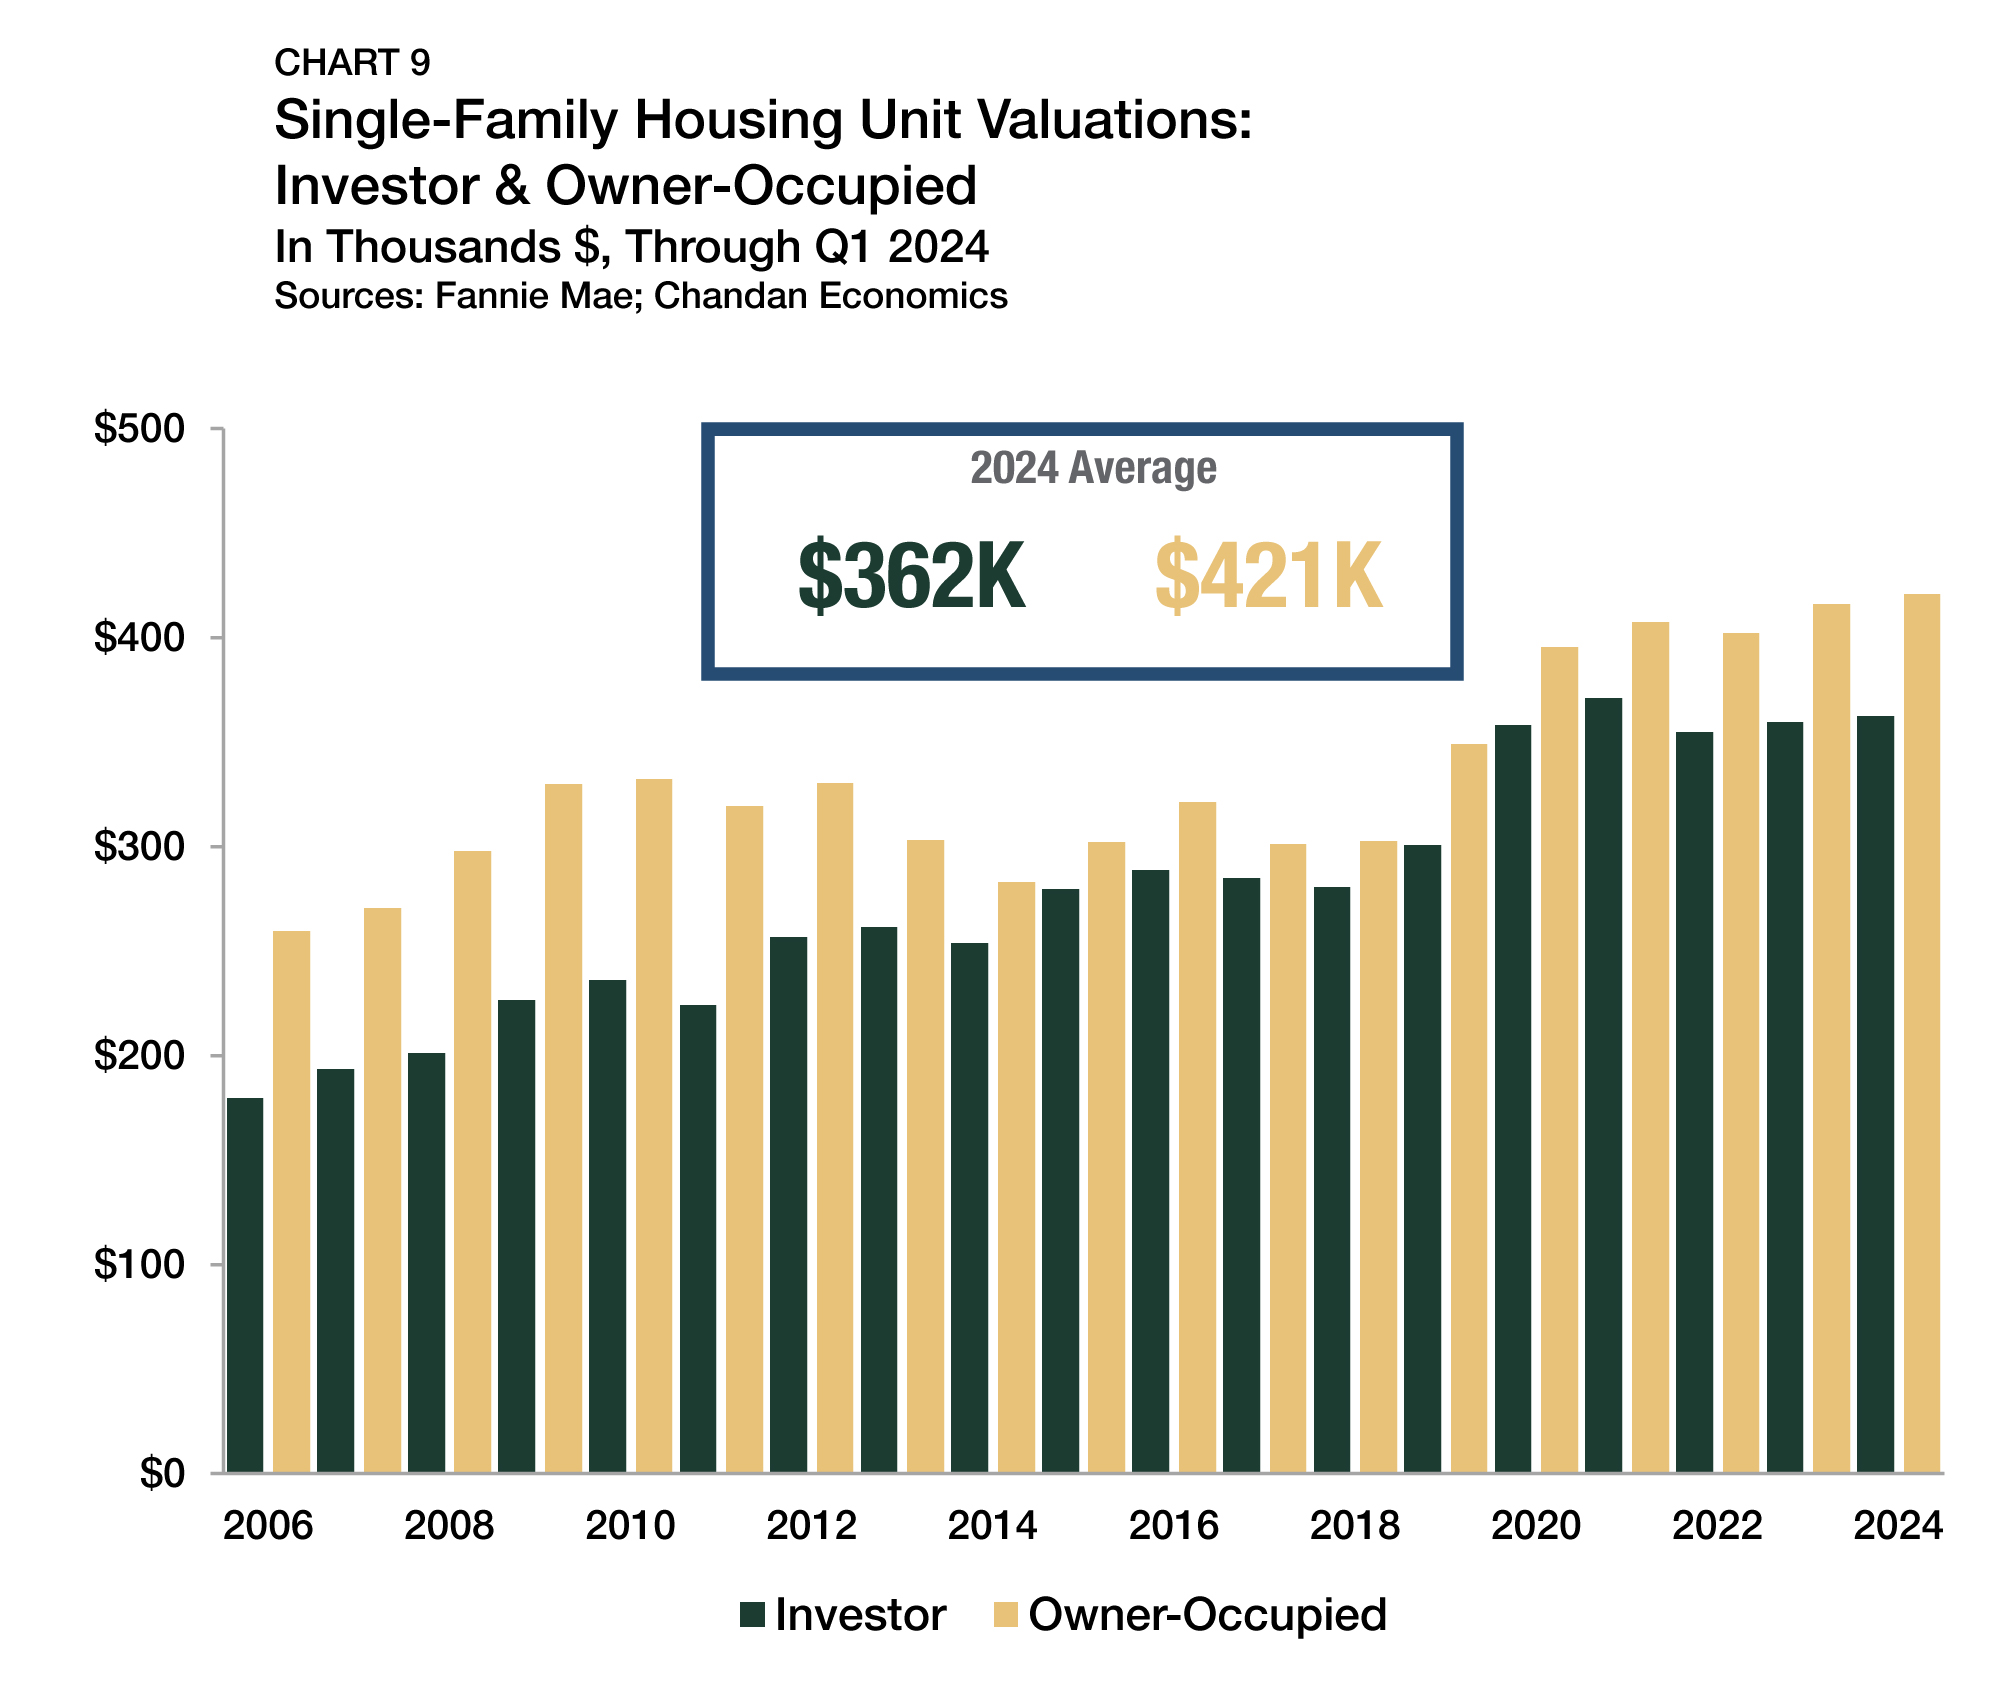
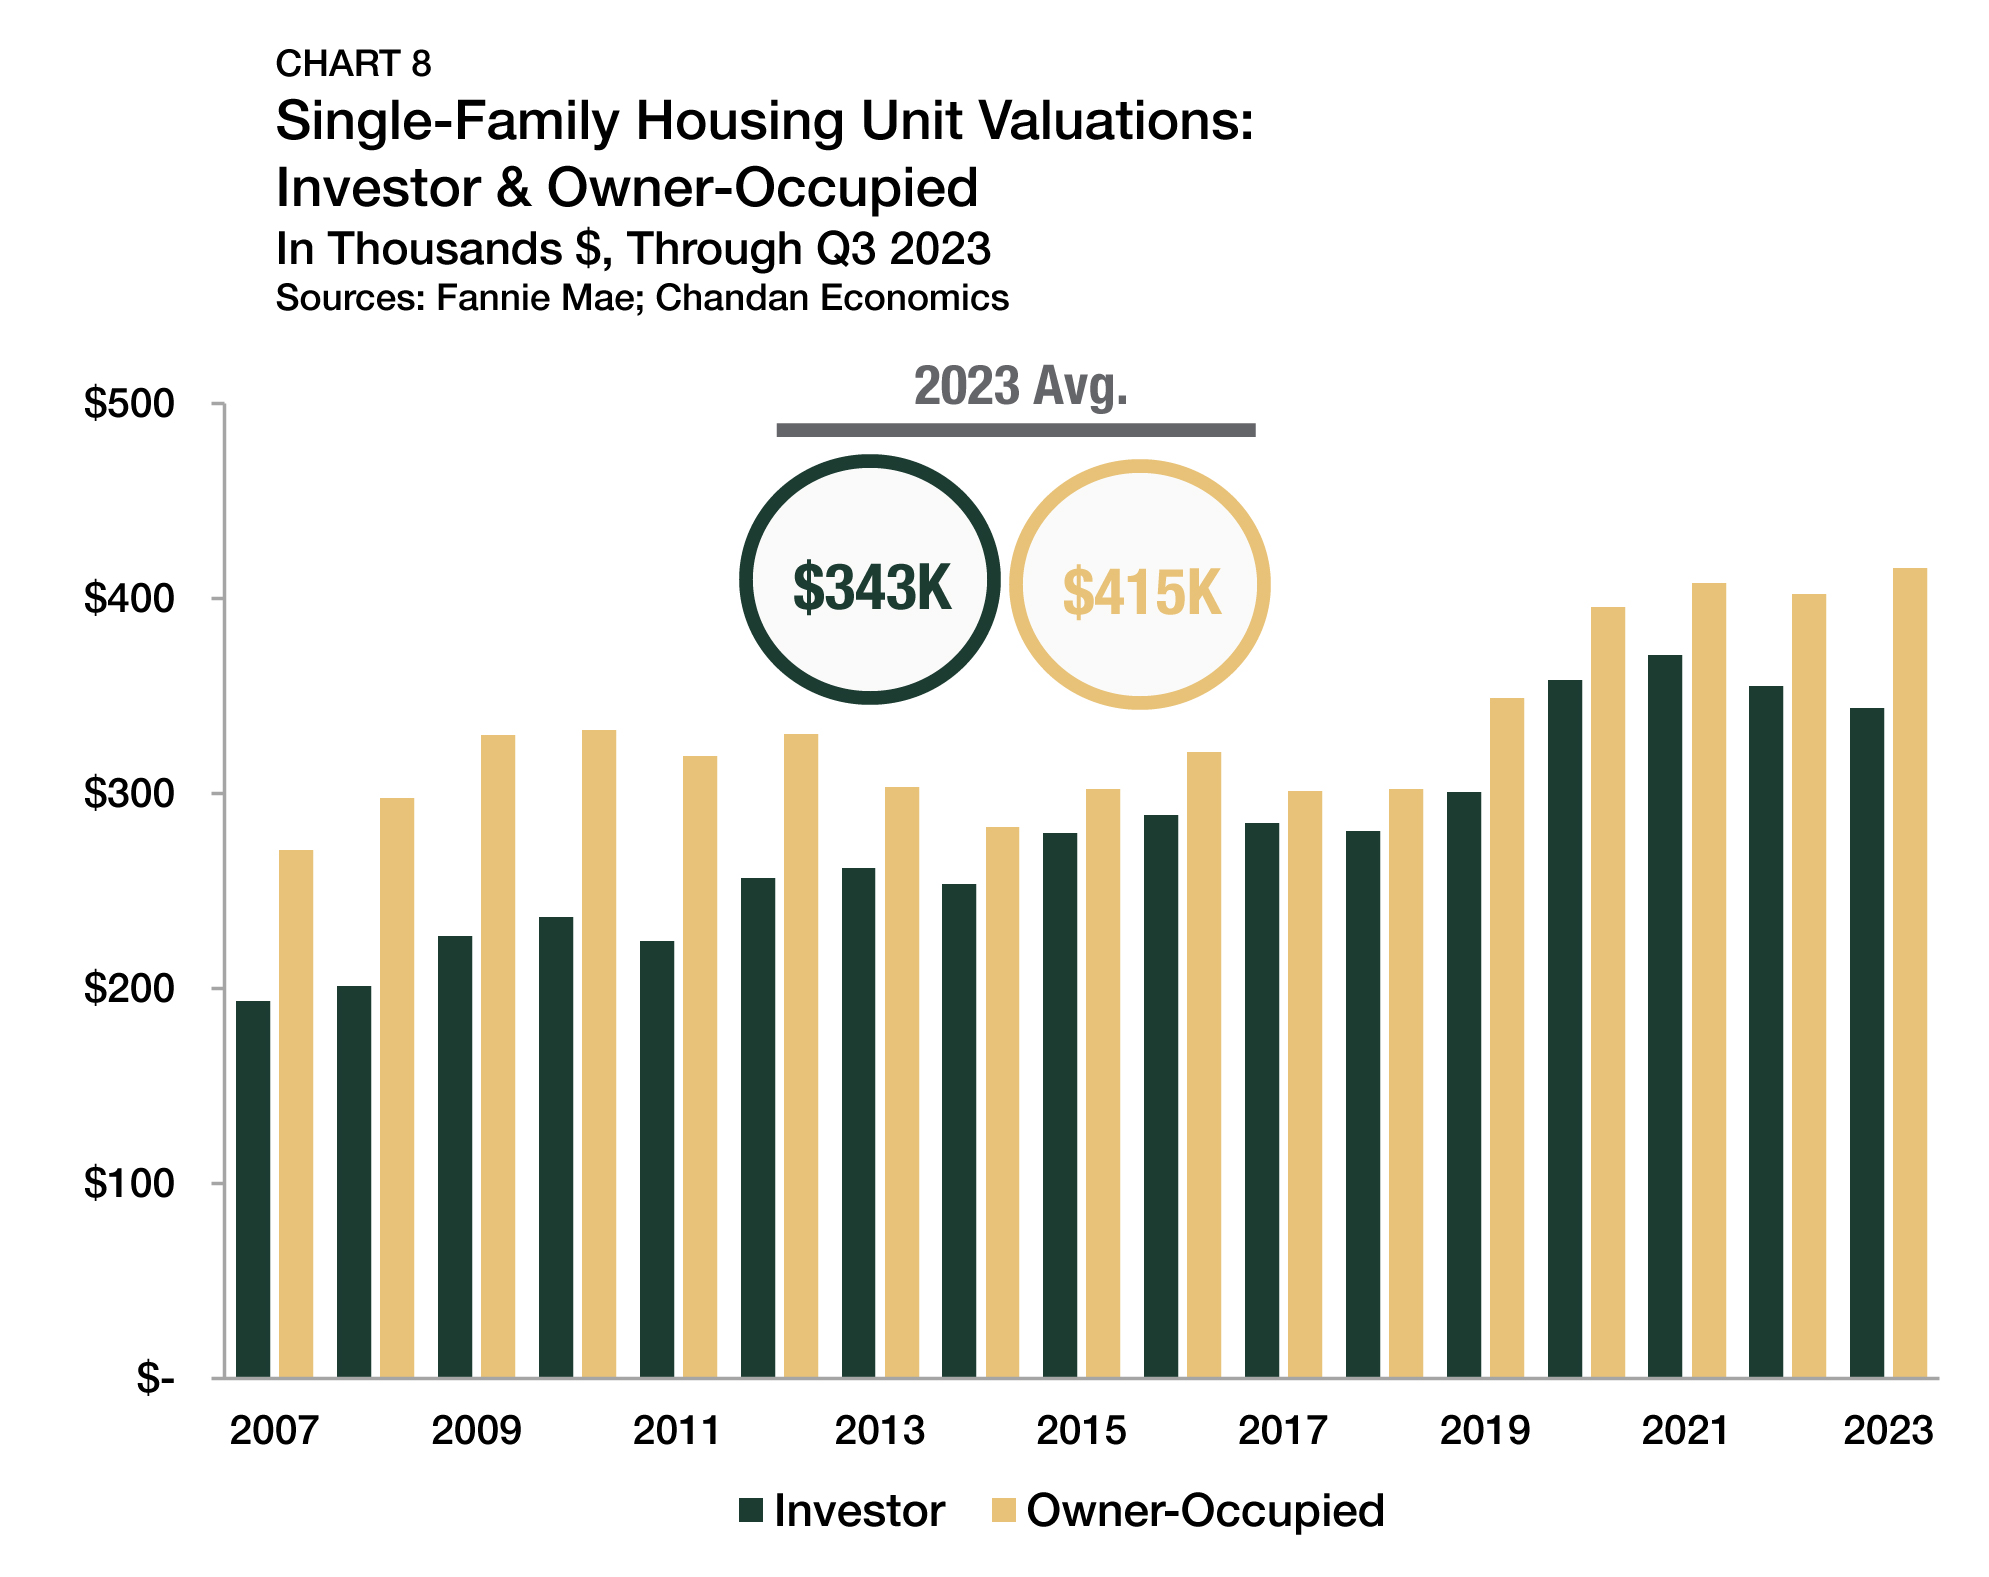
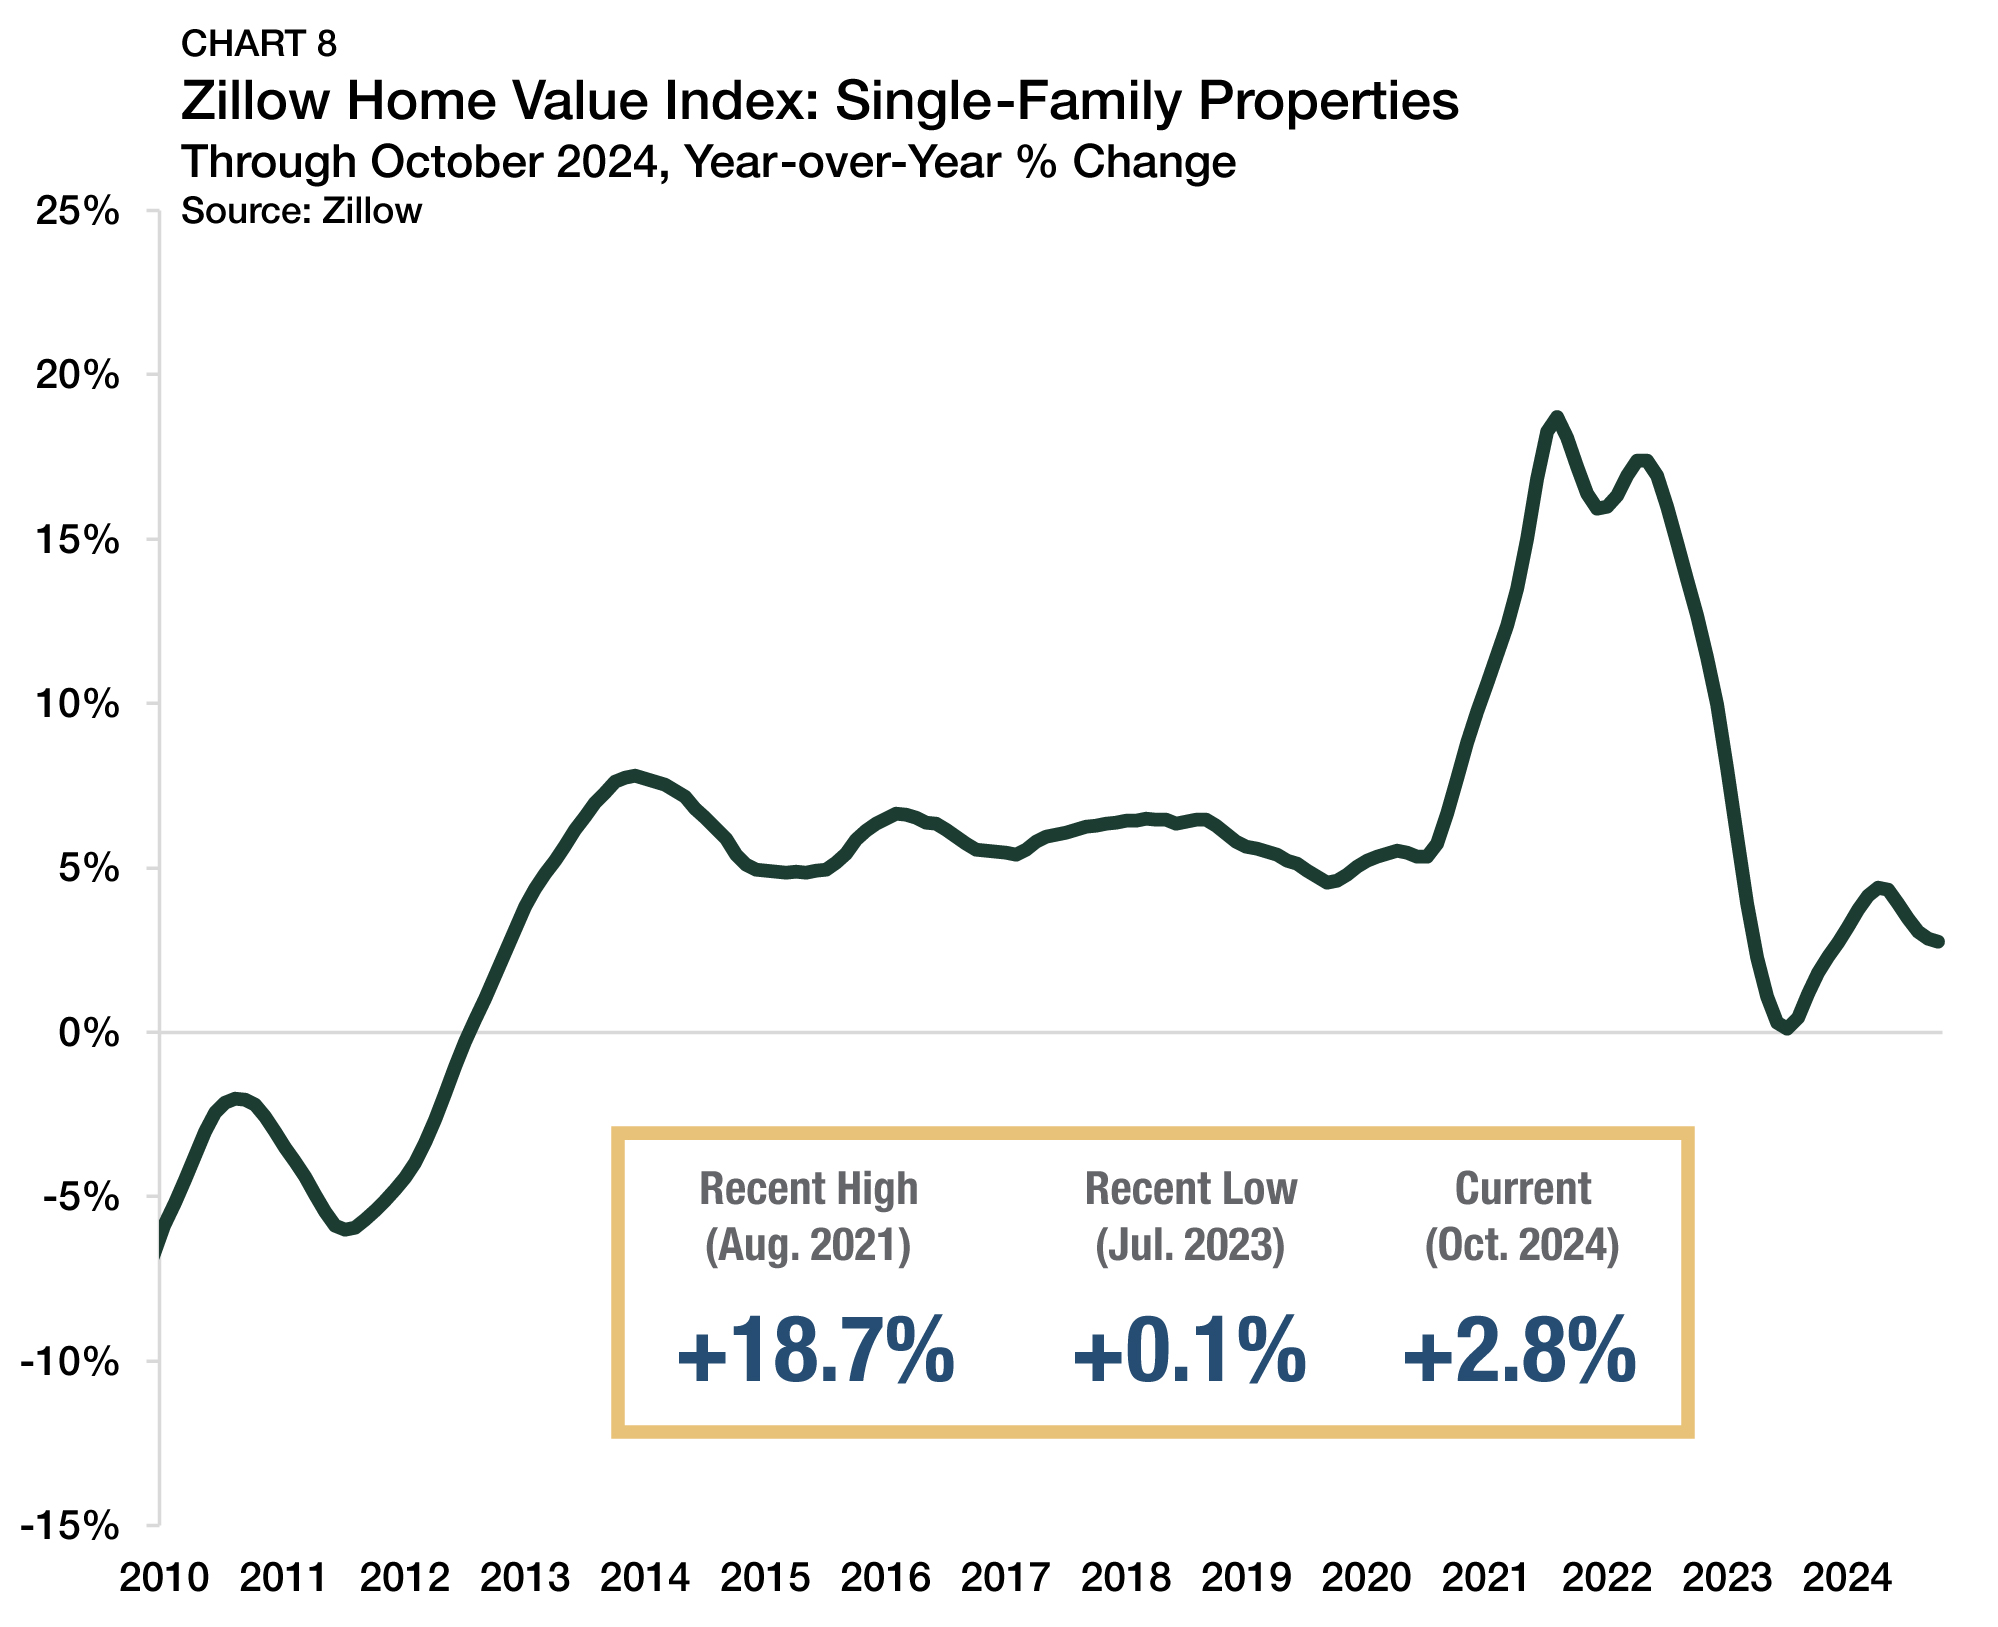
Single-family home valuations have continued to rise through October 2024, according to Zillow’s Home Value Index, which shows the average valuation for single-family property in the U.S. rising to $358,695 — up 2.8% from a year earlier (Chart 8). Single-family home prices soared at double-digit growth rates in 2021 and 2022 as low mortgage rates and pandemic-era migration shifts caused a record increase in buyer demand. More recently home appreciation has slowed to a more reasonable pace, although with mortgage rates up near 7% even marginal home price appreciation levels are noteworthy.
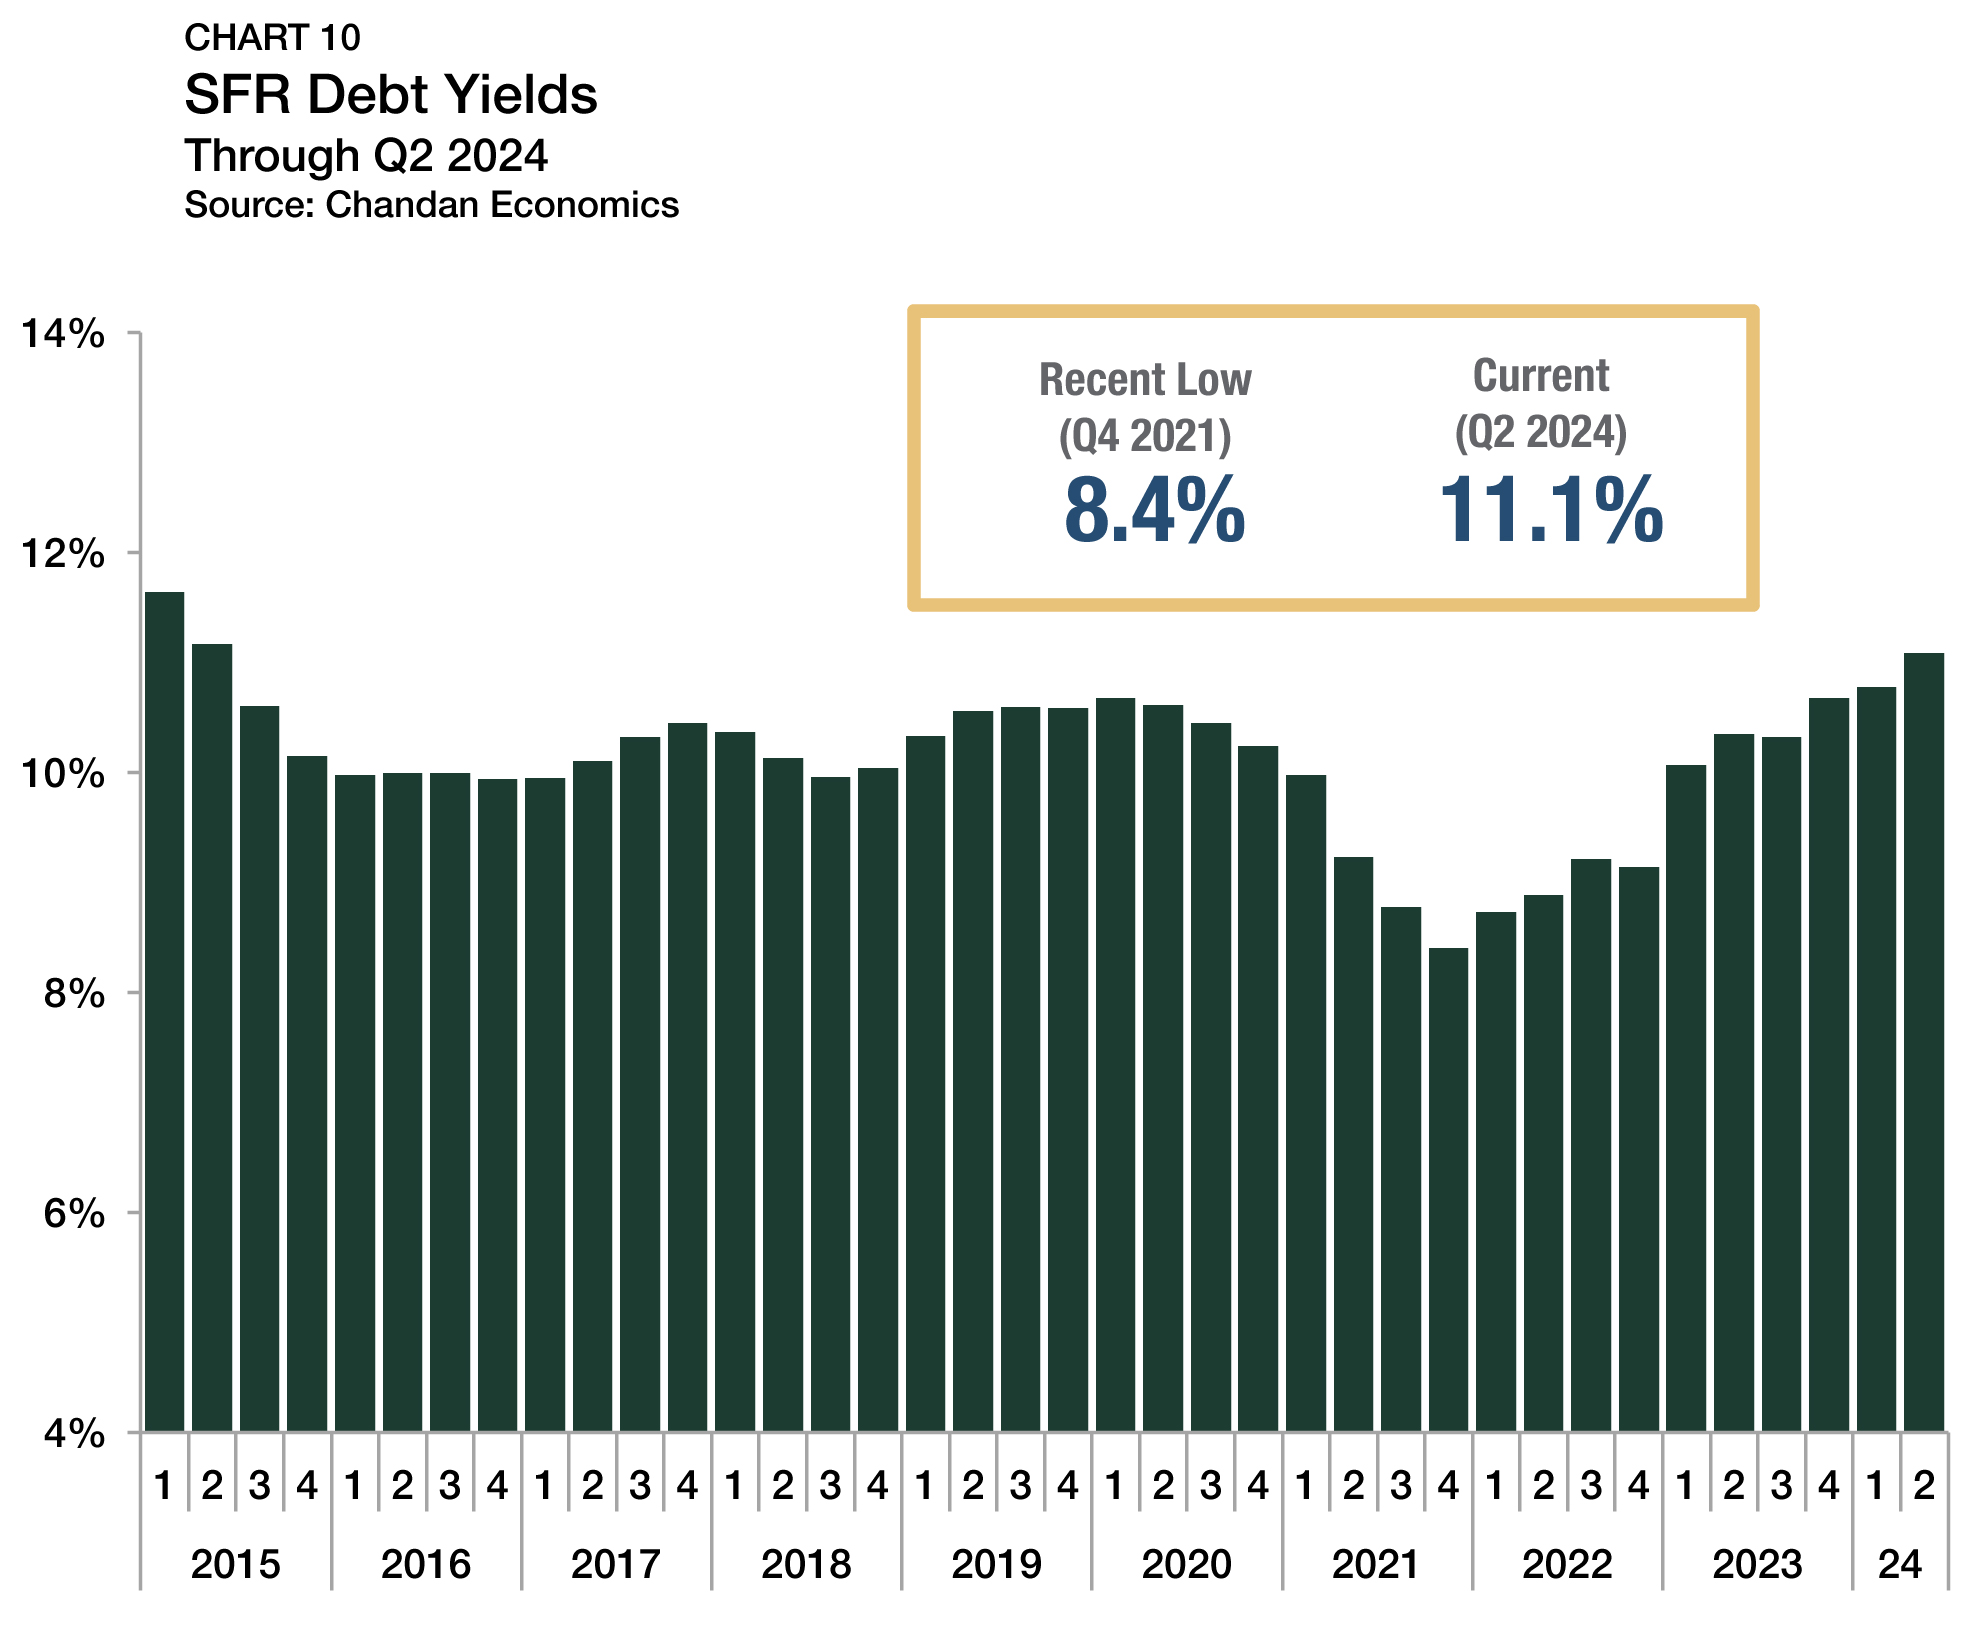
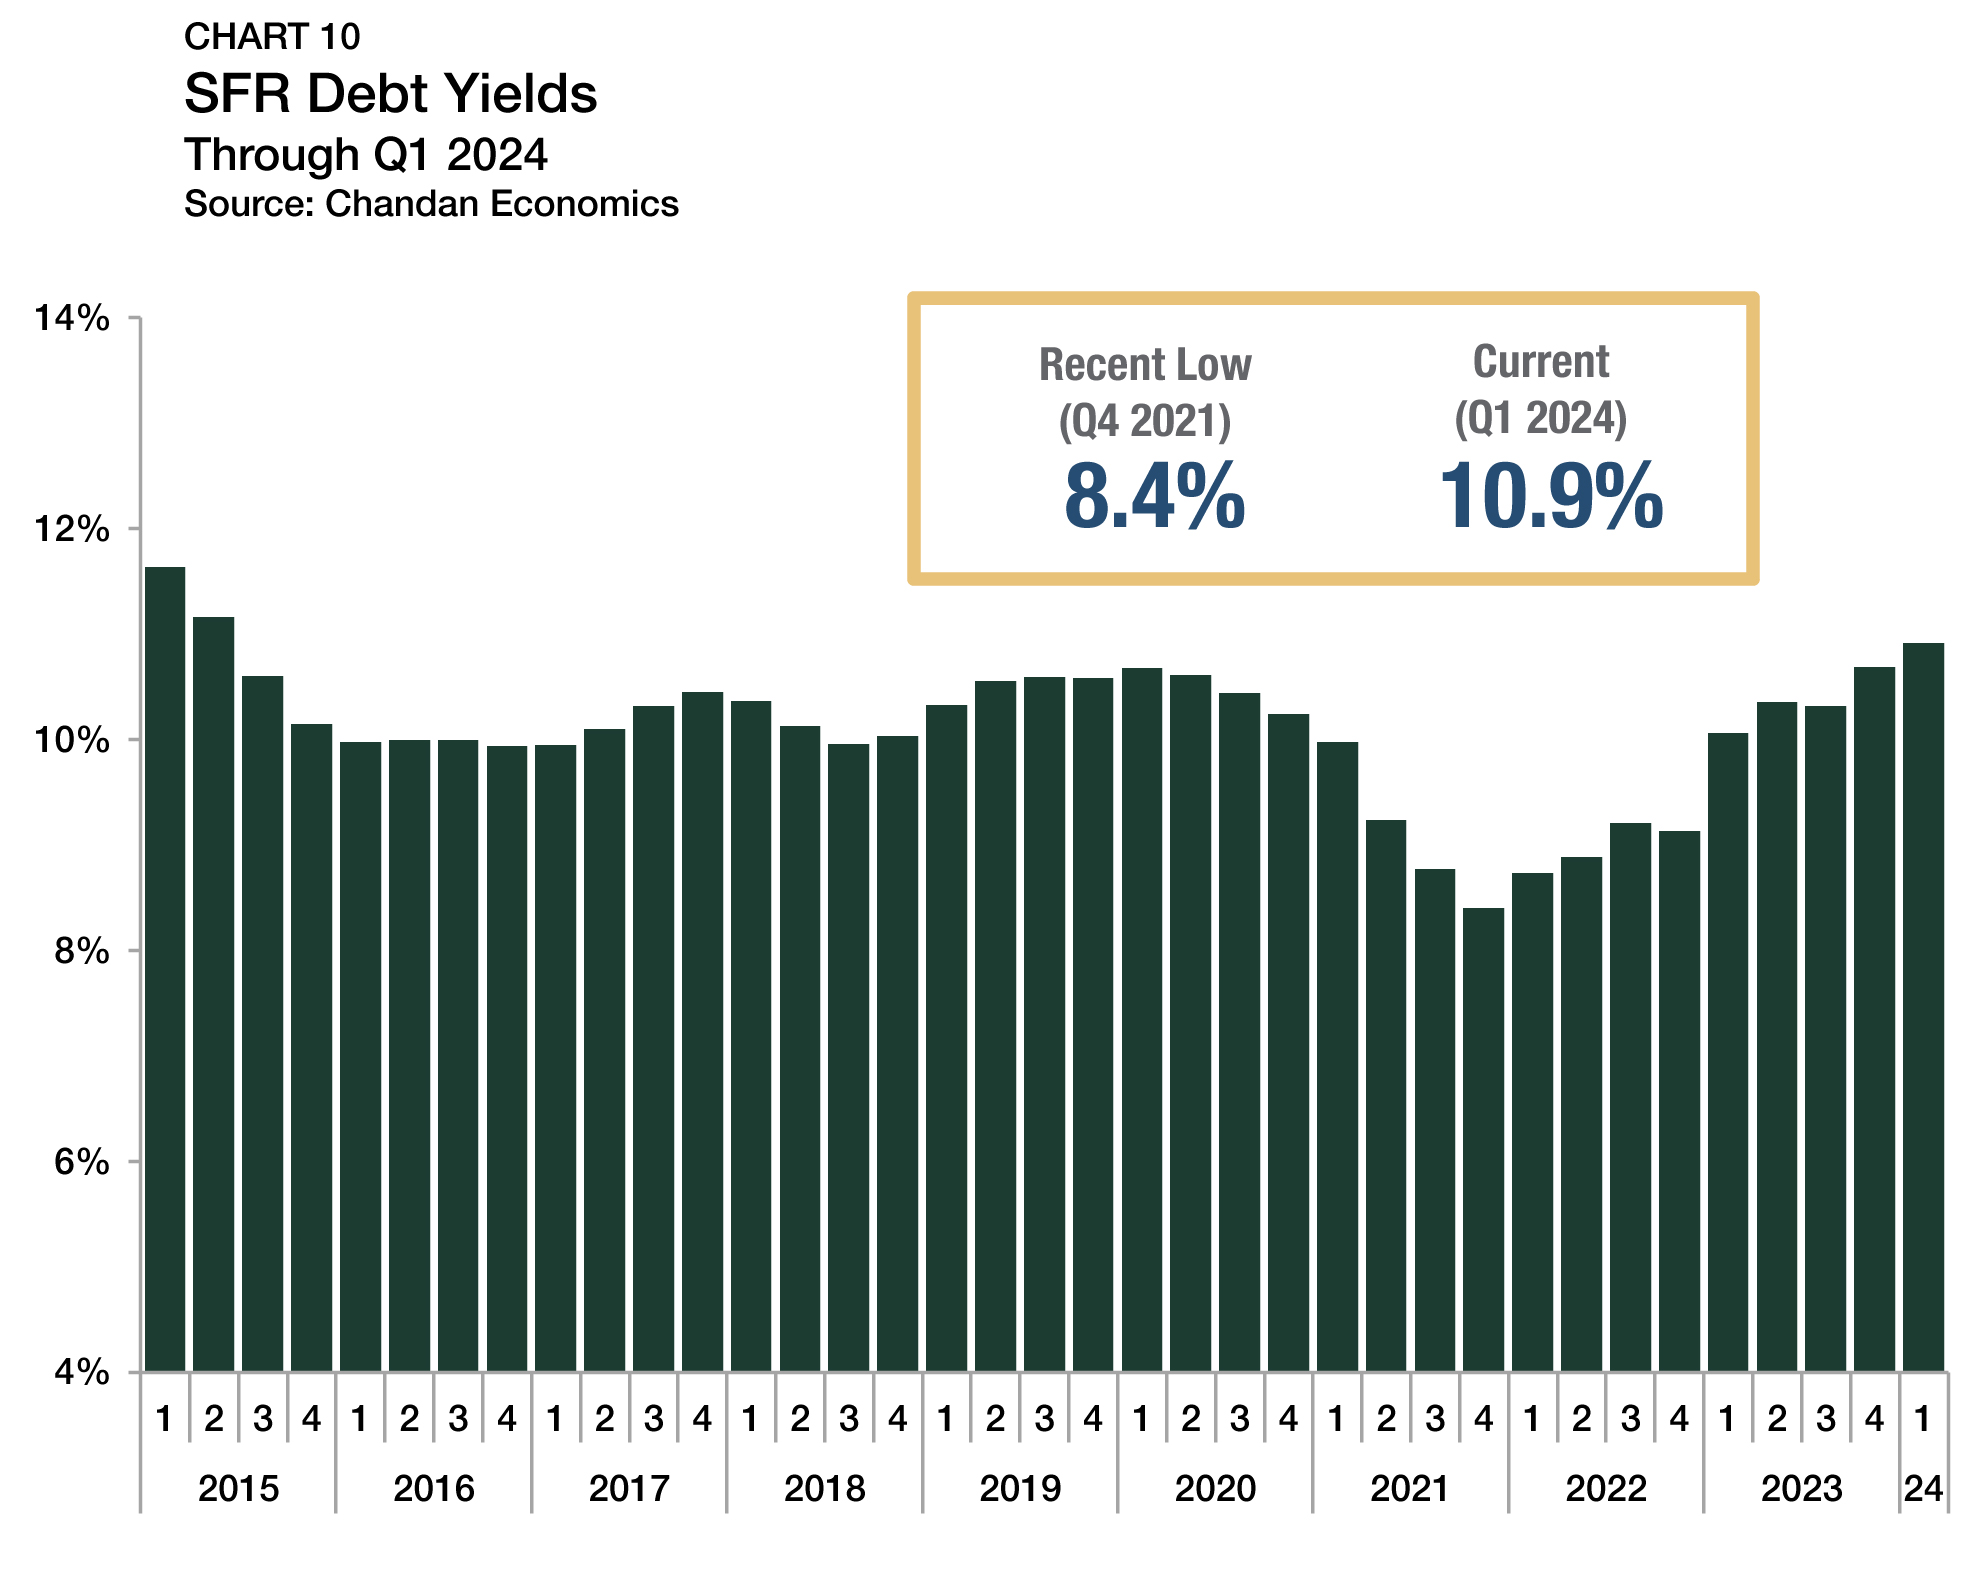
Debt Yields
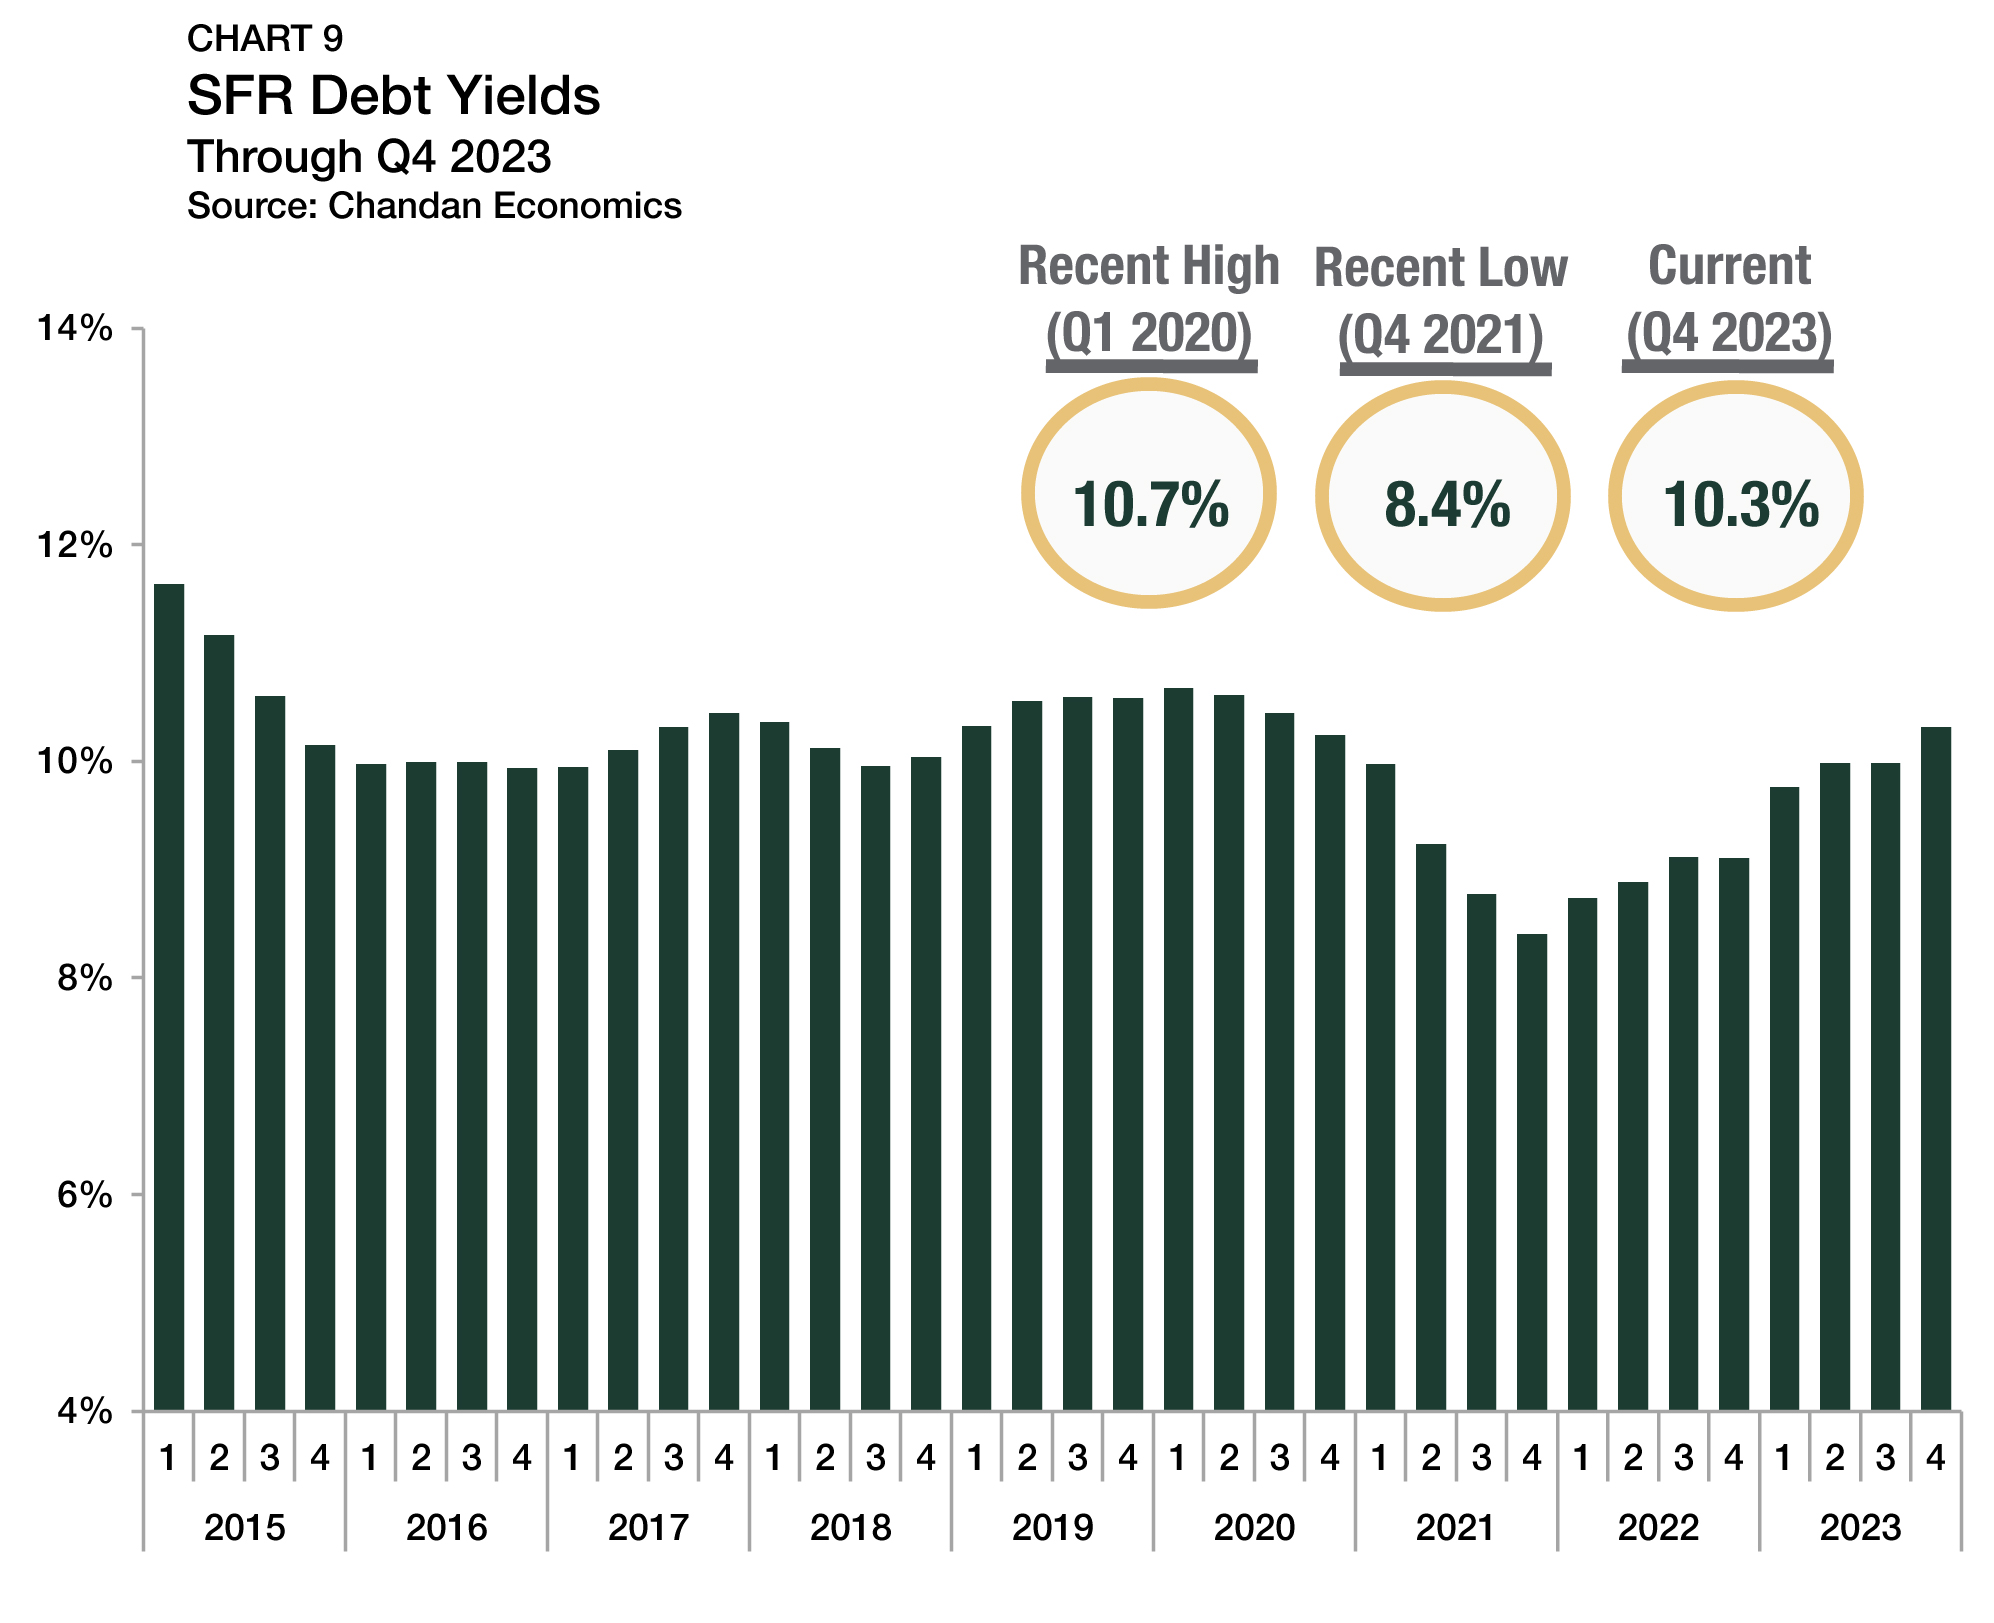
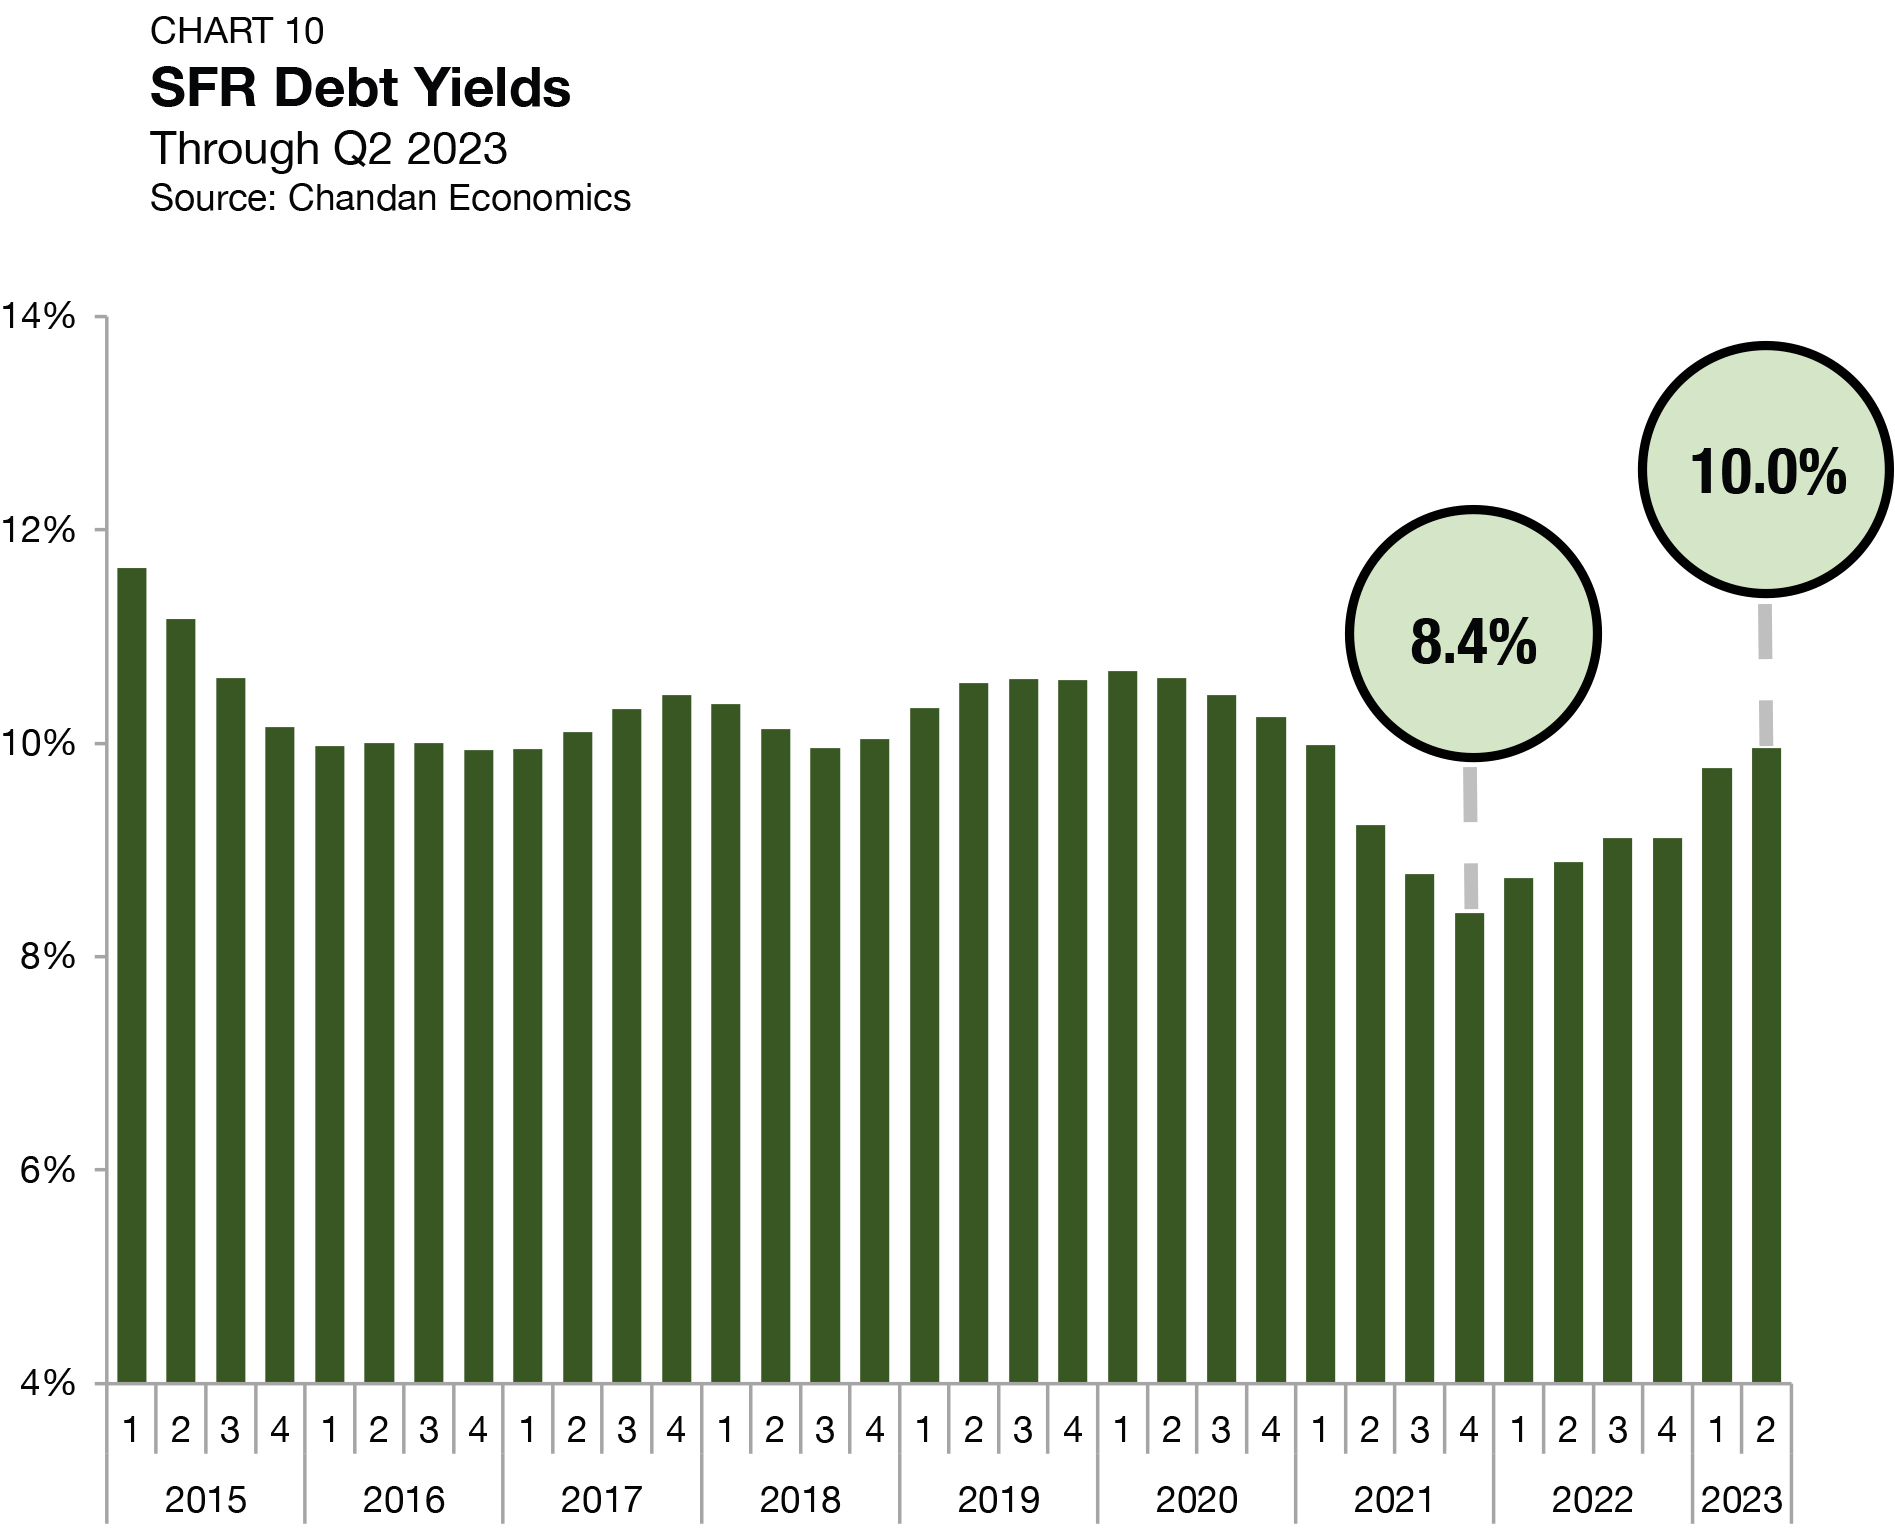
Debt yields, a key measure of credit risk, fell slightly during the third quarter of 2024, falling by five bps to finish at 10.8% (Chart 9). The decrease marked the first decline in the past year. Moreover, it was just the third time in the past 11 quarters they have declined from the previous quarter. Compared to the low of 8.4% seen in the fourth quarter of 2021, debt yields have risen by 239 bps. The recent rise in debt yields in recent quarters means that SFR investors are securing less debt capital for every $1.00 of property-level net operating income (NOI). Through the third quarter of 2024, SFR investors are securing an average of $9.23 of debt for every $1.00 of NOI — down from a 2021 peak of $11.84, though up $0.04 from the previous quarter.

Residential Distress
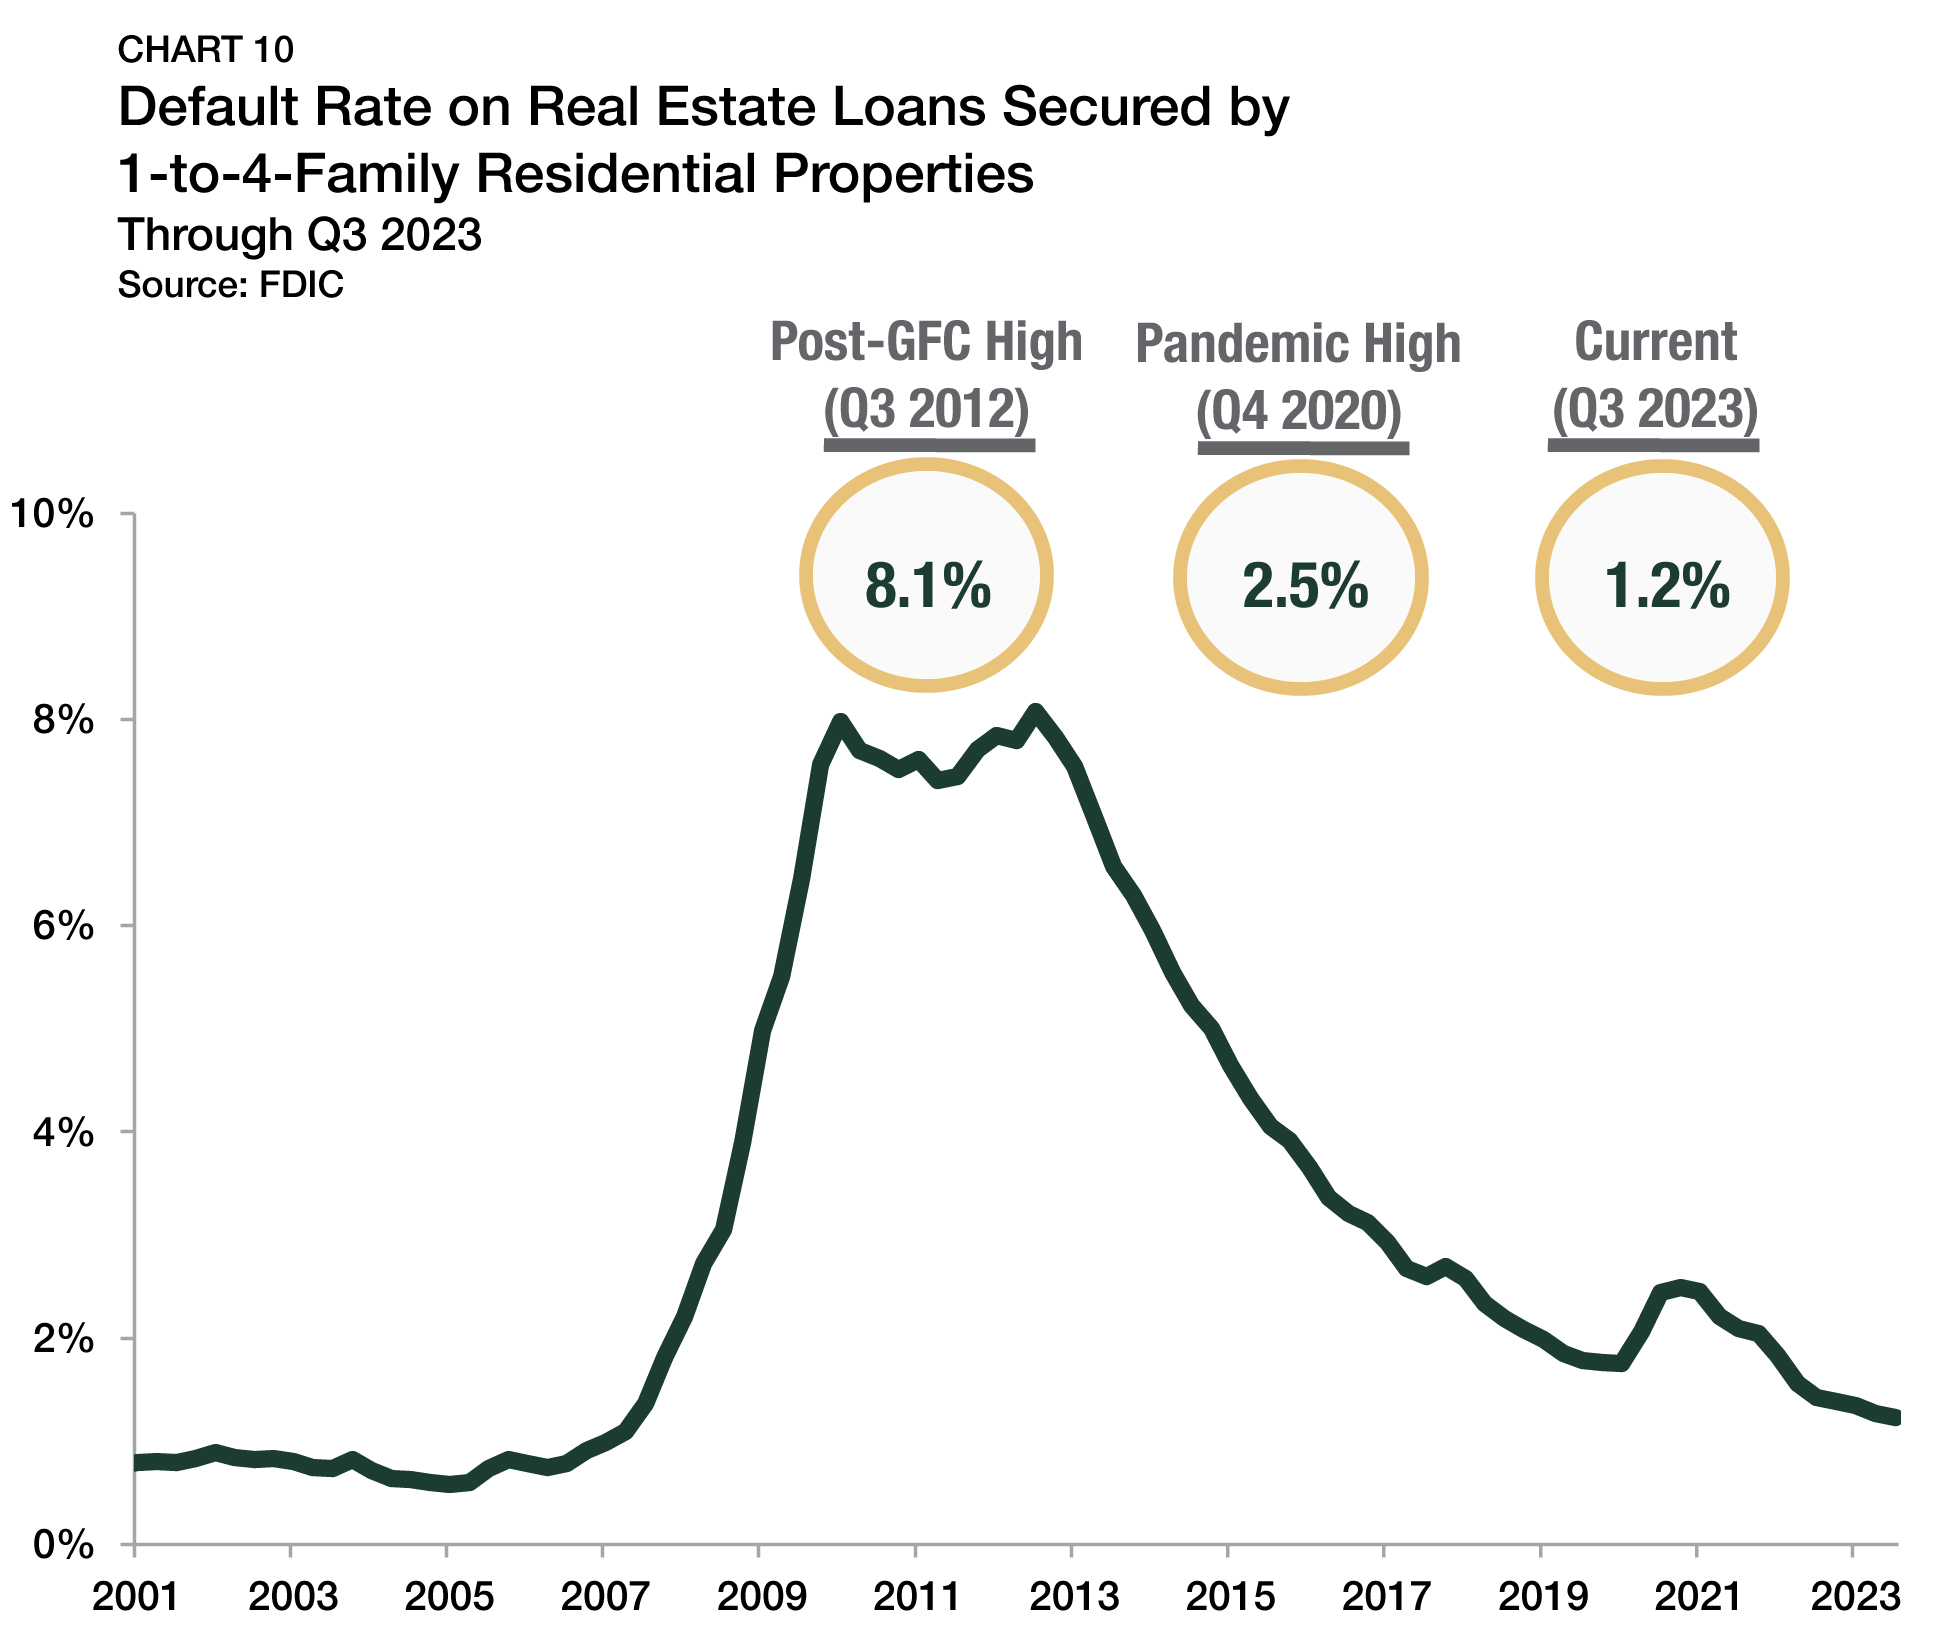
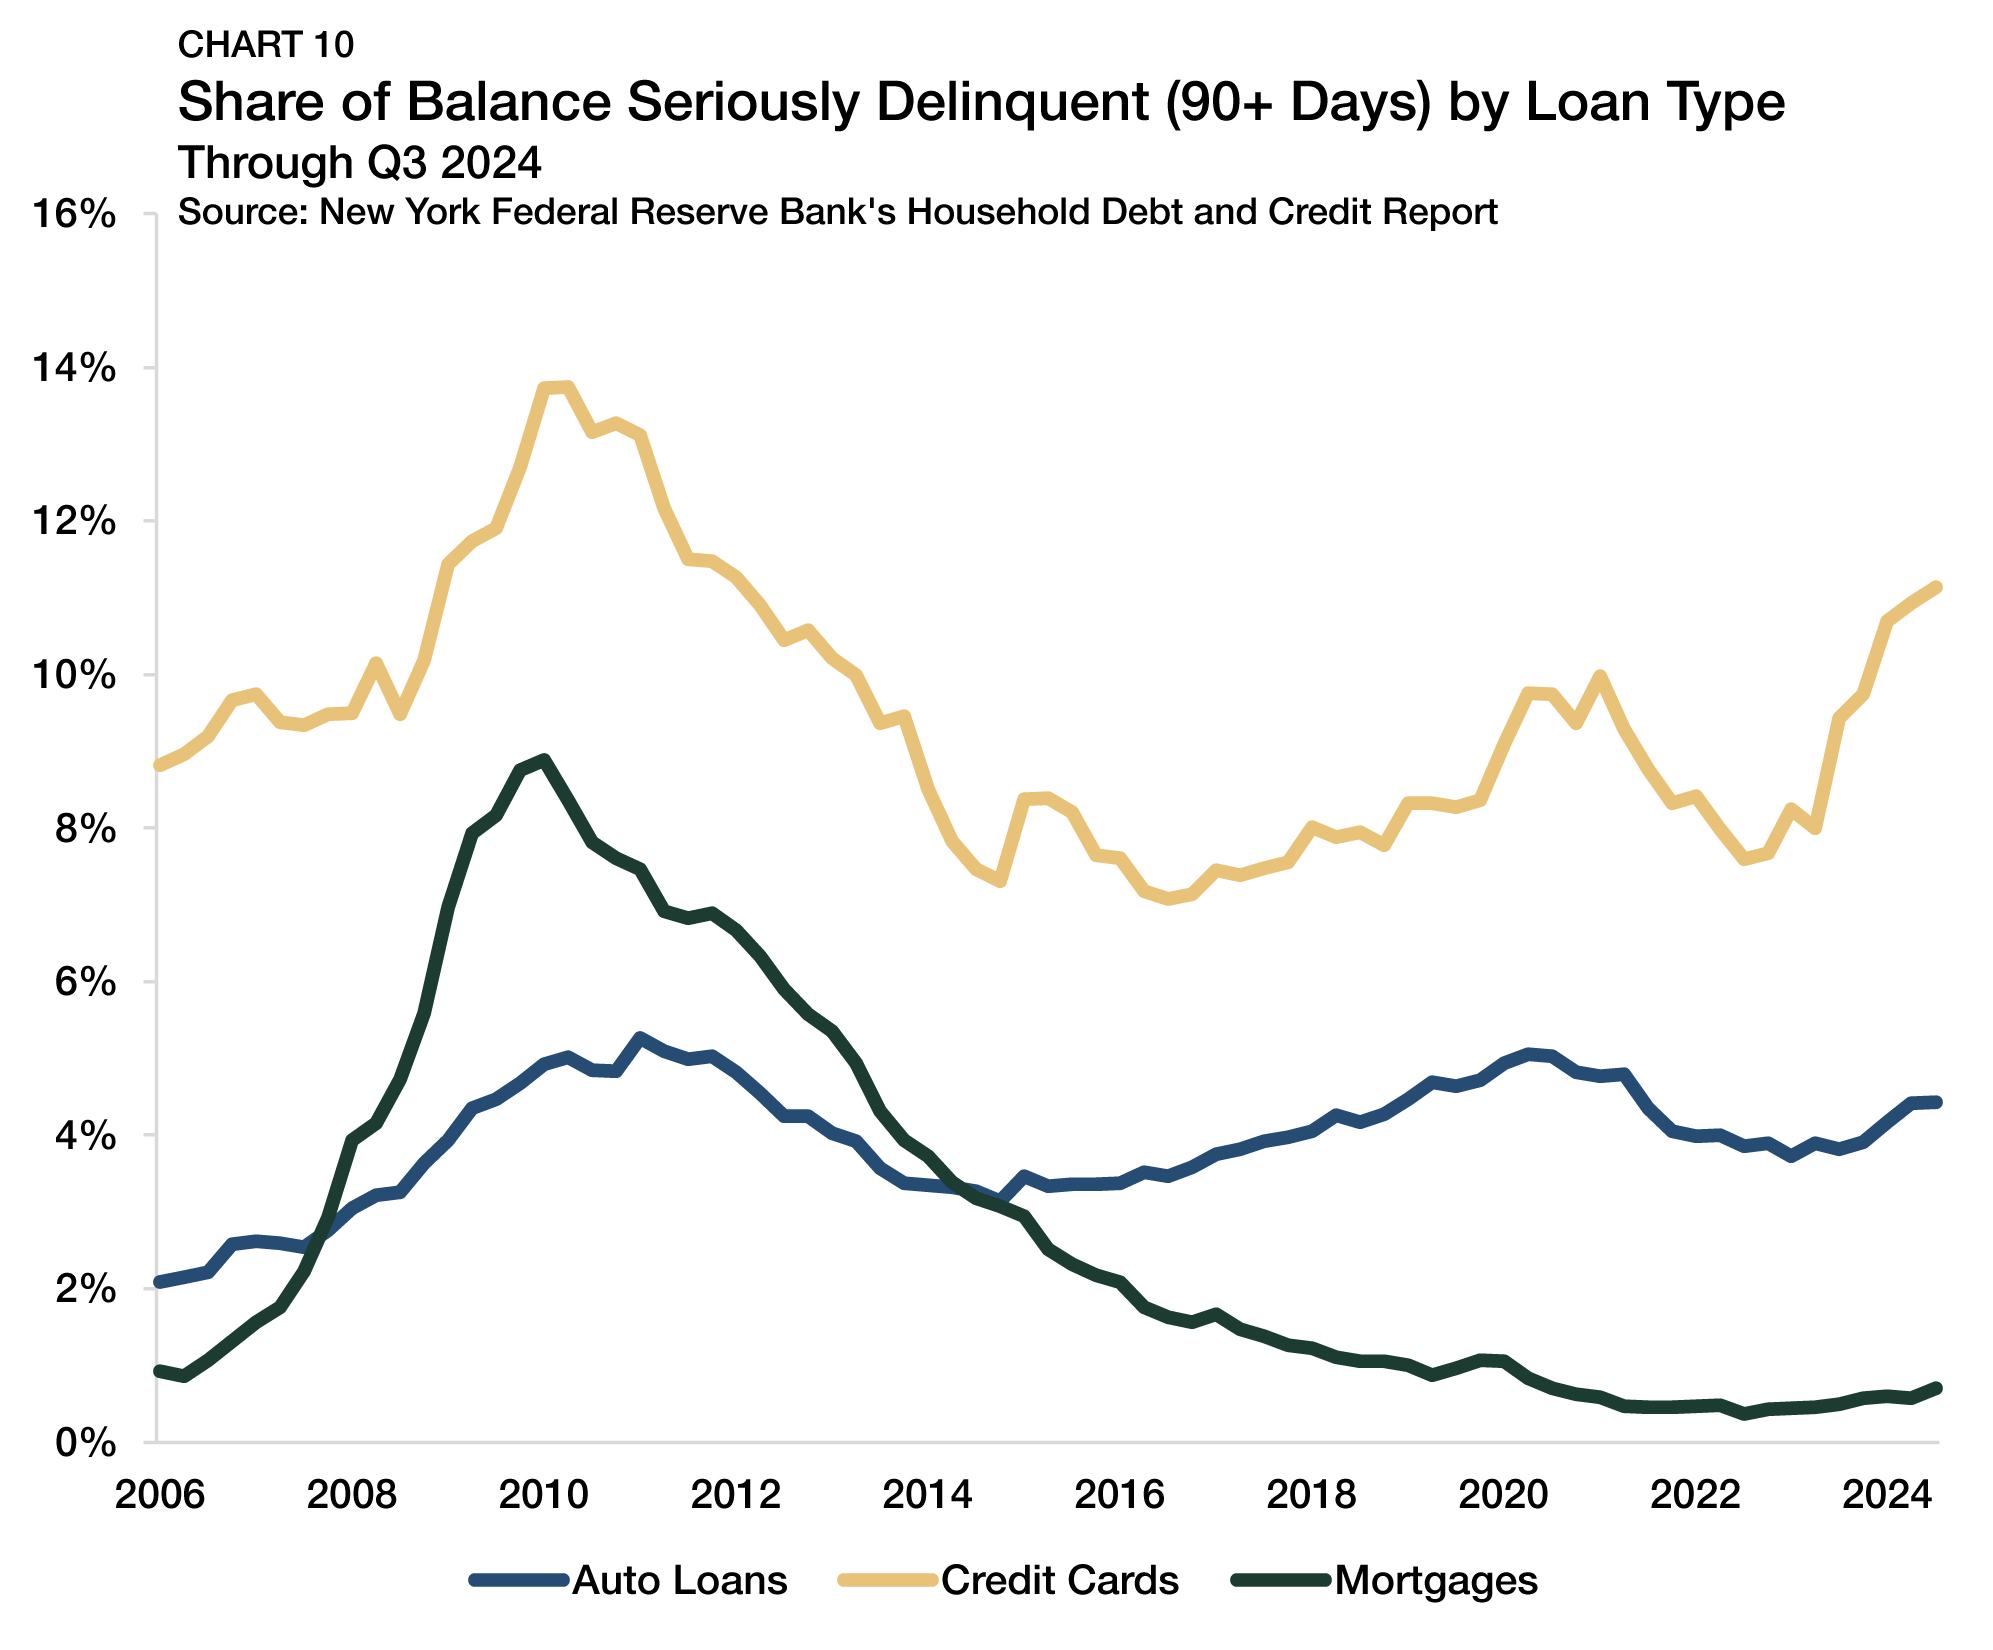
Even with elevated mortgage interest rates, there has been little to no distress across the U.S. housing market. The Federal Reserve Bank of New York’s Q3 2024 Quarterly Report on Household Debt and Credit indicated that only 0.7% of household mortgages were more than 90 days delinquent through the third quarter of 2024, which is 0.4 percentage points below where default rates were at the start of the pandemic (Chart 10).
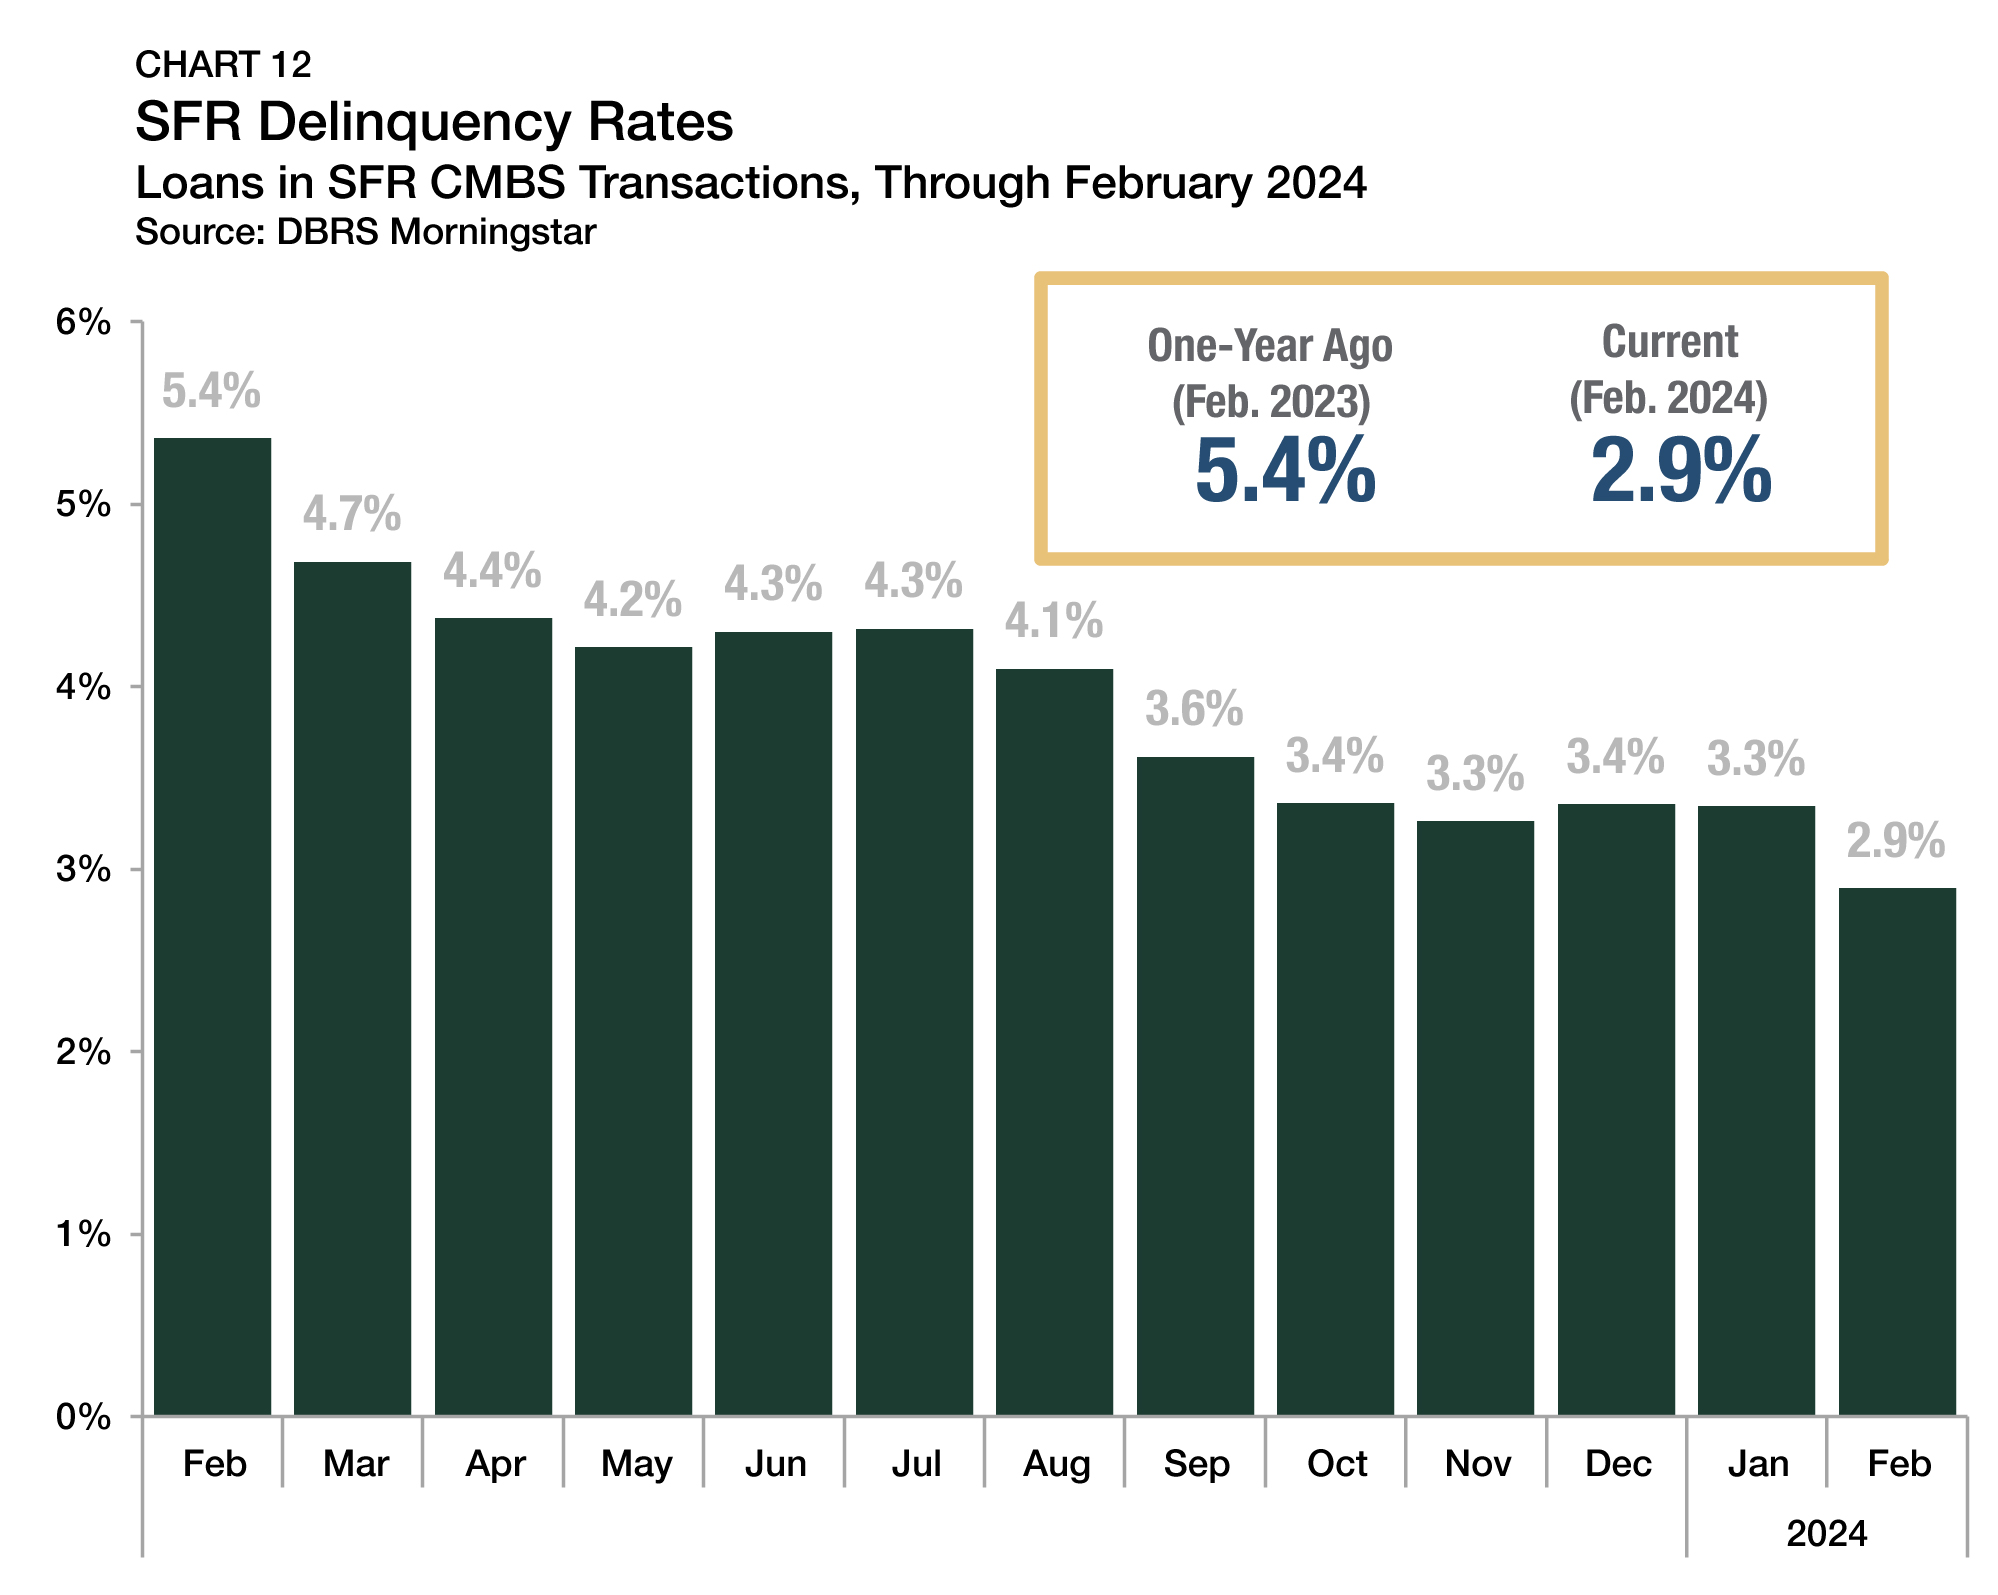
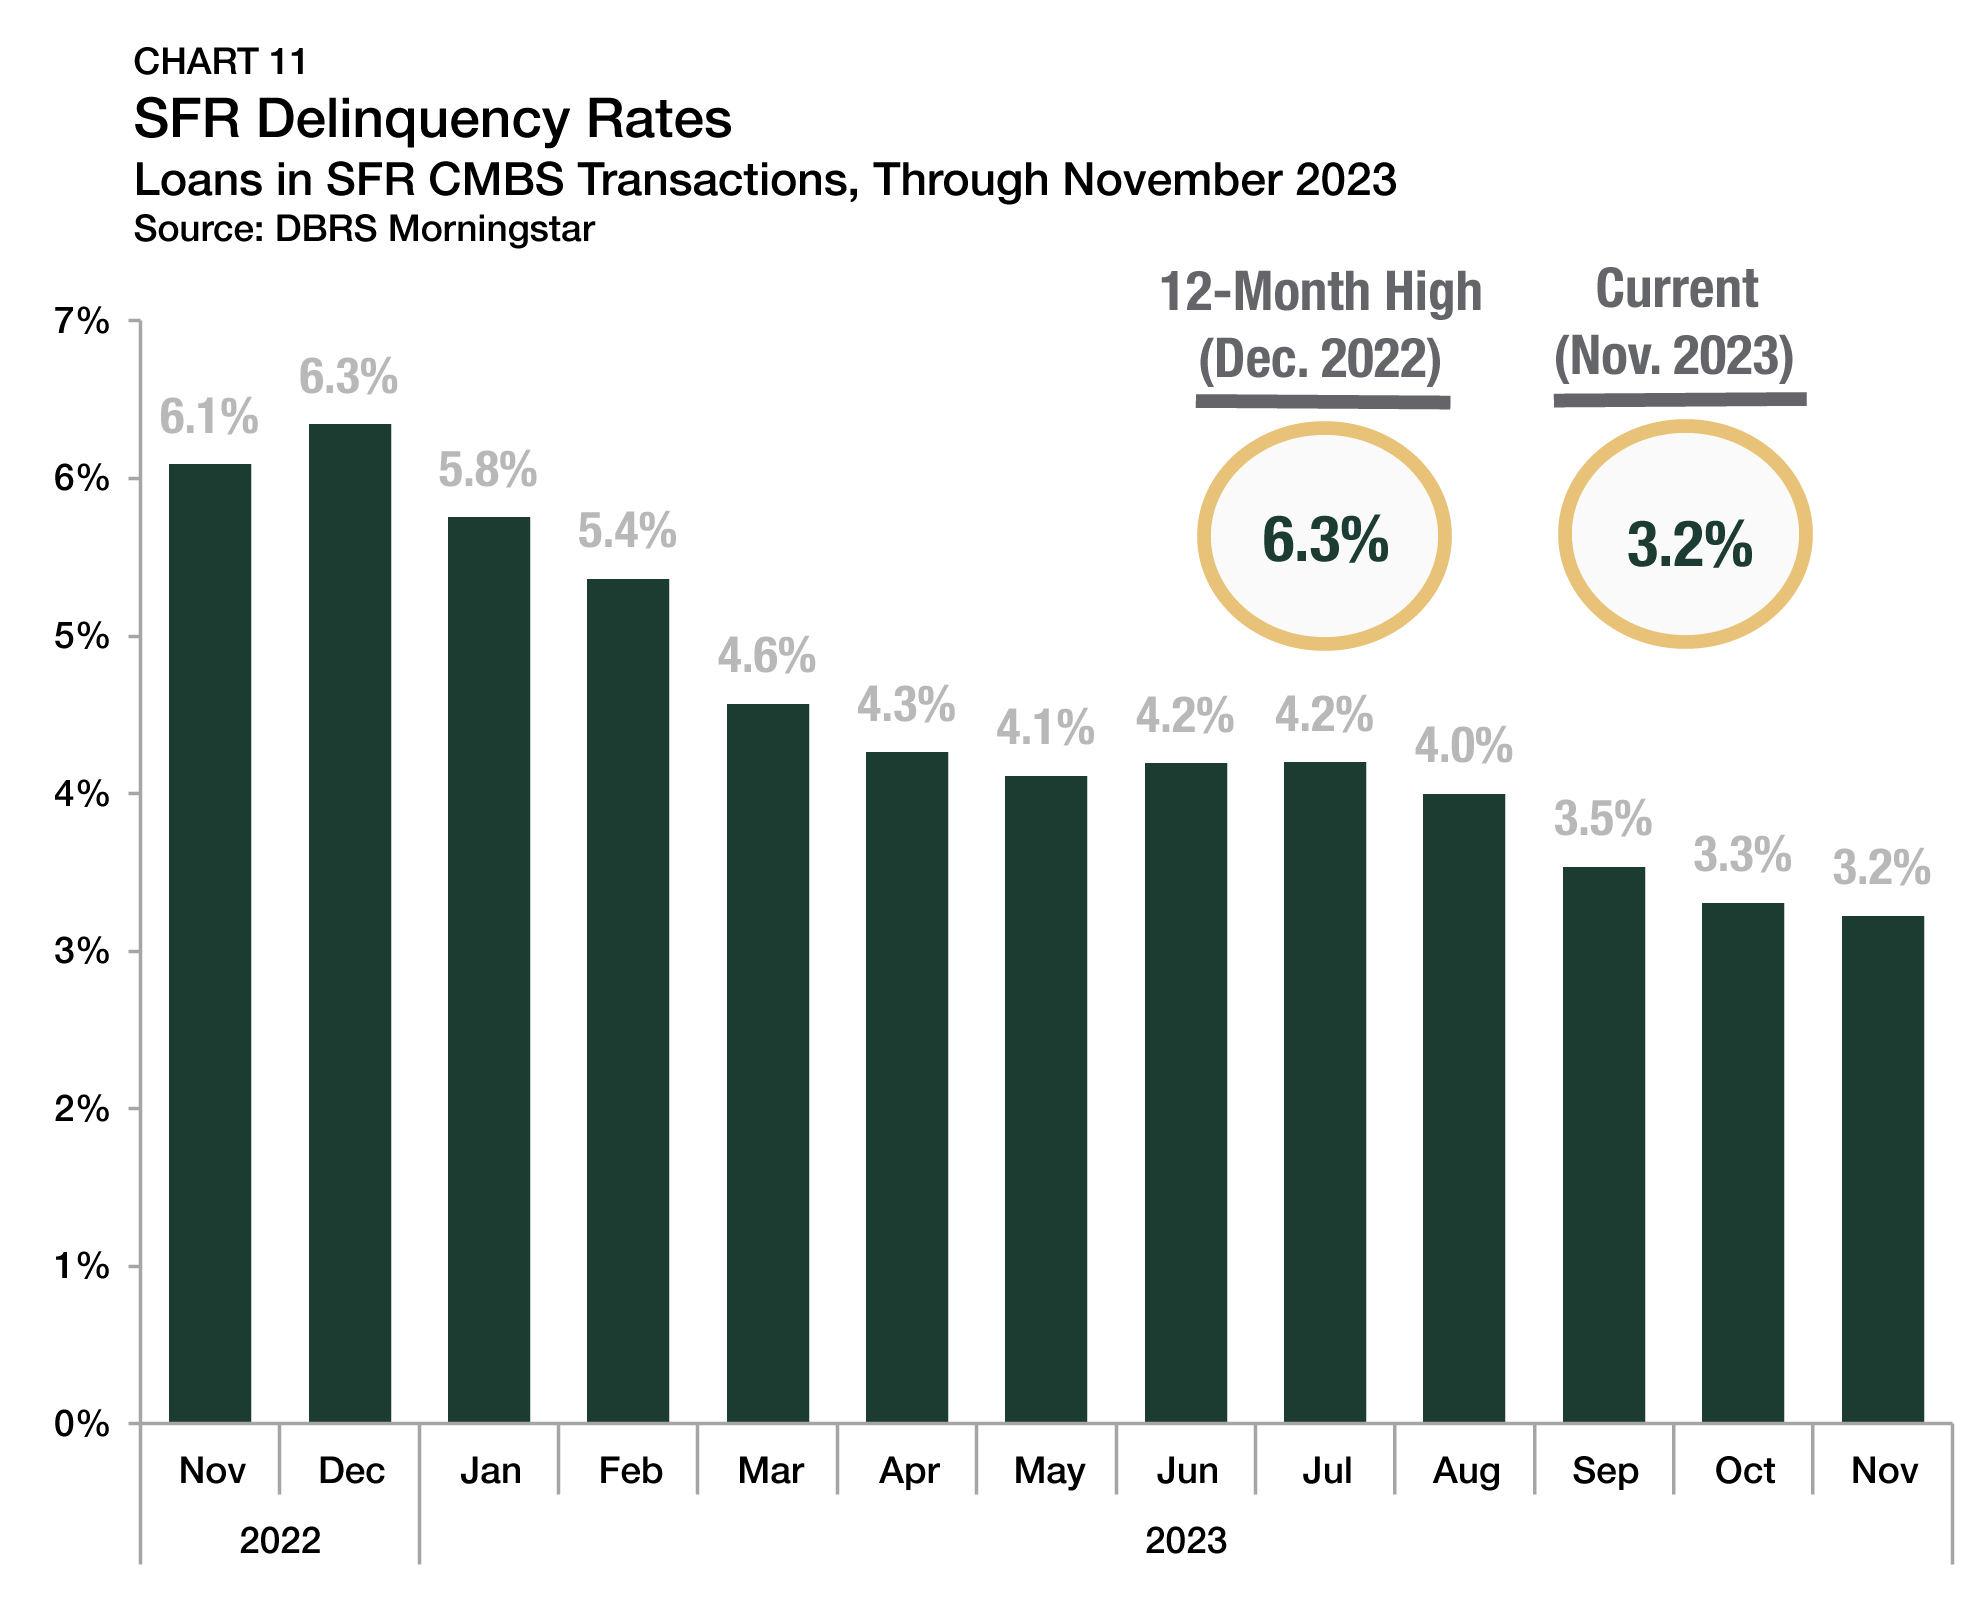
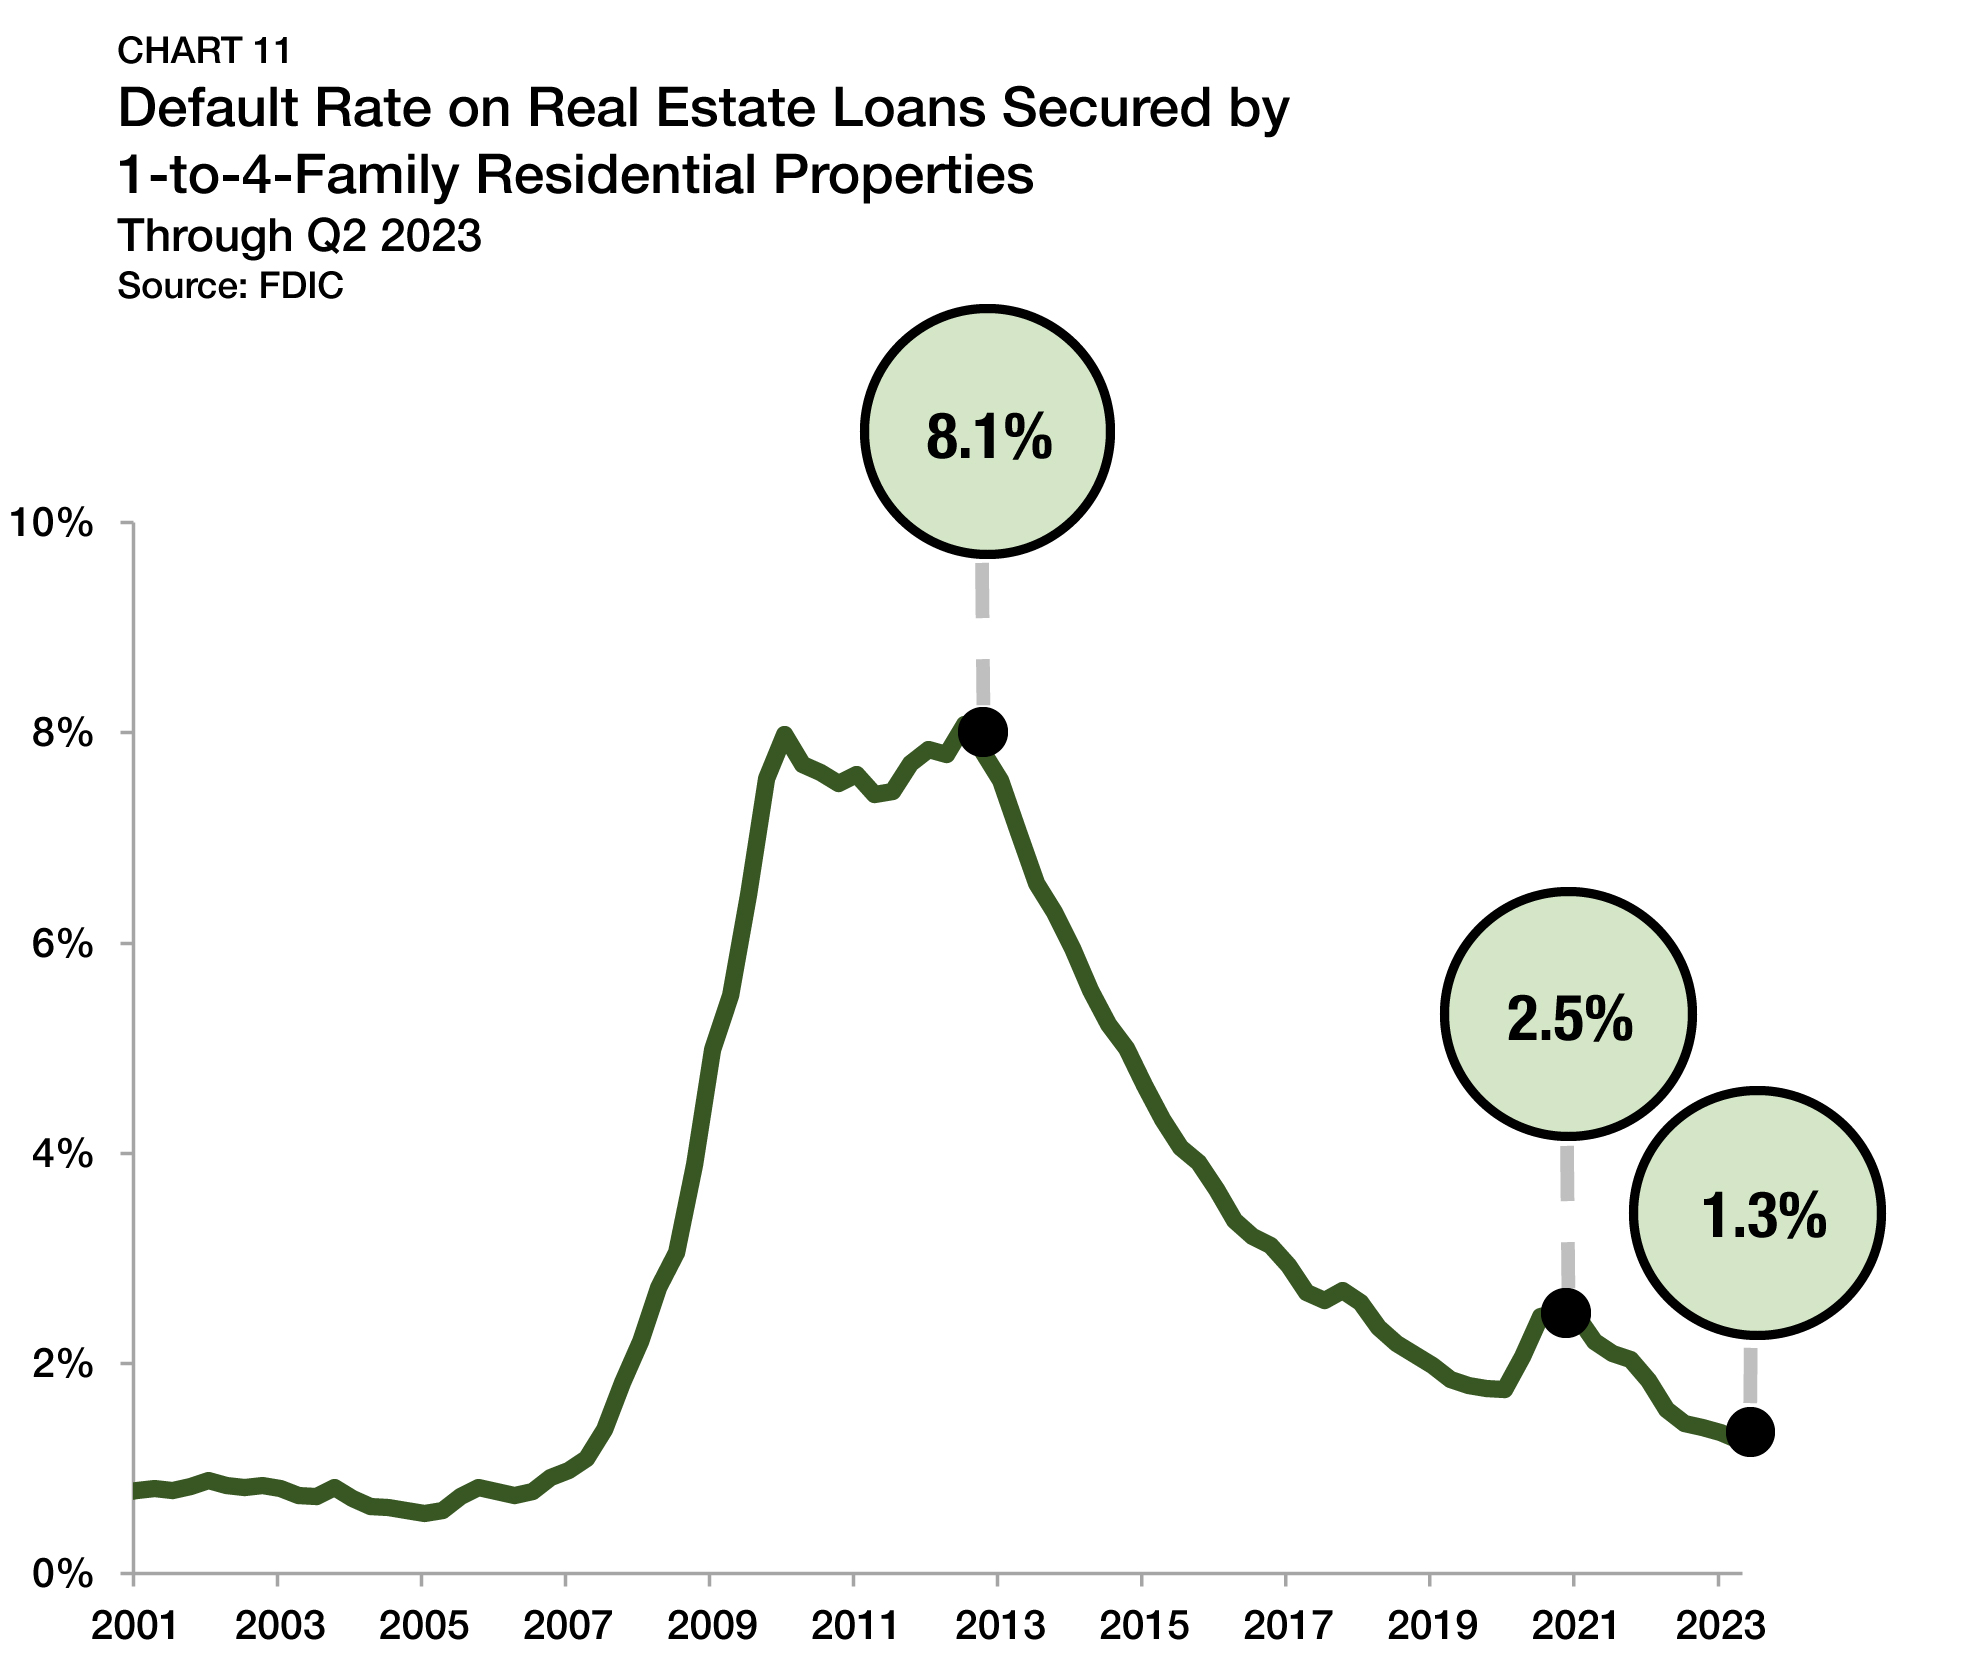
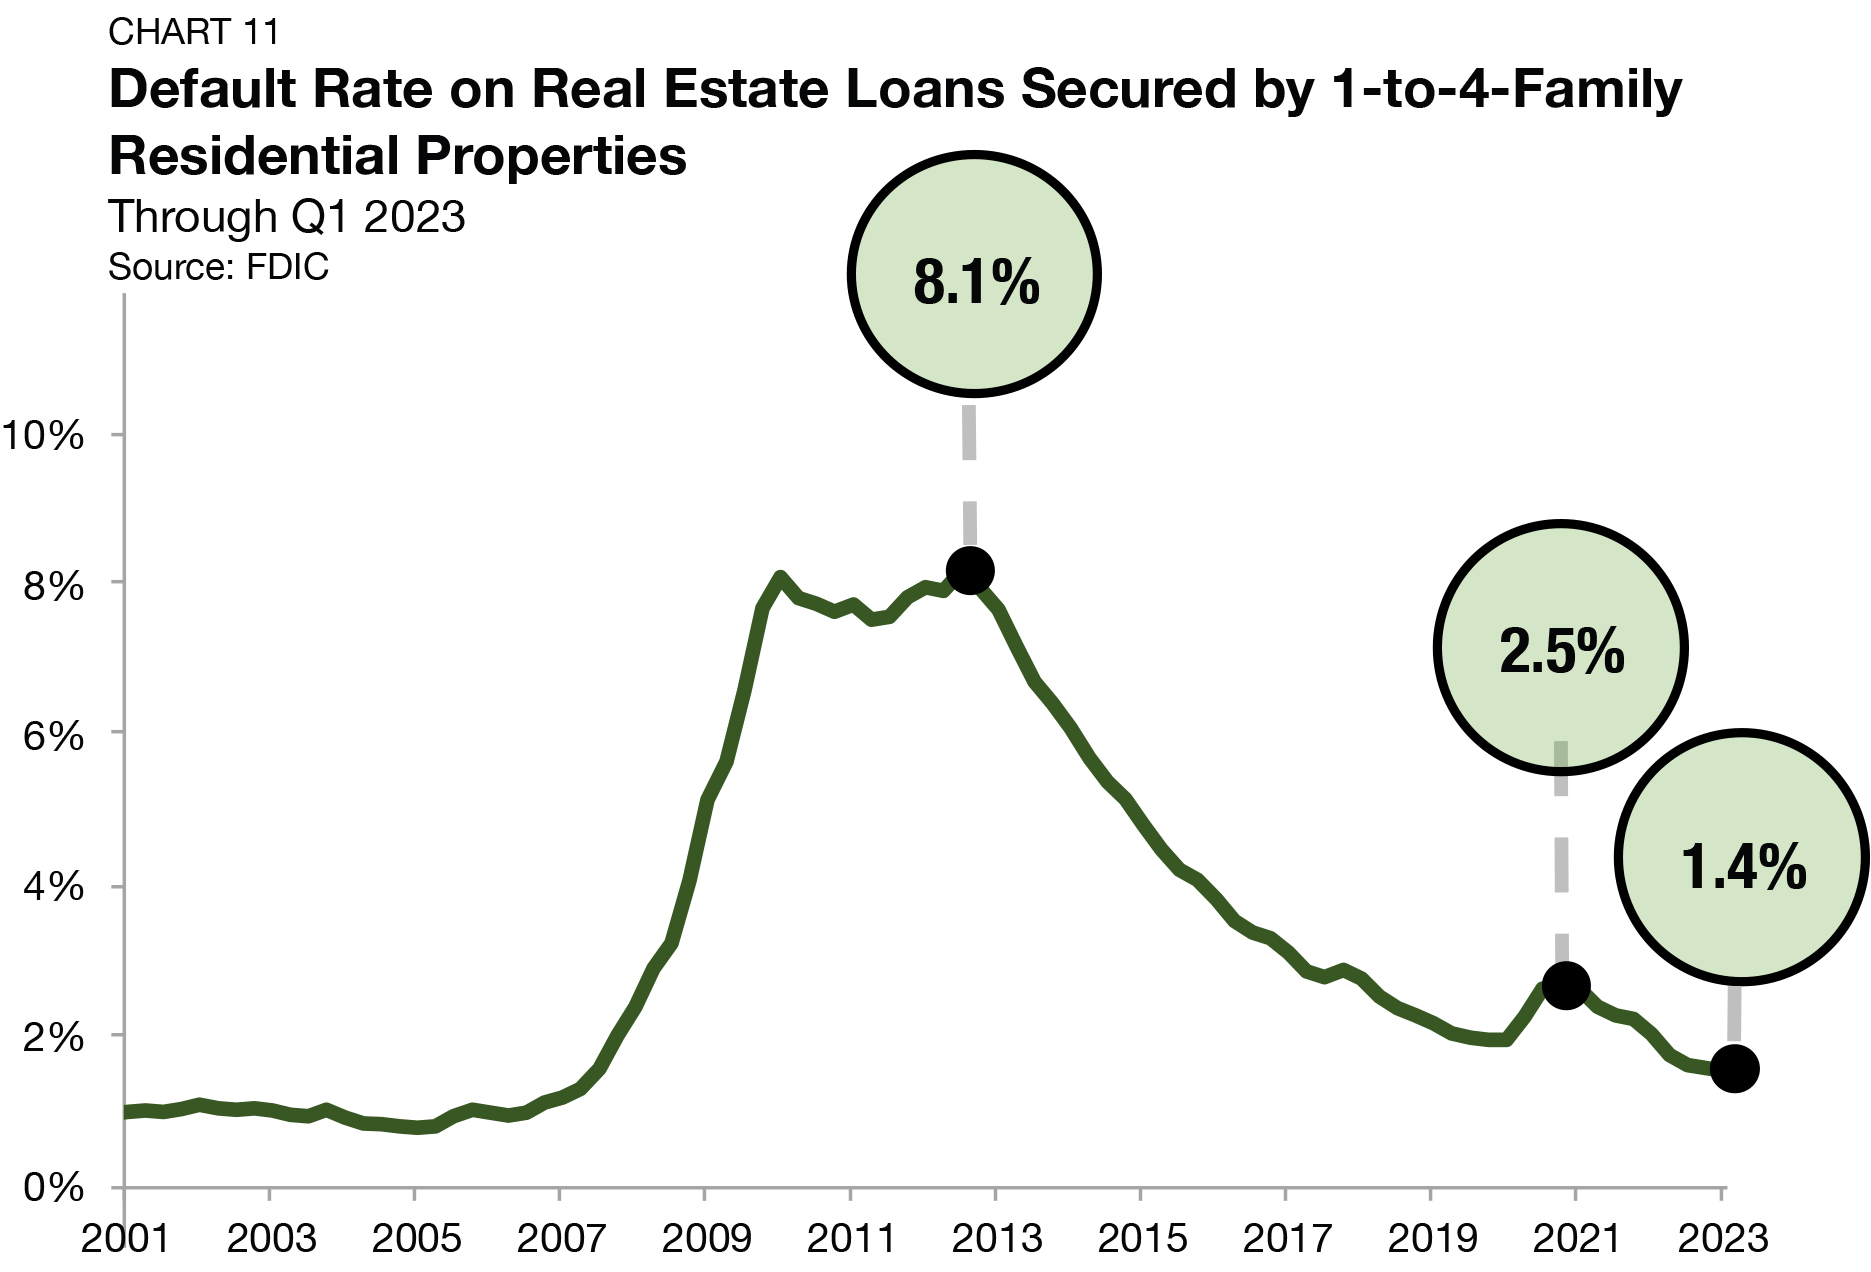
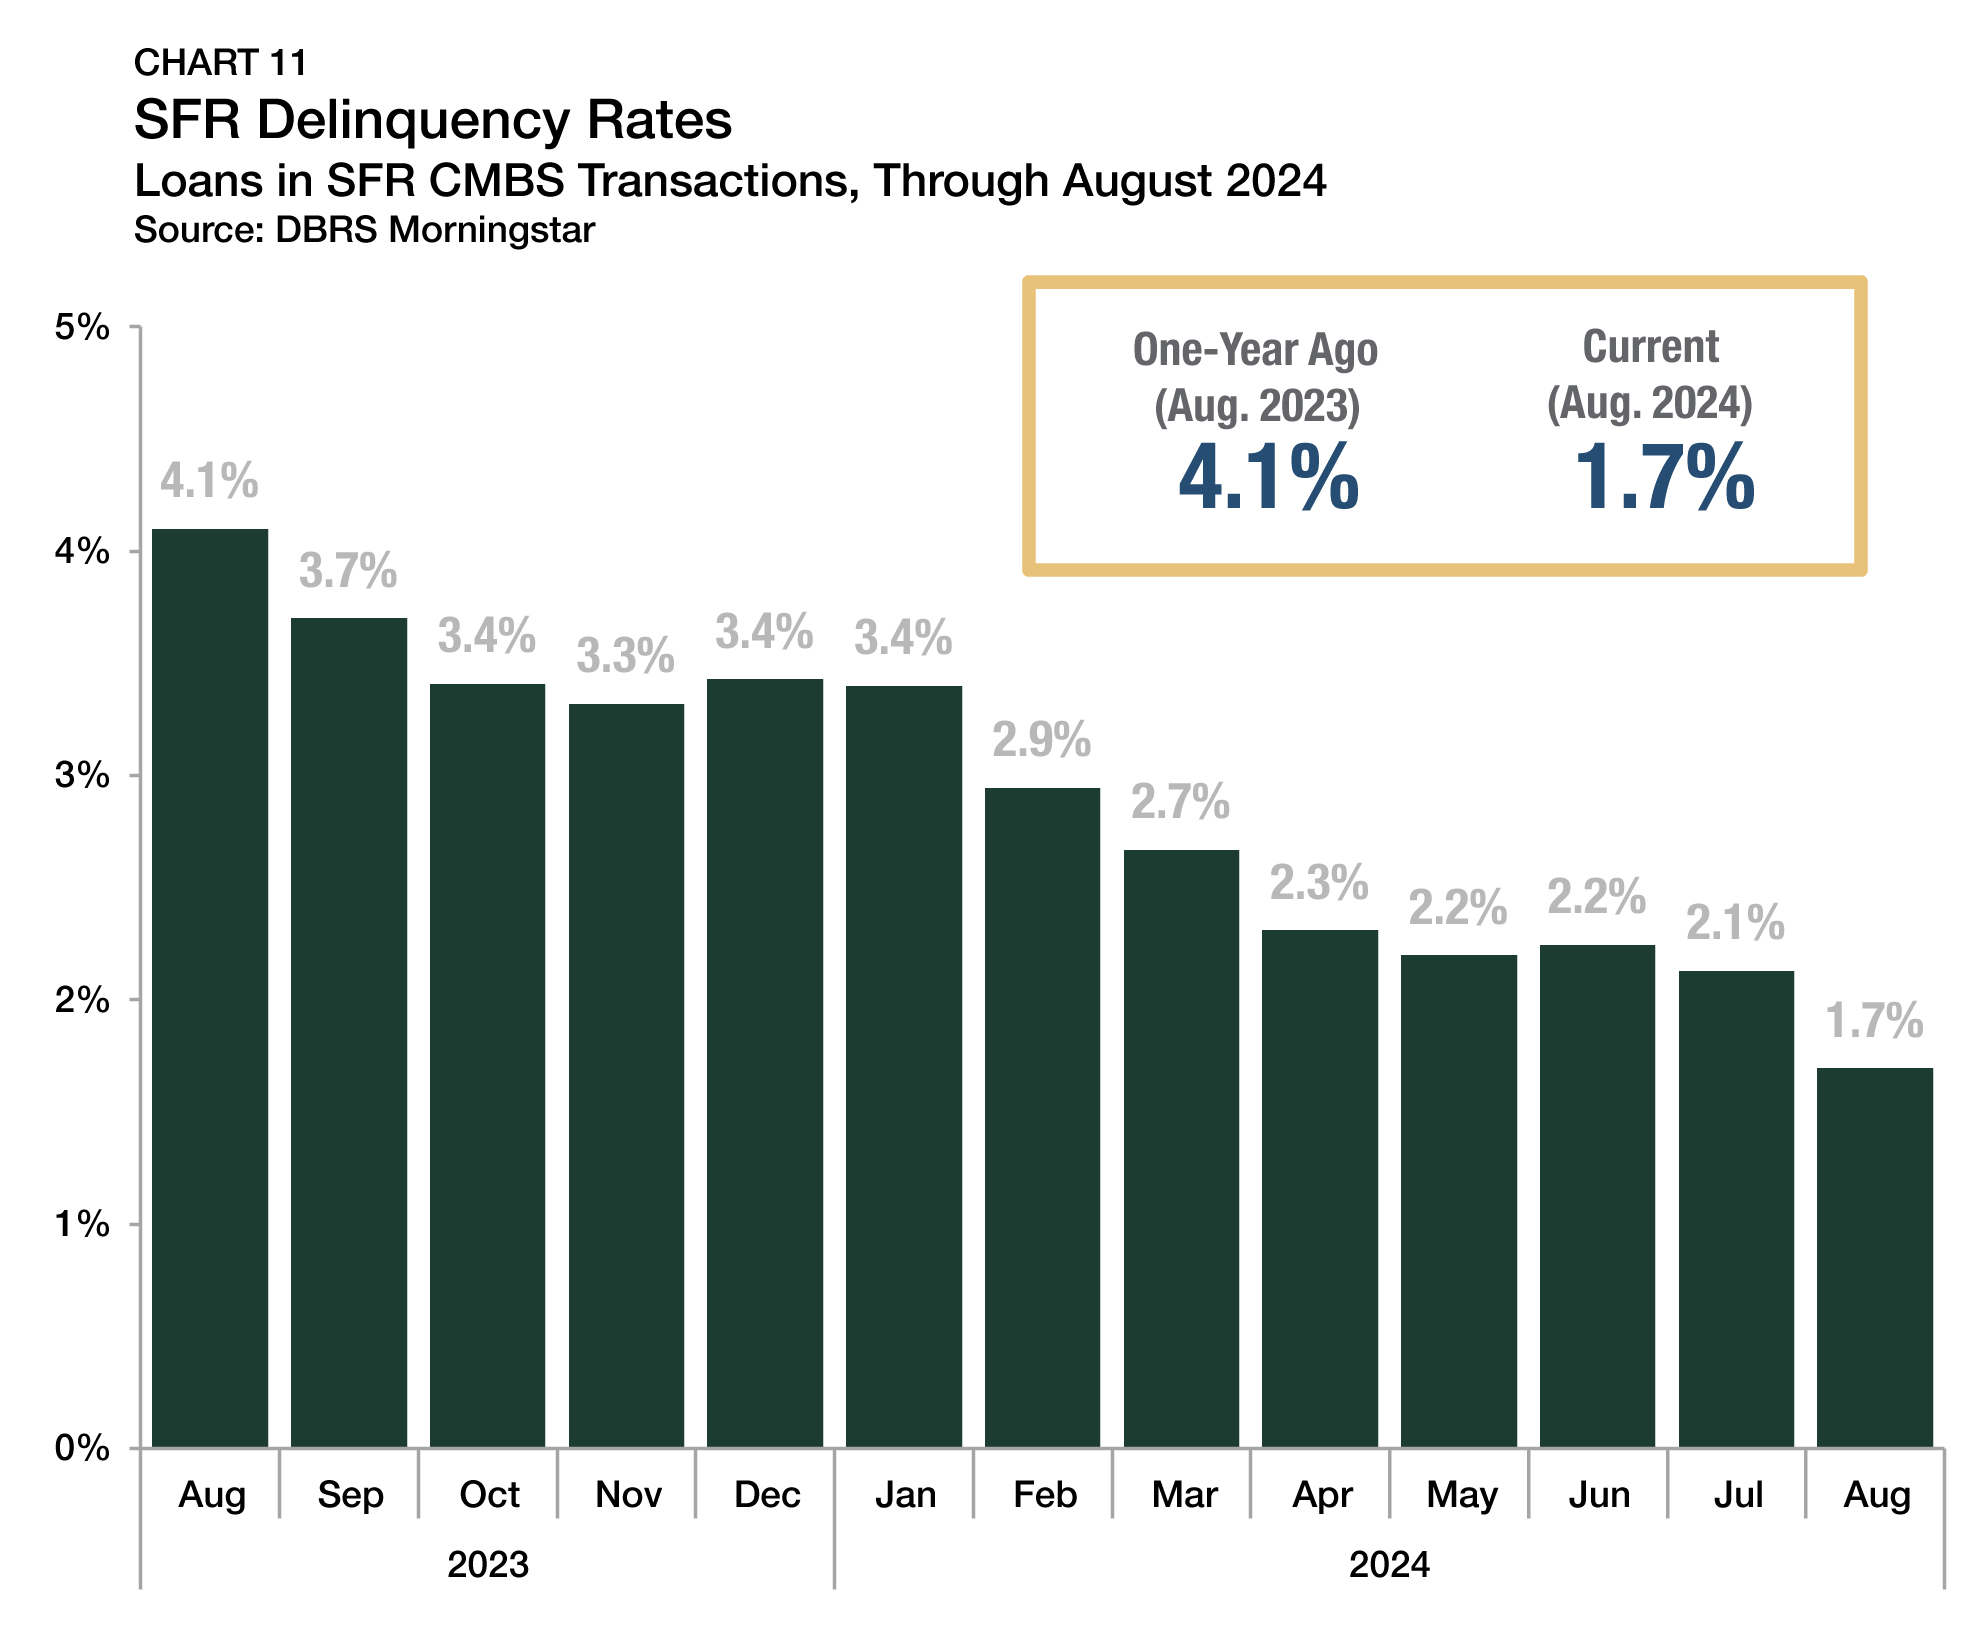
Within the SFR sector, evidence suggests that distress patterns mirror the broader single-family ecosystem, with delinquency rates remaining subdued. According to DBRS Morningstar, within rated SFR CMBS transactions, 1.7% of loans were delinquent in August 2024, a drop of more than half compared to one year earlier (Chart 11).
Supply & Demand Conditions
Build-to-Rent (BTR)
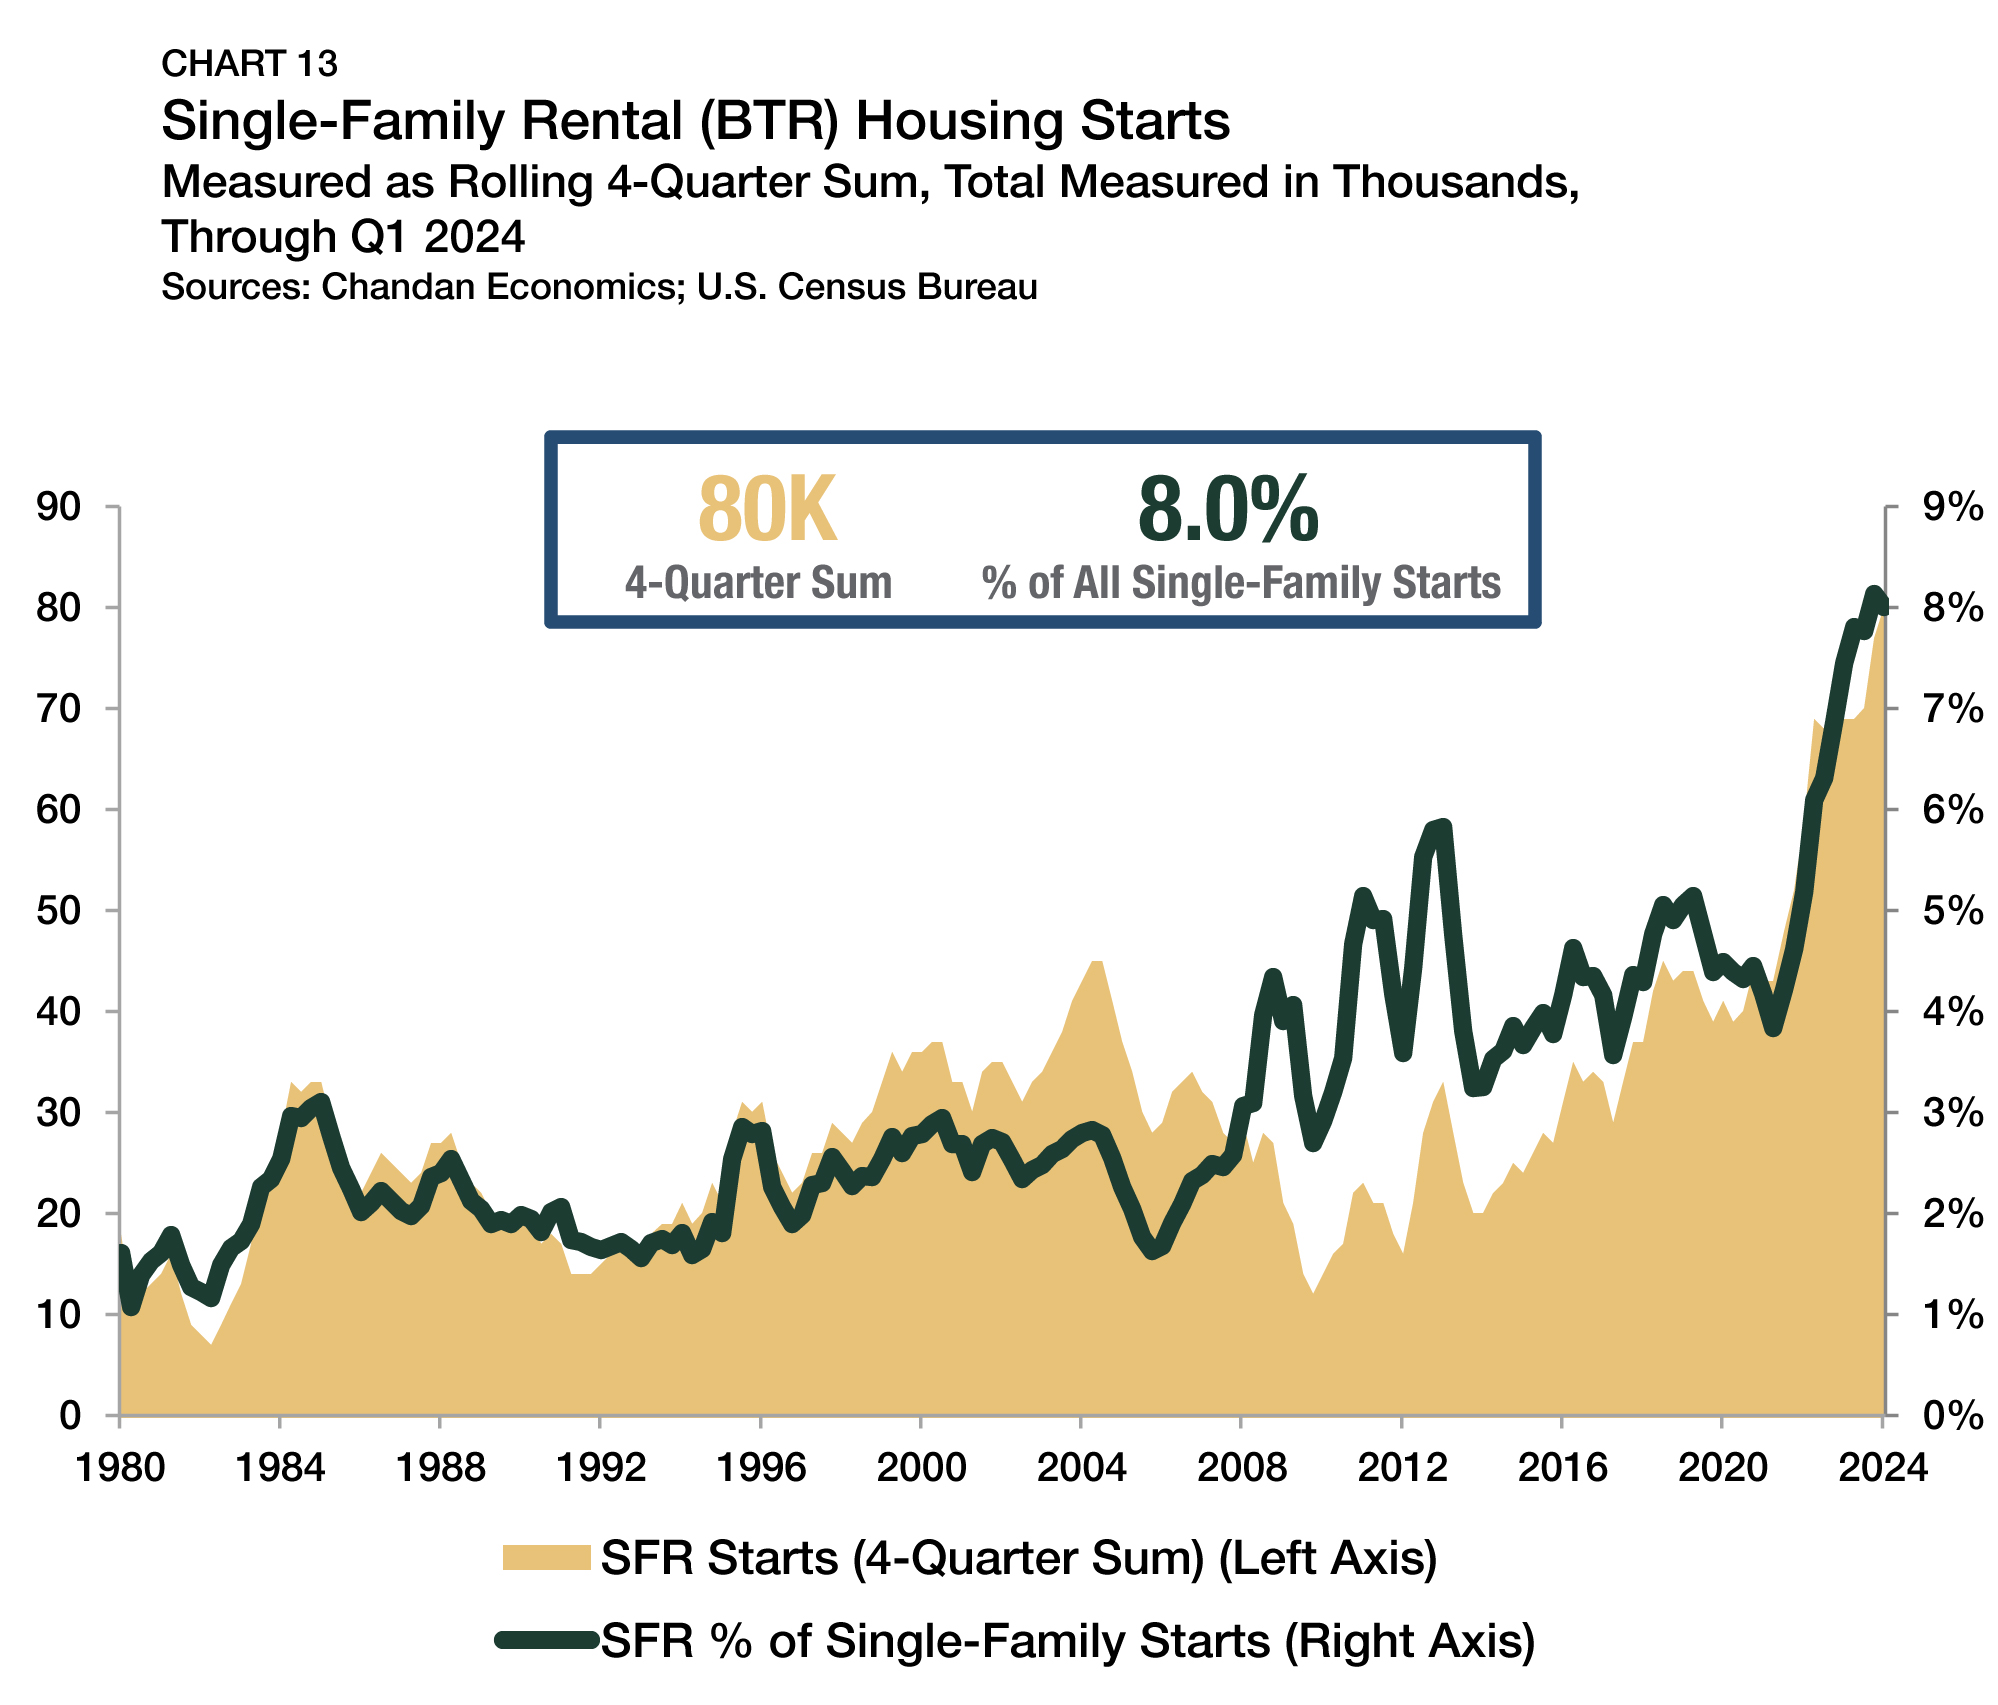
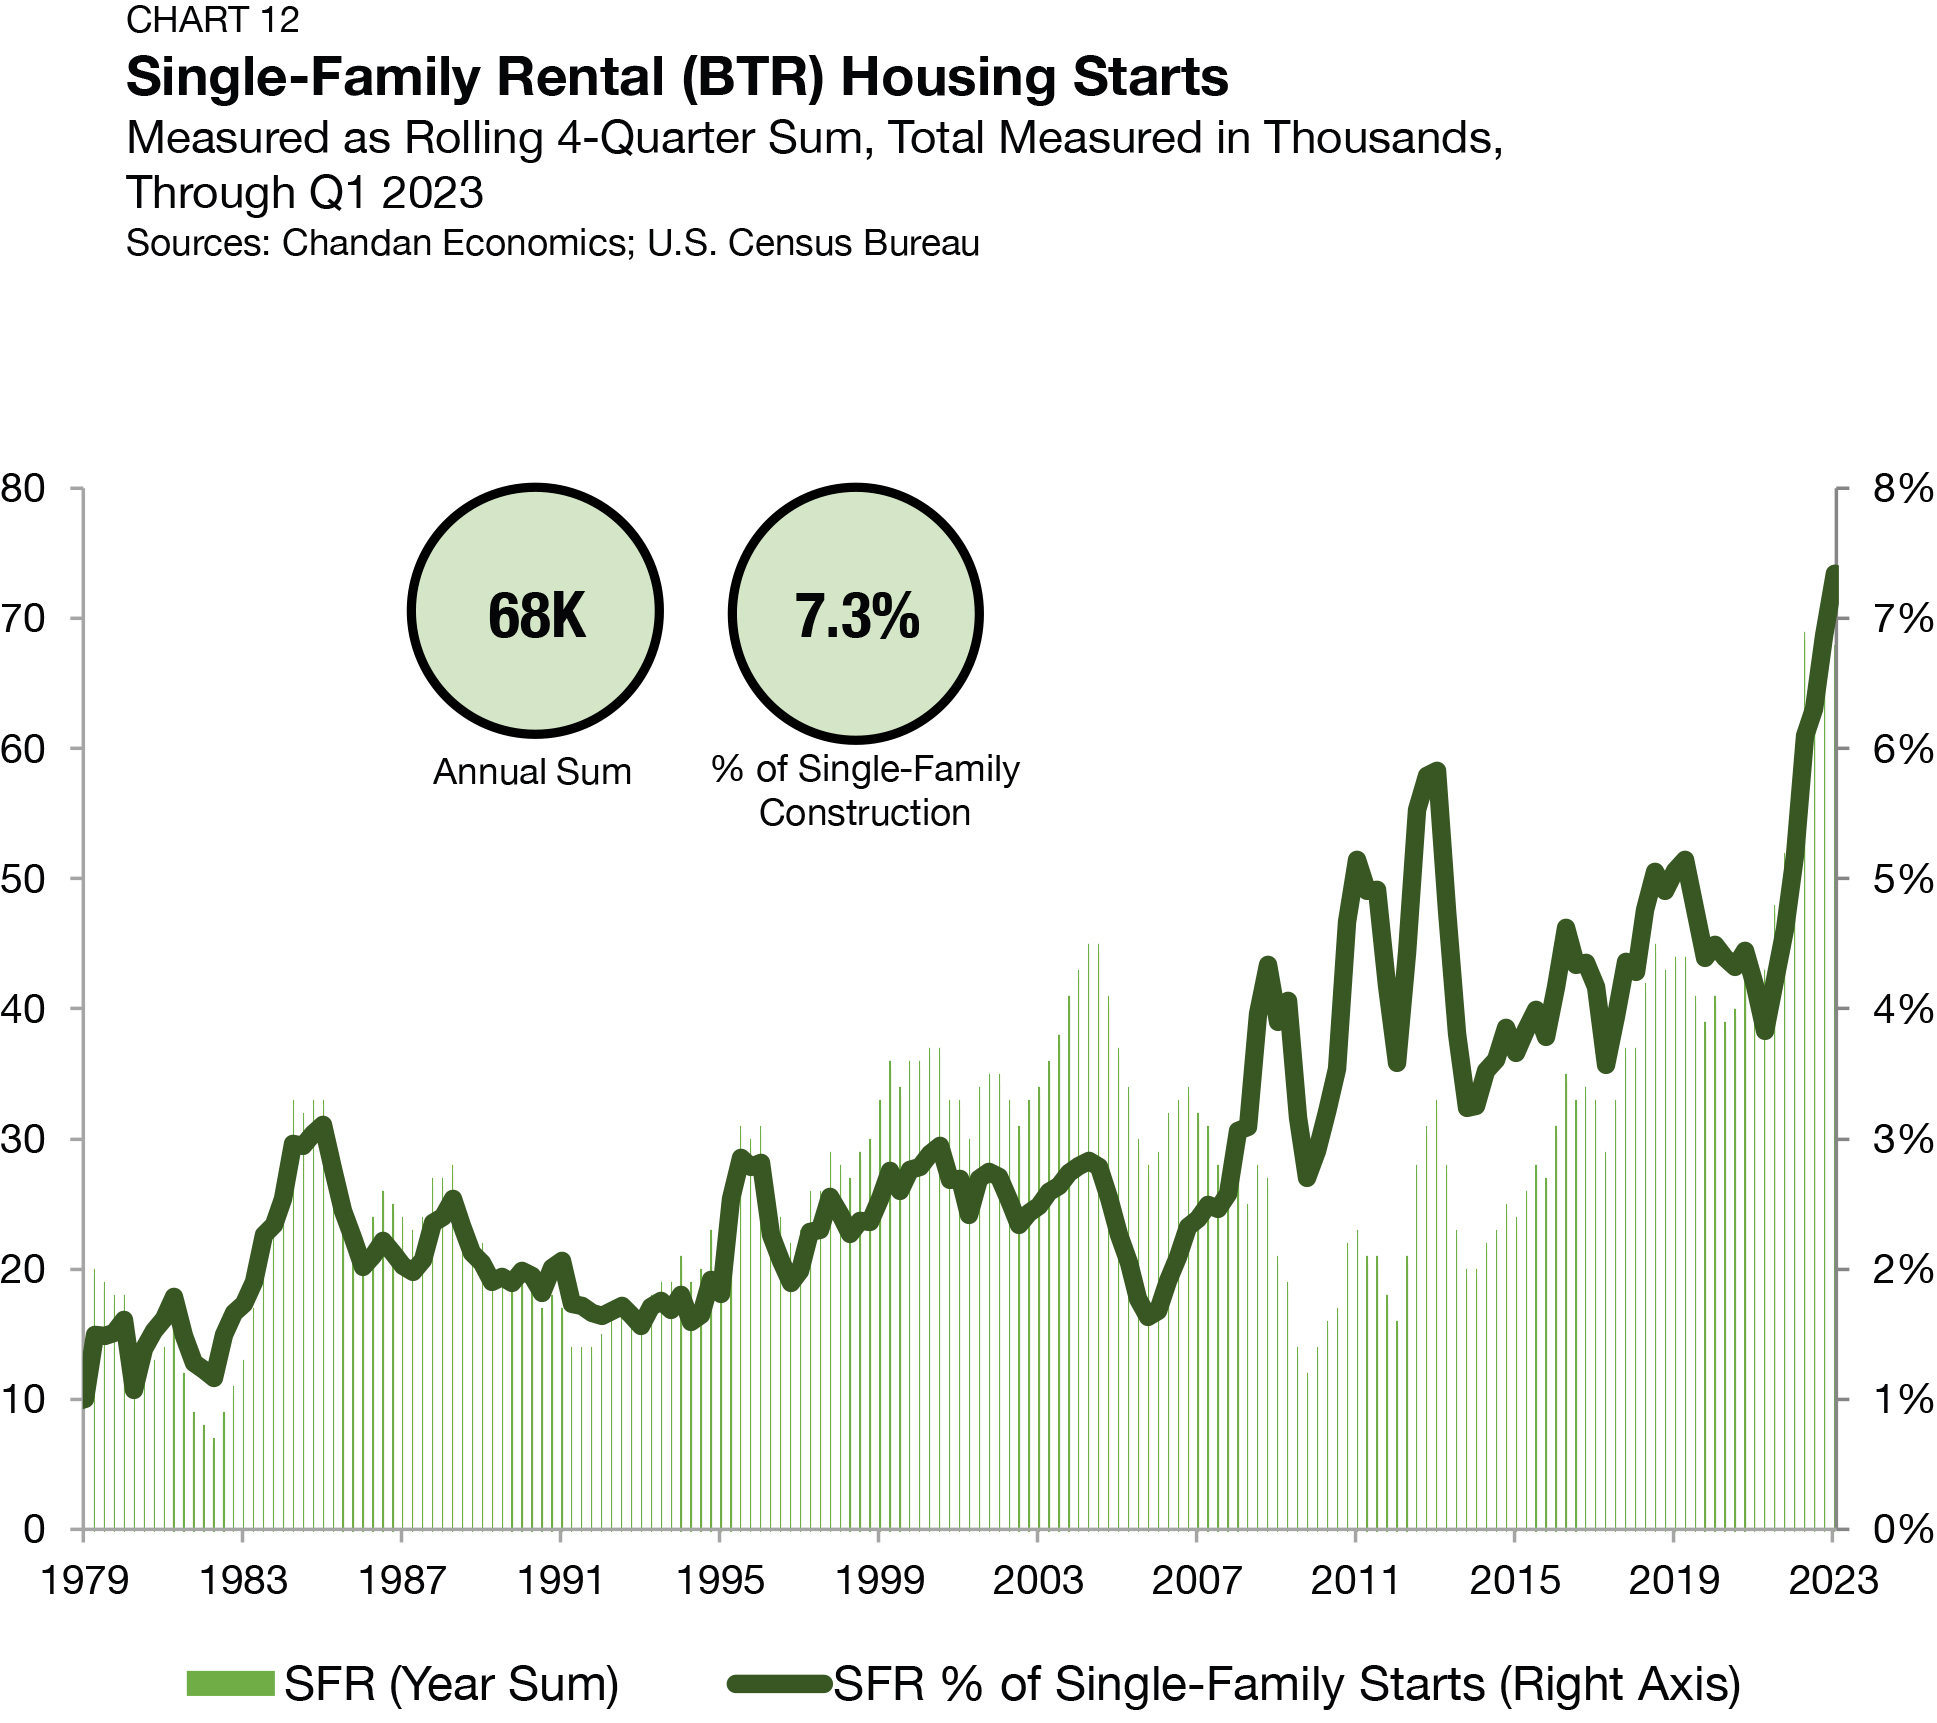
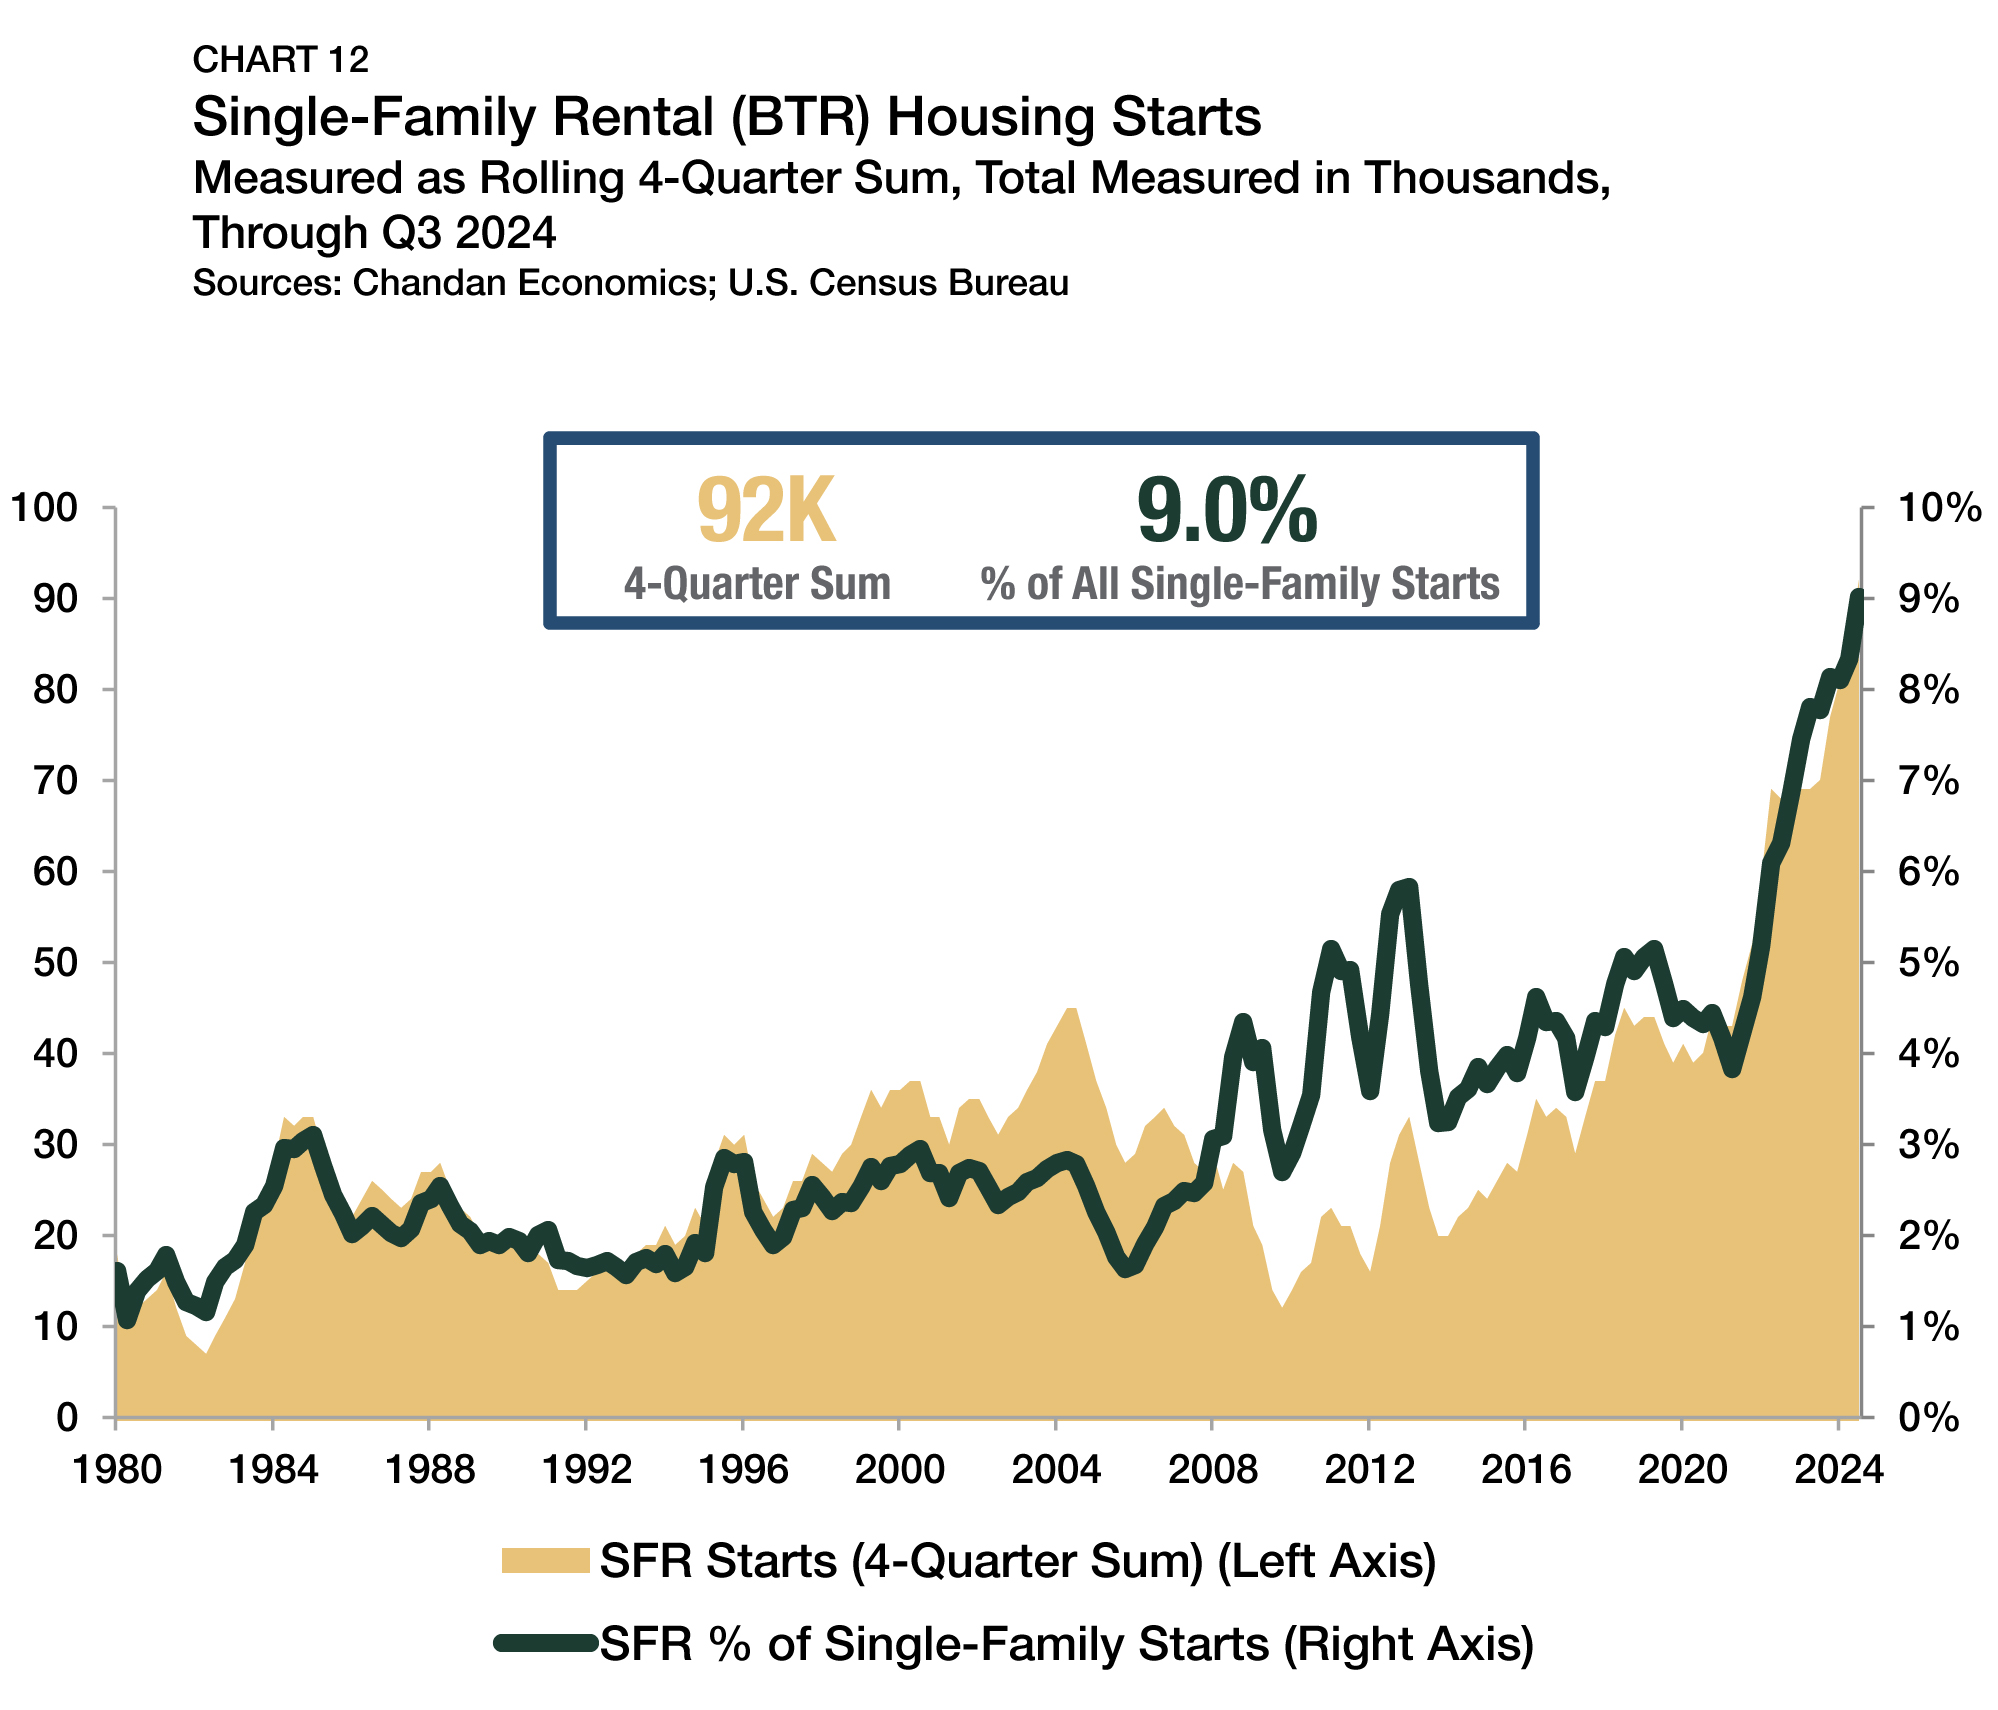
BTR communities have become a defining feature of the SFR sector, and through the third quarter of 2024, BTR development remained robust. Over the past 12 months, BTR accounted for 9.0% of all single-family construction starts, a new record high for the product type (Chart 12). For comparison, before the 2007-09 recession, the BTR share of single-family construction never eclipsed 3.1%. By unit count, 92,000 BTR construction starts were recorded in the 12 months that ended in the third quarter of 2024, another record high. Notably, the rolling annual sum was up by 20.3% compared to a year ago, further demonstrating the sustained nationwide surge in BTR development.
Outlook
While the Federal Reserve has begun monetary accommodation, long-dated yields, such as 10-year Treasury or 30-year mortgage rates, have not seen the type of downward pressure that markets anticipated just a few months earlier. Post-election day, the stated agendas of incoming leadership in the federal government have resulted in markets pricing in pro-growth policies that could translate into higher-for-long interest rates.
Despite ongoing volatility, SFR has demonstrated an ability to grow in all cycles. The ULI-PwC Emerging Trends in Real Estate 2025 report signals that real estate professionals are most bullish on SFR development prospects compared to other commercial property types, a testament to the sector’s structural health. On balance, while some challenges remain, the critical role that SFR plays in the U.S. housing market is poised to expand in 2025.
For more single-family rental research and insights, visit arbor.com/research
Disclaimer
This report is intended for general guidance and information purposes only. This report is under no circumstances intended to be used or considered as financial or investment advice, a recommendation or an offer to sell, or a solicitation of any offer to buy any securities or other form of financial asset. Please note that this is not an offer document. The report is not to be considered as investment research or an objective or independent explanation of the matters contained herein and is not prepared in accordance with the regulation regarding investment analysis. The material in the report is obtained from various sources per dating of the report. We have taken reasonable care to ensure that, and to the best of our knowledge, material information contained herein is in accordance with the facts and contains no omission likely to affect its understanding. That said, all content is provided herein “as is” and neither Arbor Realty Trust, Inc. or Chandan Economics, LLC (“the Companies”) nor their affiliated or related entities, nor any person involved in the creation, production and distribution of the content make any warranties, express or implied. The Companies do not make any representations or warranties, express or implied, as to the reliability, usefulness, completeness, accuracy, currency nor represent that use of any information provided herein would not infringe on other third-party rights. The Companies shall not be liable for any direct, indirect or consequential damages to the reader or a third party arising from the use of the information contained herein. There may have been changes in matters which affect the content contained herein and/or the Companies subsequent to the date of this report. Neither the issue nor delivery of this report shall under any circumstance create any implication that the information contained herein is correct as of any time subsequent to the date hereof or that the affairs of the Companies have not since changed. The Companies do not intend, and do not assume any obligation to update or correct the information included in this report. The contents of this report are not to be construed as legal, business, investment or tax advice. Each recipient should consult with its legal, business, investment and tax advisors as to legal, business, investment and tax advice. The information contained herein may be subject to changes without prior notice. This report is only intended for the recipients, and should not be copied or otherwise distributed, in whole or in part, to any other person.