Top Markets for Rental Asset Growth

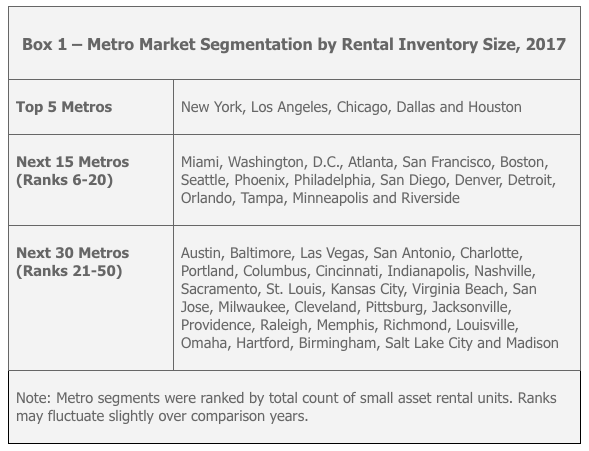
Building upon our two recent blogs on the state of the nation’s rental market for year-end 2017, we drill down further into asset class share changes within the top 50 metros in the context of market segment peers, as classified in Box 1 (see below), to determine the top markets for rental asset growth.
Overall, smaller metros registered impressive gains in both small and large multifamily as a share of total rental inventory for year-end 2017.¹
Smaller Metros Shift Toward Small Asset Multifamily
As shown below, exactly half of all the Top 50 metros saw rental inventory shift toward small asset multifamily in 2017. This includes three out of the Top 5 metros: Chicago, with 74 basis points (bps); Dallas (68 bps); and Houston (38 bps), according to the recently released U.S. Census Bureau 2017 American Community Survey.
(Please click around for detailed chart information)
Standout performers among the Next 15 metros included Orlando (270 bps), Detroit (174 bps), Riverside-San Bernardino (117 bps) and Miami (73 bps).
Share changes were significantly higher among the smaller markets (Next 30), with Omaha (477 bps), Virginia Beach (457 bps) and Madison (382 bps) topping this segment.
Large Multifamily Properties Take the Lead in New York
Turning to the large asset multifamily space, among the top markets that saw inventory share shifts toward properties of this nature (26 of the top 50), spreads were much tighter.
New York leads all other Top 5 metros, with large multifamily properties accounting for an additional 107 bps-share of total rental inventory over 2016 to 2017. Houston (49 bps) and Los Angeles (43 bps) follow behind among the Top 5 cities, as shown below.
(Please click around for detailed chart information)
The Next 15 group of metros experiencing share increases included Phoenix (173 bps), Minneapolis (166 bps) and Washington, D.C. (96 bps). Riverside-San Bernardino (85 bps) has recently emerged as a hot housing market, drawing demand from within the broader Los Angeles region.
Among the Next 30 cities, stellar performers included Nashville (333 bps), Salt Lake City (268 bps), Portland (213 bps) and Kansas City (169 bps).
Interestingly, only five of the 50 top markets experienced share increases in both the small asset and large asset multifamily space: Houston, Louisville, Pittsburg, Virginia Beach and Washington, D.C. This suggests that following the robust period of construction in recent years, there are ongoing absorption adjustments of multifamily inventory.
In further exploring these dynamics and building upon this state of the nation’s rental market snapshot update, upcoming blogs in this series will delve deeper into individual metro markets to highlight specific regional forces at play that are of interest to multifamily stakeholders.

1 All data is sourced from the American Community Survey (ACS), unless otherwise stated. ACS statistics are sample-based estimates of the compositional profile of the total population in the given year of data collection, and include a margin of error.

