COVID-19 Urban Recovery: Walking, Driving and Taking Mass Transit
- Personal mobility data serves as a measure of COVID-19 urban recovery.
- Madison, Wisconsin ranks as the most improved metro for walking and driving.
- The San Francisco Bay Area ranks as the least recovered metro, using mobility criteria.
Cities across the U.S. are attempting to balance economic activity against coronavirus transmission risks. While the goals remain uniform, the levels of success are not. This article analyzes personal mobility data provided by Apple Maps. Data was gathered for driving, transit, and walking trips, between mid-January and late-August. While the numbers are not a perfect proxy for economic activity, they provide a gauge of COVID-19 urban recovery, reflecting where life most and least resembles pre-pandemic levels of normality.
Driving
Across the top 50 U.S. cities for car trips, the Bay Area of San Francisco and Oakland are currently seeing the greatest reduction in driving trips compared to their pre-pandemic norms.
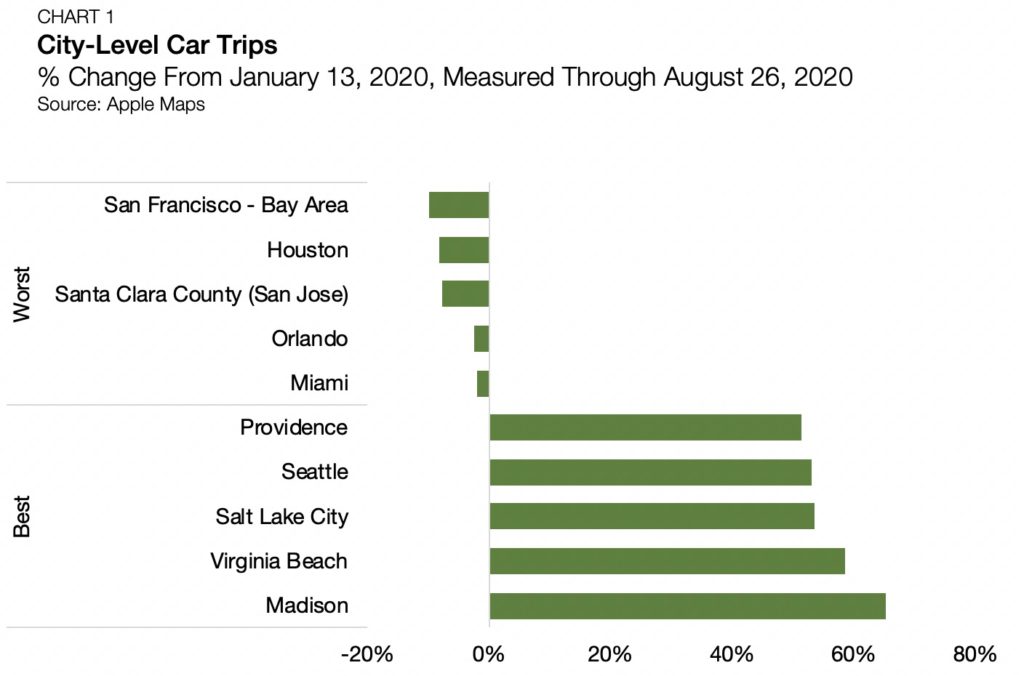
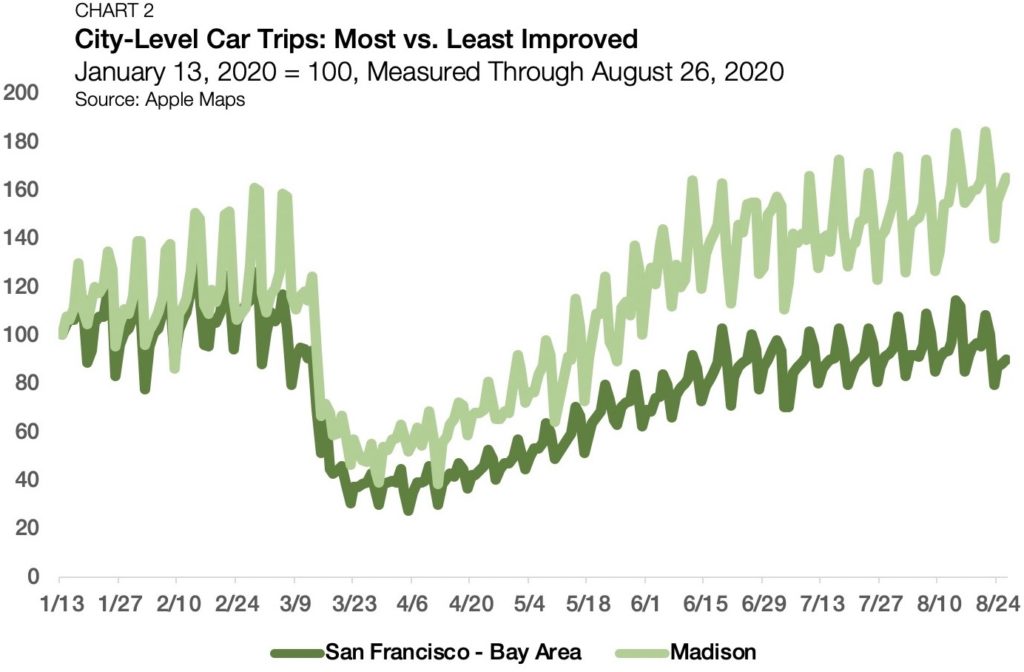
The Bay Area’s lackluster performance is constant through the various mobility factors evaluated. As of August 26, driving trips were down from their January benchmark by 10.0%. While levels remain well below normal, they are improving. Early April driving trips in the Bay Area fell as low as 72.4% below their January reference point. It is important to note that the wildfires in California would require further consideration in evaluating trends based on mobility data subsequent to this analysis.
On the other side of the spectrum, Madison, Wisconsin enjoys the highest relative level of driving trips compared to pre-coronavirus levels. After falling to similarly low depths in April, dropping by 61.8%, Madison’s driving levels are now up by 65.1% from January, leading the nation in its percentage increase.
Public Transit
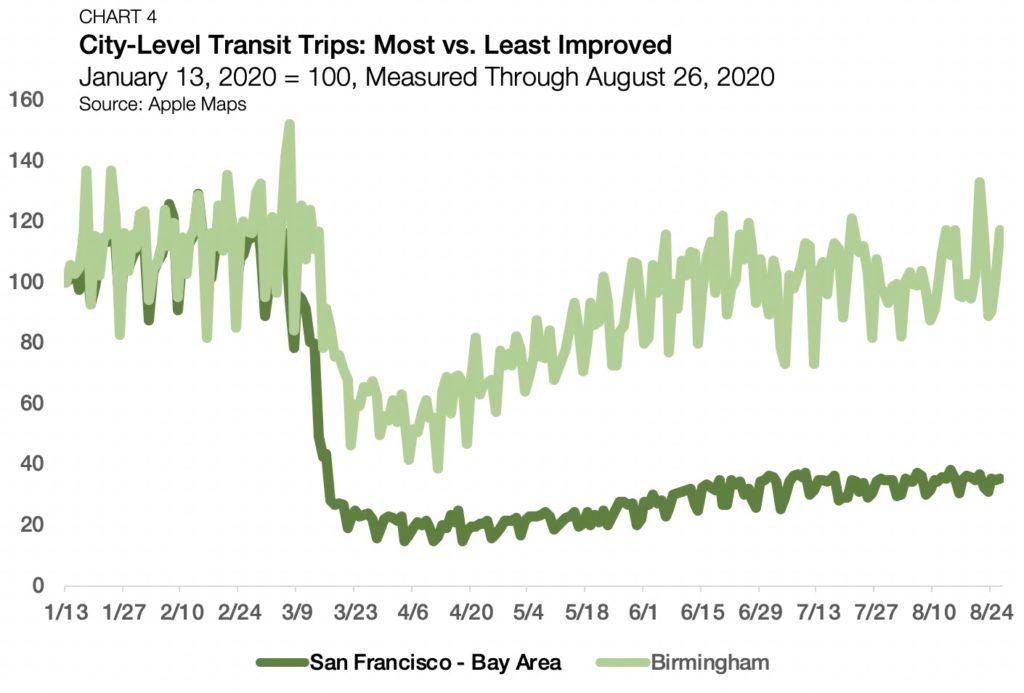
Turning now from car keys to metro turnstiles, San Francisco again lands on the list as America’s least recovered city. Transit trips sit 64.9% below usage level prior to the coronavirus outbreak and reflect only a 20.3% recovery over the April lows.
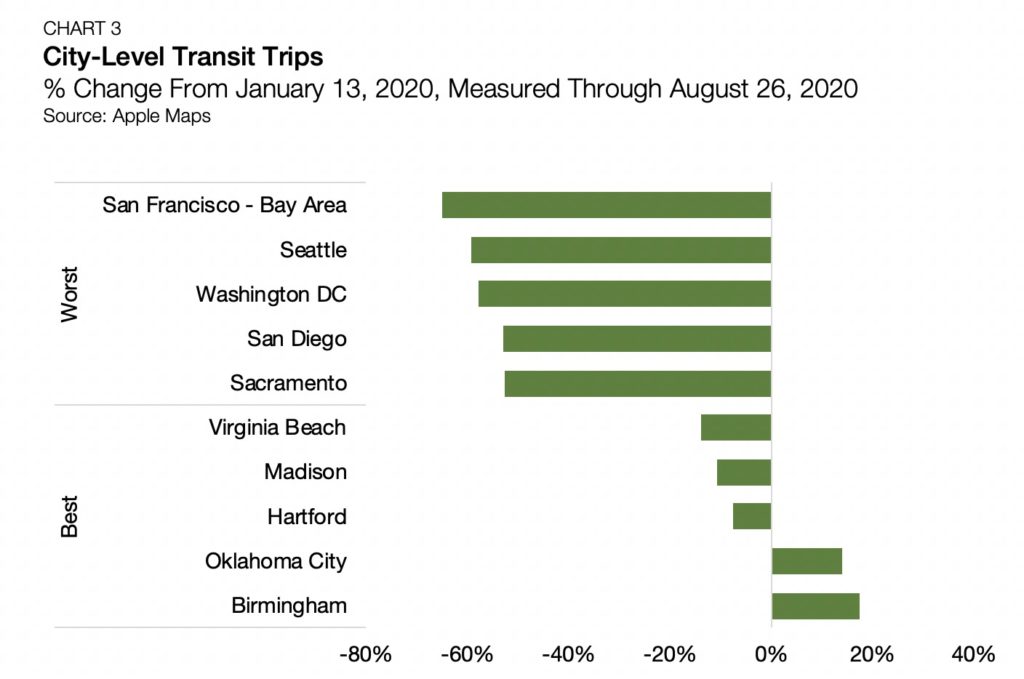
San Diego and Sacramento similarly rank near the bottom of the transit usage improvement list. This reflects how the Bay Area’s struggles are part of California’s broader battle against the virus. Birmingham, Alabama, and a set of similarly sized secondary metros rest at the other end of the spectrum.
Compared to the January benchmark, levels of transit usage in Birmingham are up 17.4%. All of the best performing metros in this category share the feature of lacking a public rail system.
Walking
Finally, San Francisco maintains its consistency and registers the lowest number of walking trips compared to January levels, sitting 35.8% below the benchmark.
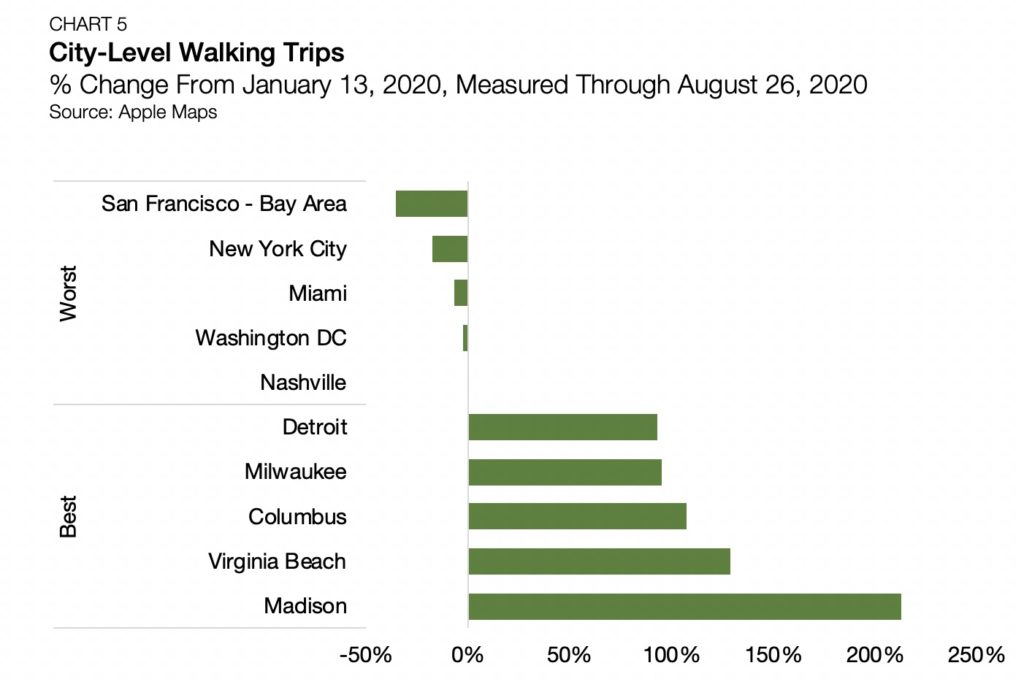
It is worth again noting that this data measured through late-August does not reflect California’s tragic ongoing wildfires. Topped once again by Madison, Wisconsin, Midwestern cities show the most improvement in this category. The region’s harsh winters offer a partial explanation, contributing to the Midwest’s summertime outperformance. In Madison alone, walking trips are up 212.7% from January.
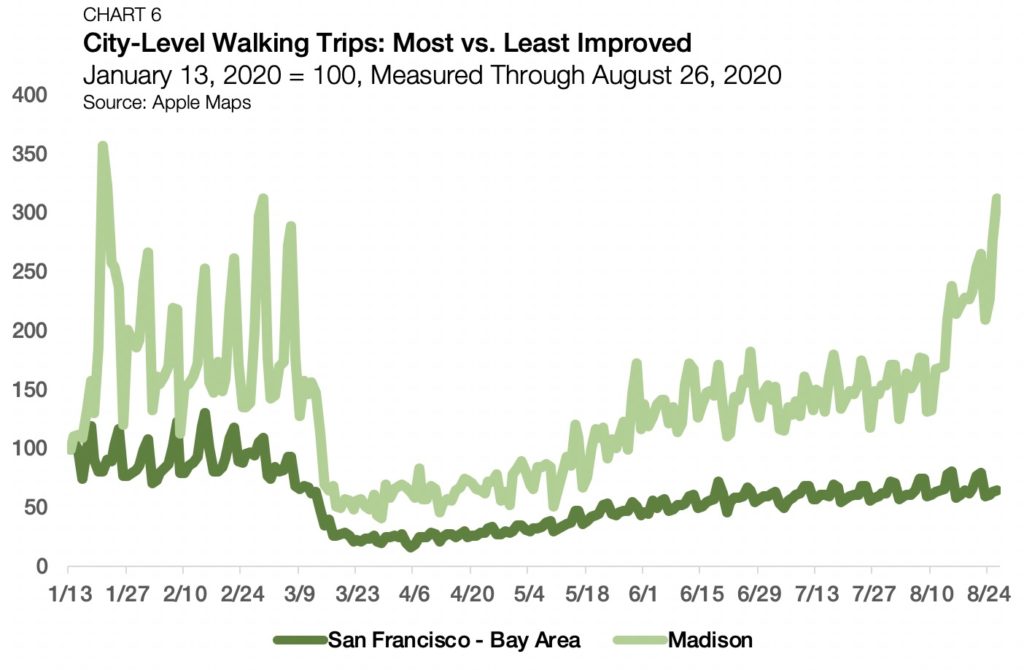
Looking ahead, following these mobility trends will continue to be among the key ways to quantify how quickly the country is returning to normal. When taken together, the data shows returning to normal appears more of a discussion for specific metro locations, than one of collective national progress.

