Small Asset Multifamily Activity Shifts Toward Smaller Metros

Rental inventory growth for year-end 2017 showed a clear contrast between the largest and smallest U.S. metros, with the latter displaying a greater increase in small asset multifamily inventory.¹
Small Buildings Formed the Backbone across Rental Markets
In our recent blog, we noted that the U.S. small apartment inventory saw a reversal in consolidation in 2017. On the other hand, large apartment inventory growth, while still positive, experienced a slowdown over the same period.
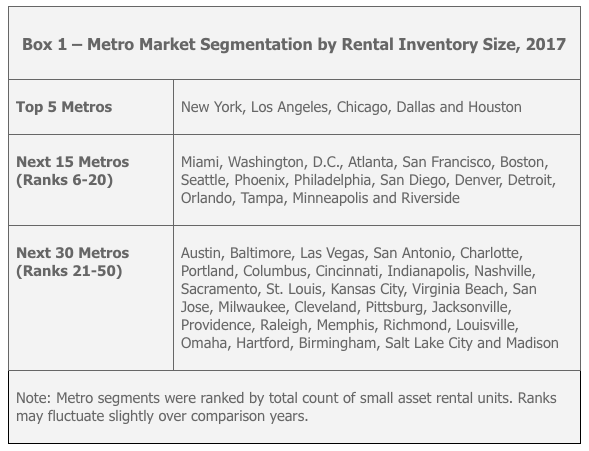
Given the relative concentrations of these asset classes across the nation’s landscape of diverse urban centers, trends in rental inventory growth are nuanced. Utilizing the latest U.S. Census Bureau 2017 American Community Survey data, we grouped the top 50 U.S. metros into three metro segments based on the size of their small asset rental inventory base. The three groups are the Top 5, Next 15 and Next 30 metros, as shown in Box 1 (see box below).
As depicted below, multifamily rentals comprised about 60% of all occupied units in the Top 5 metros, which was 8 percentage points higher than the Next 15 metros and 15 percentage points higher than the Next 30.
(Please click around for detailed chart information)
While the share of large asset multifamily as a percent of total rental inventory declined sharply from 22% in the Top 5 markets to only 11% in Next 30 markets, the share of small asset multifamily units stayed within a narrow band: 34% to 38% across market segments.
On the flip-side, single-family rentals were more prevalent in the Next 30 group, where they accounted for 37% of rental inventory, compared to only 21% in the Top 5 markets.
The Next 15 metros had a relatively more diverse rental base, with single-family rentals and small asset multifamily together forming a 70% share of all rental options.
Small Asset Growth Strongest in Smaller Metros
The year-end 2017 Census update also revealed that while large asset multifamily unit shares increased across all metro segments, the magnitude of this shift was greatest in the Top 5 metros.
As shown below, the share of large asset multifamily units increased by 57 basis points (bps) from 2016 to 2017 in the Top 5 markets, compared to only 38 bps in the smallest markets (the Next 30 group). Meanwhile, small asset unit share growth was near zero in the Top 5, increasing to 15 bps in the Next 15 and doubling to 30 bps in the Next 30.
(Please click around for detailed chart information)
For small asset multifamily stakeholders, this data supports the notion that both fundamentals and growth activity are improving, and opportunities are expanding for small apartment properties in the nation’s smaller metropolitan markets.

1 All data is sourced from the American Community Survey (ACS), unless otherwise stated. ACS statistics are sample-based estimates of the compositional profile of the total population in the given year of data collection, and include a margin of error.

