Small Multifamily Investment Trends Report Q2 2024
Valuations and Cap Rates Stabilize as Fundamentals Support Growth
Key Findings
- Small multifamily valuations held steady over the last quarter.
- Cap rates fell for the first time in nearly two years, sliding 5 bps.
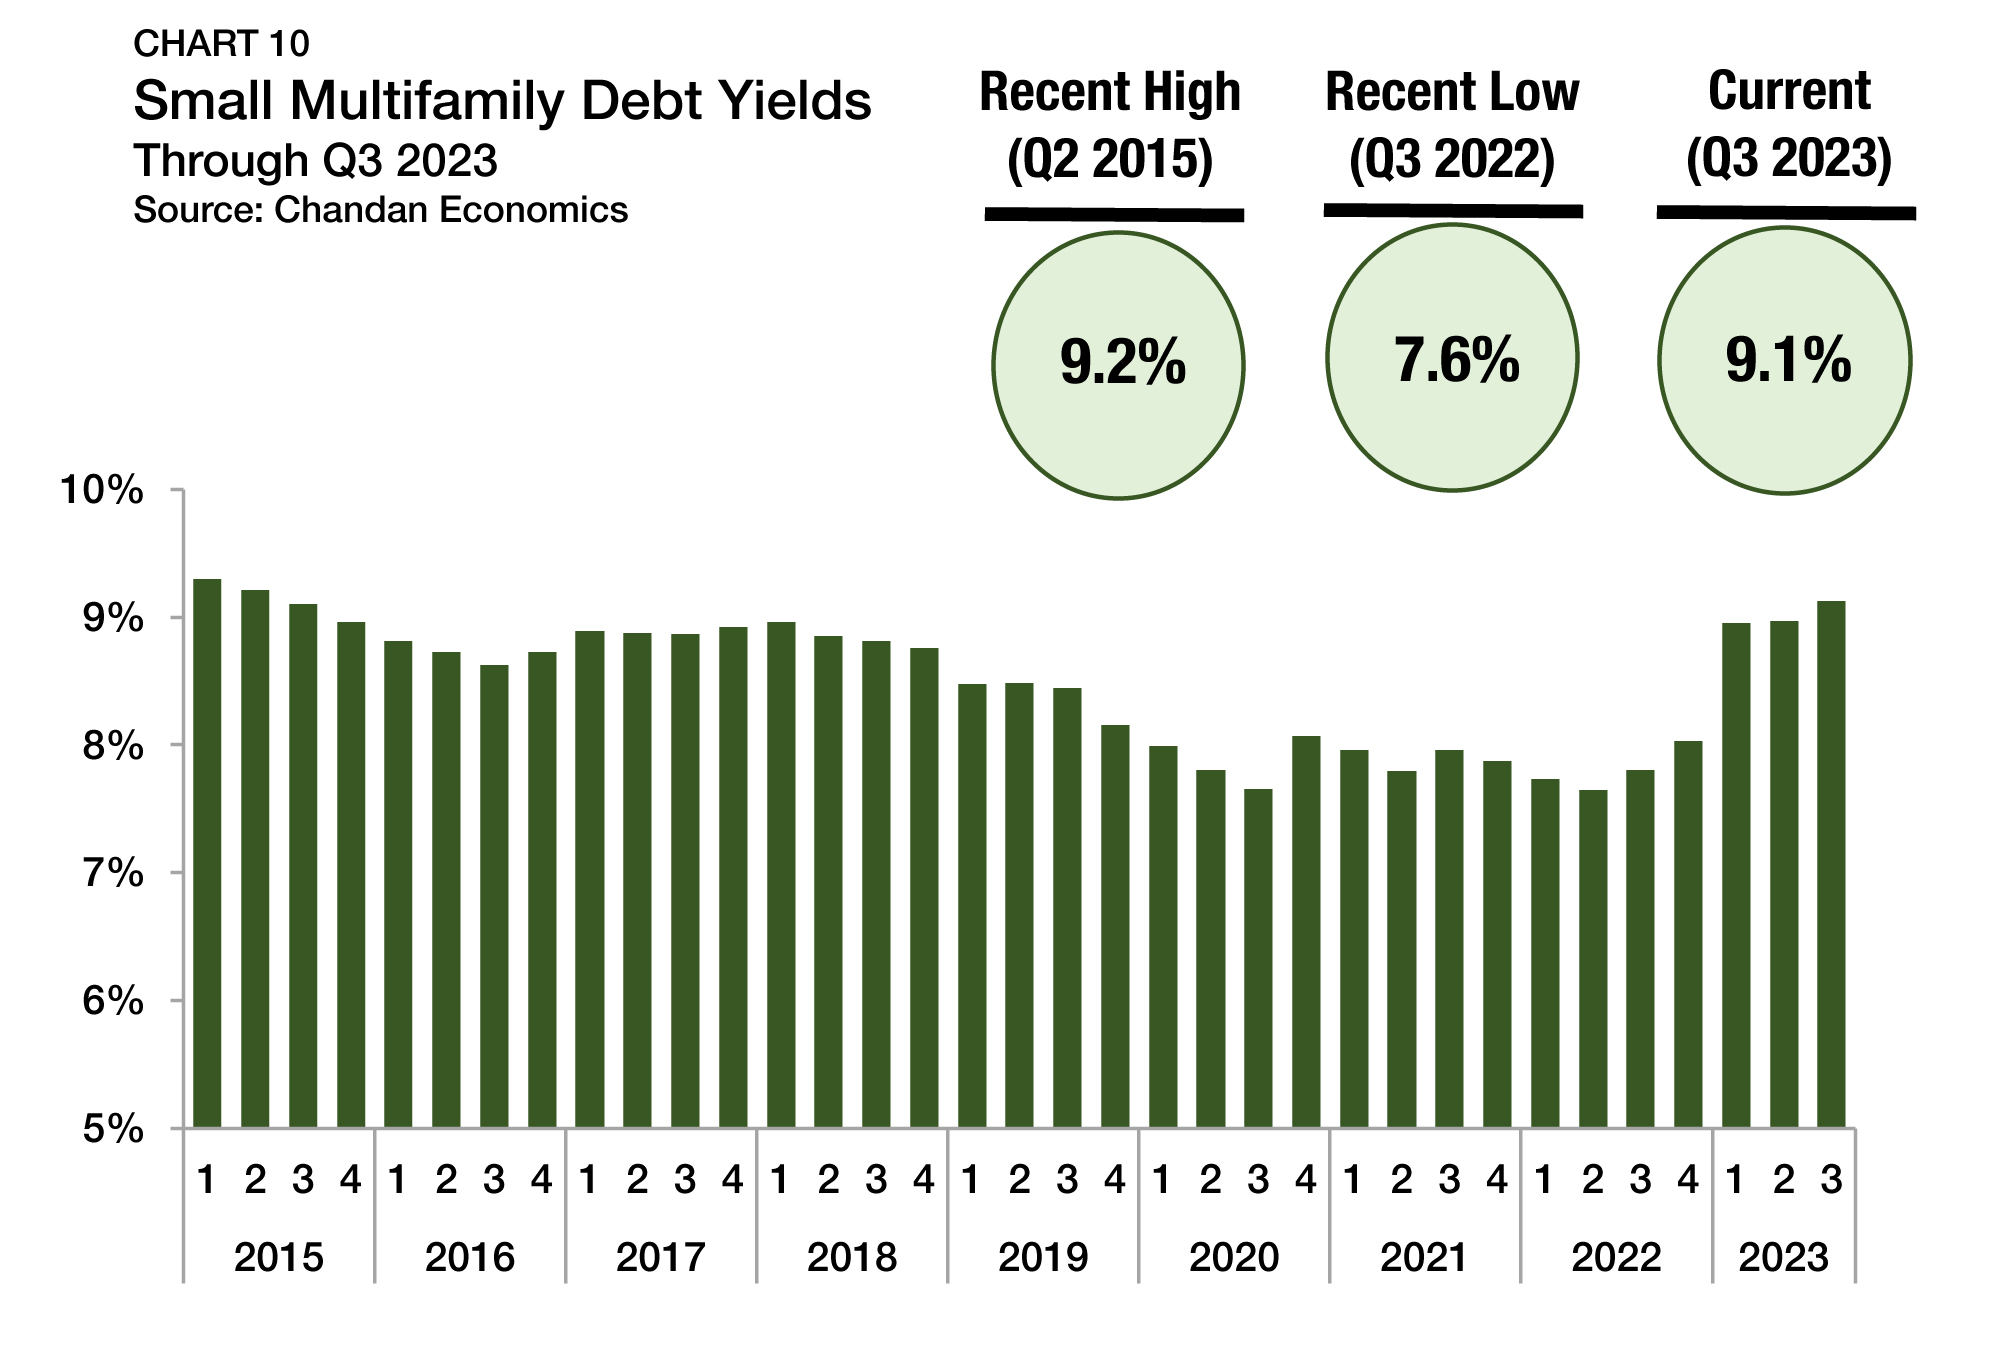
- Credit conditions remain conservative as debt yields rose to 9.5%.
State of the Market
In the first quarter of 2024, the small multifamily subsector continued to fall in line with pre-pandemic norms, resuming patterns frequently seen before the historic multifamily boom years of 2021 and 2022.
Across the multifamily real estate sector, distress has remained limited. According to Trepp, the delinquency rate of multifamily loans in CMBS transactions was 1.8% at the end of the first quarter of 2024, down from 2.6% at the end of the previous quarter. Trends found in small multifamily properties tell a similar story. According to Freddie Mac, 97.8% of its small balance multifamily loans were either current or less than 60 days delinquent through February 2024. There may also be light at the end of the tunnel for asset pricing. Compared to last year, cap rates are higher, and valuations sit lower. However, when measured against the previous quarter, both metrics show improvement, with cap rates falling slightly and asset prices holding steady.
In the quarters ahead, small multifamily is likely to see steady improvement. Lending standards remain conservative, and the market consensus that there will be six rate cuts in 2024 has faded. Although many anticipate more hawkish monetary policy in the months ahead, multifamily’s structural strength has historically helped it withstand heavy headwinds. When the Federal Reserve cuts interest rates, multifamily investment activity is likely
to see a bounce.
Lending Volume
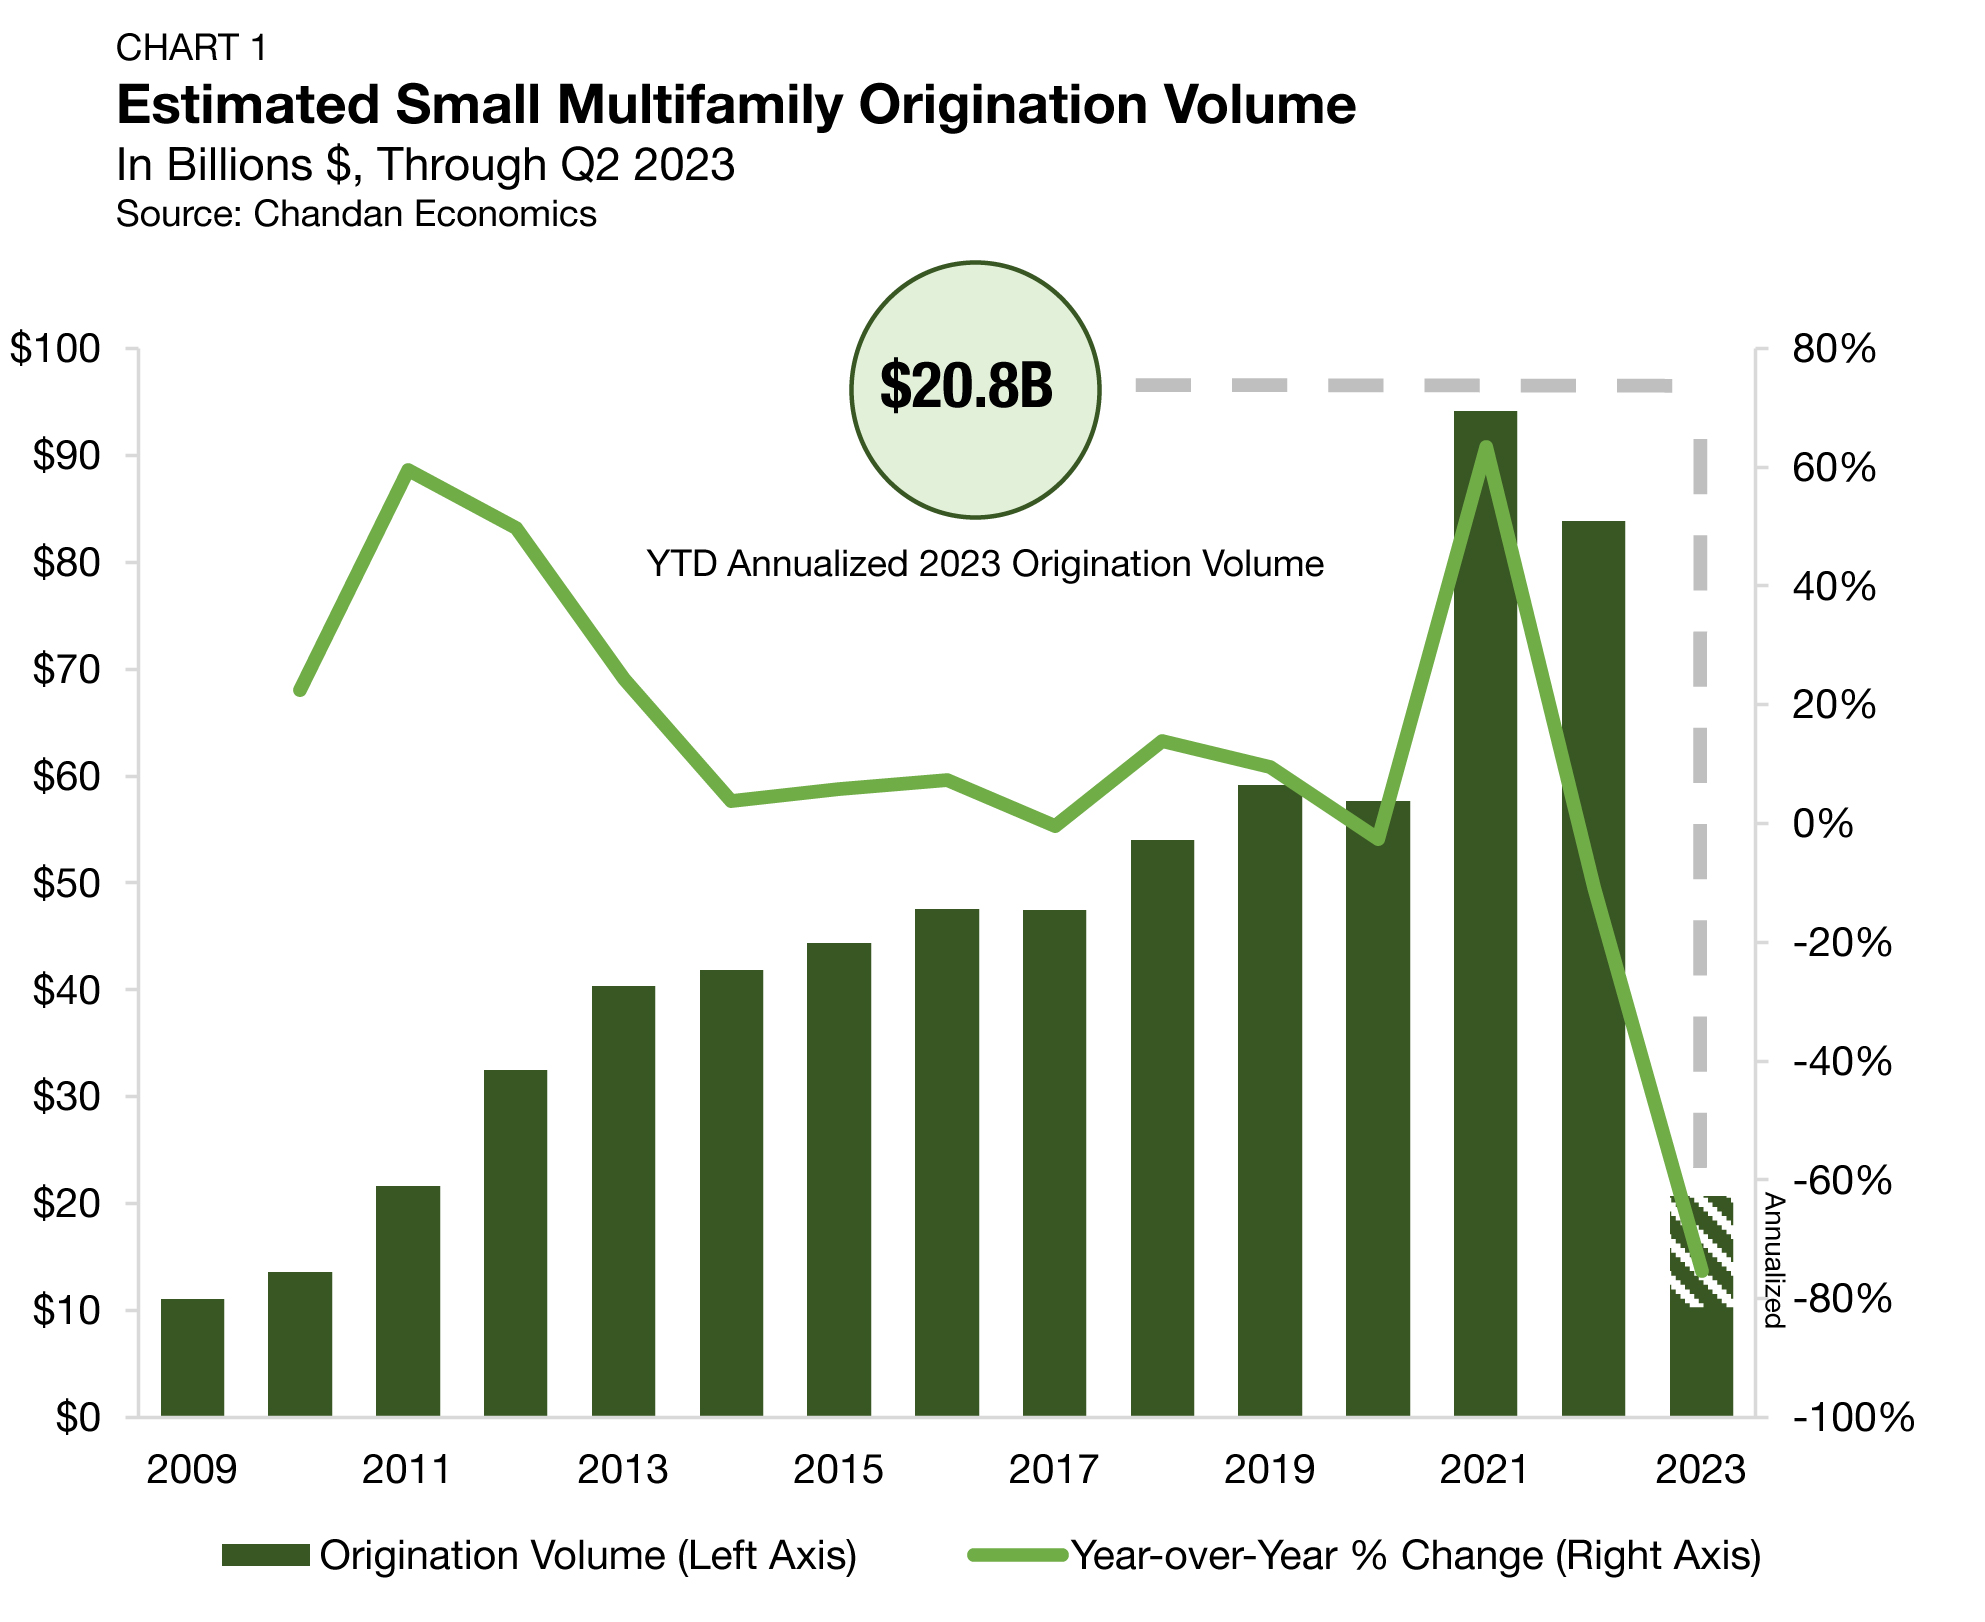
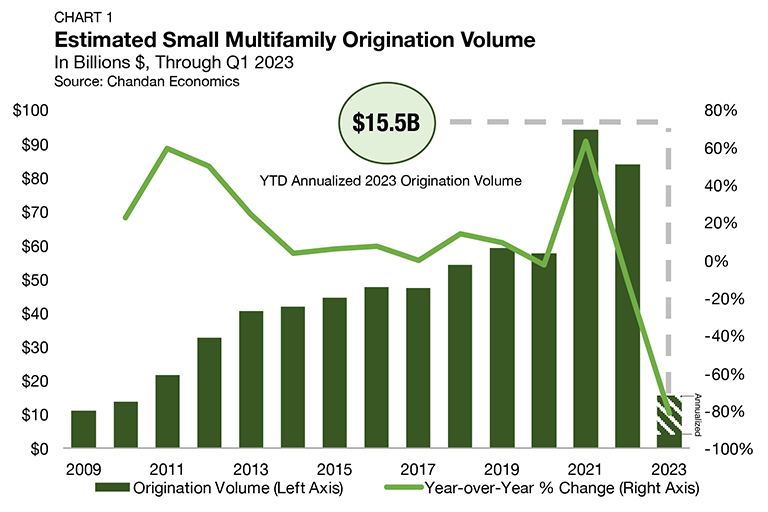
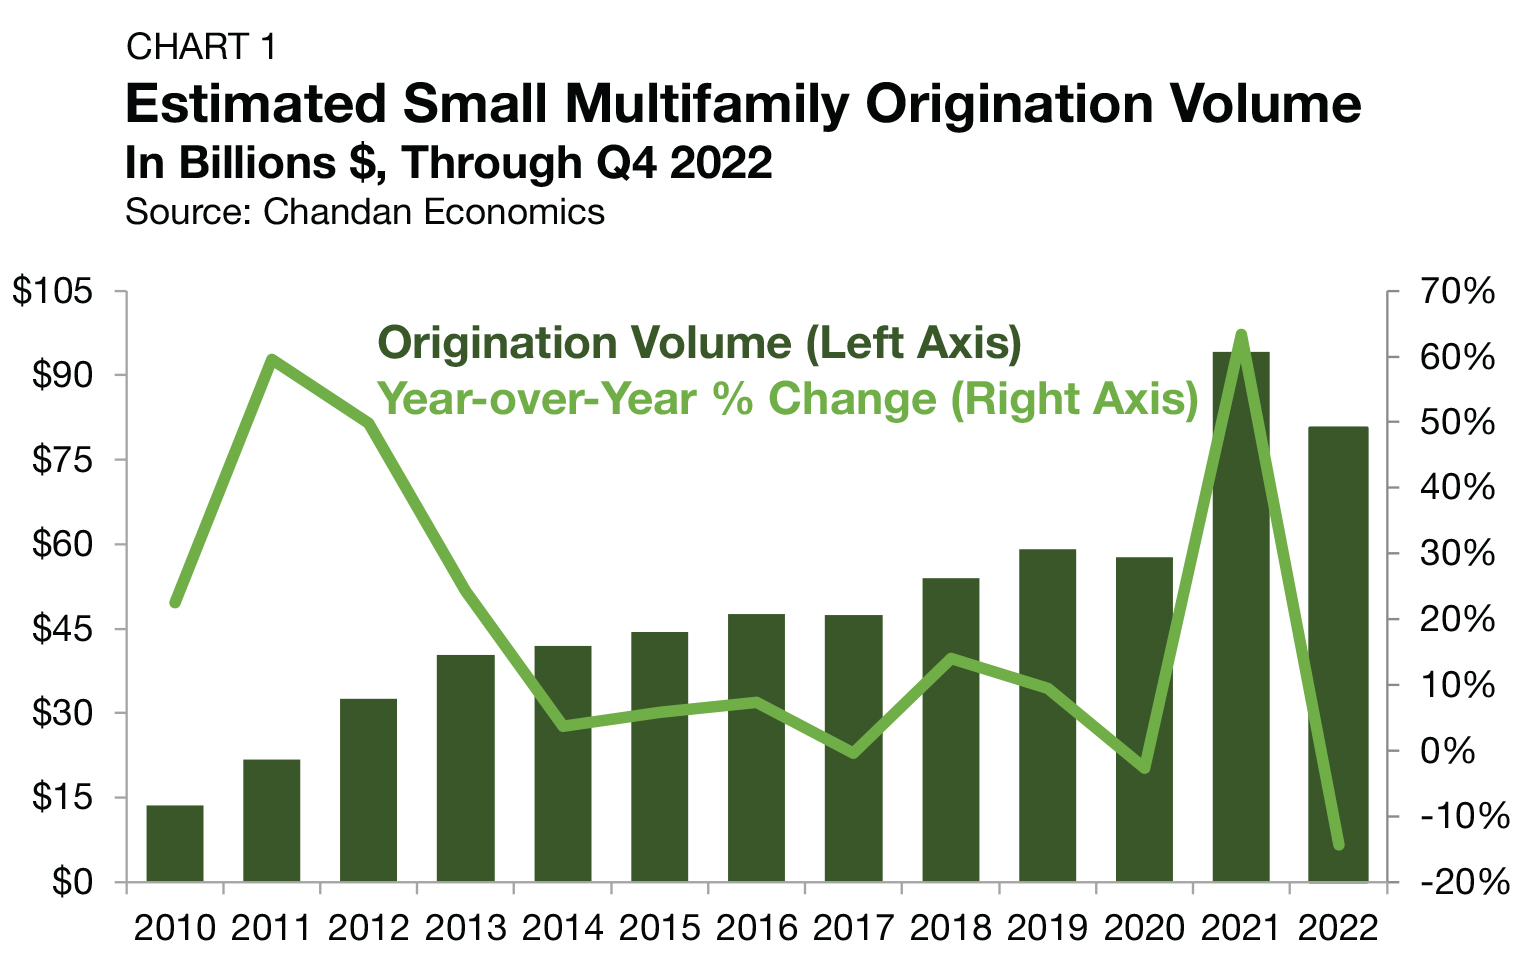
Elevated interest rates continued to impact small multifamily lending volume in the first quarter of 2024, as compared with the highs of recent years. The $44.4 billion year-end 2023 estimate of new multifamily lending volume on loans with original balances between $1 million and $9 million1 — including loans for apartment building sales and refinancing — represented a significant deceleration from the record-breaking 2022 total of $90.1 billion (Chart 1).
Thus far in 2024, a rapid bounce back does not appear in the cards — but neither does a further pullback. Through the year’s first quarter, small multifamily originations are on pace to hit $44.7 billion in 2024, a slight increase of 0.6% over last year.

Sustained high interest rates are the primary factor weighing down origination volumes, and they impact the market in several ways.
First, it widens the bid-ask spread (the difference between what a buyer is willing to pay and what a seller is willing to accept). Amid higher capital costs, potential buyers are seeking larger discounts. At the same time, a lack of multifamily sector distress has meant fewer owners have been motivated to sell if they do not receive an offer that meets their perception of fair value. Further, according to Yardi Matrix, loan extensions have been a common feature of the current lending environment, simultaneously suppressing new originations and distress.
Altogether, lower transaction activity, more frequent loan extensions, and reduced incentives for refinancings have all contributed to decreased origination volumes through 2023 and into early 2024.
1 All data, unless otherwise stated, are based on Chandan Economics’ analysis of a limited pool of loans with original balances of $1 million to $9.0 million and loan-to-value ratios above 50%.
Loans by Purpose
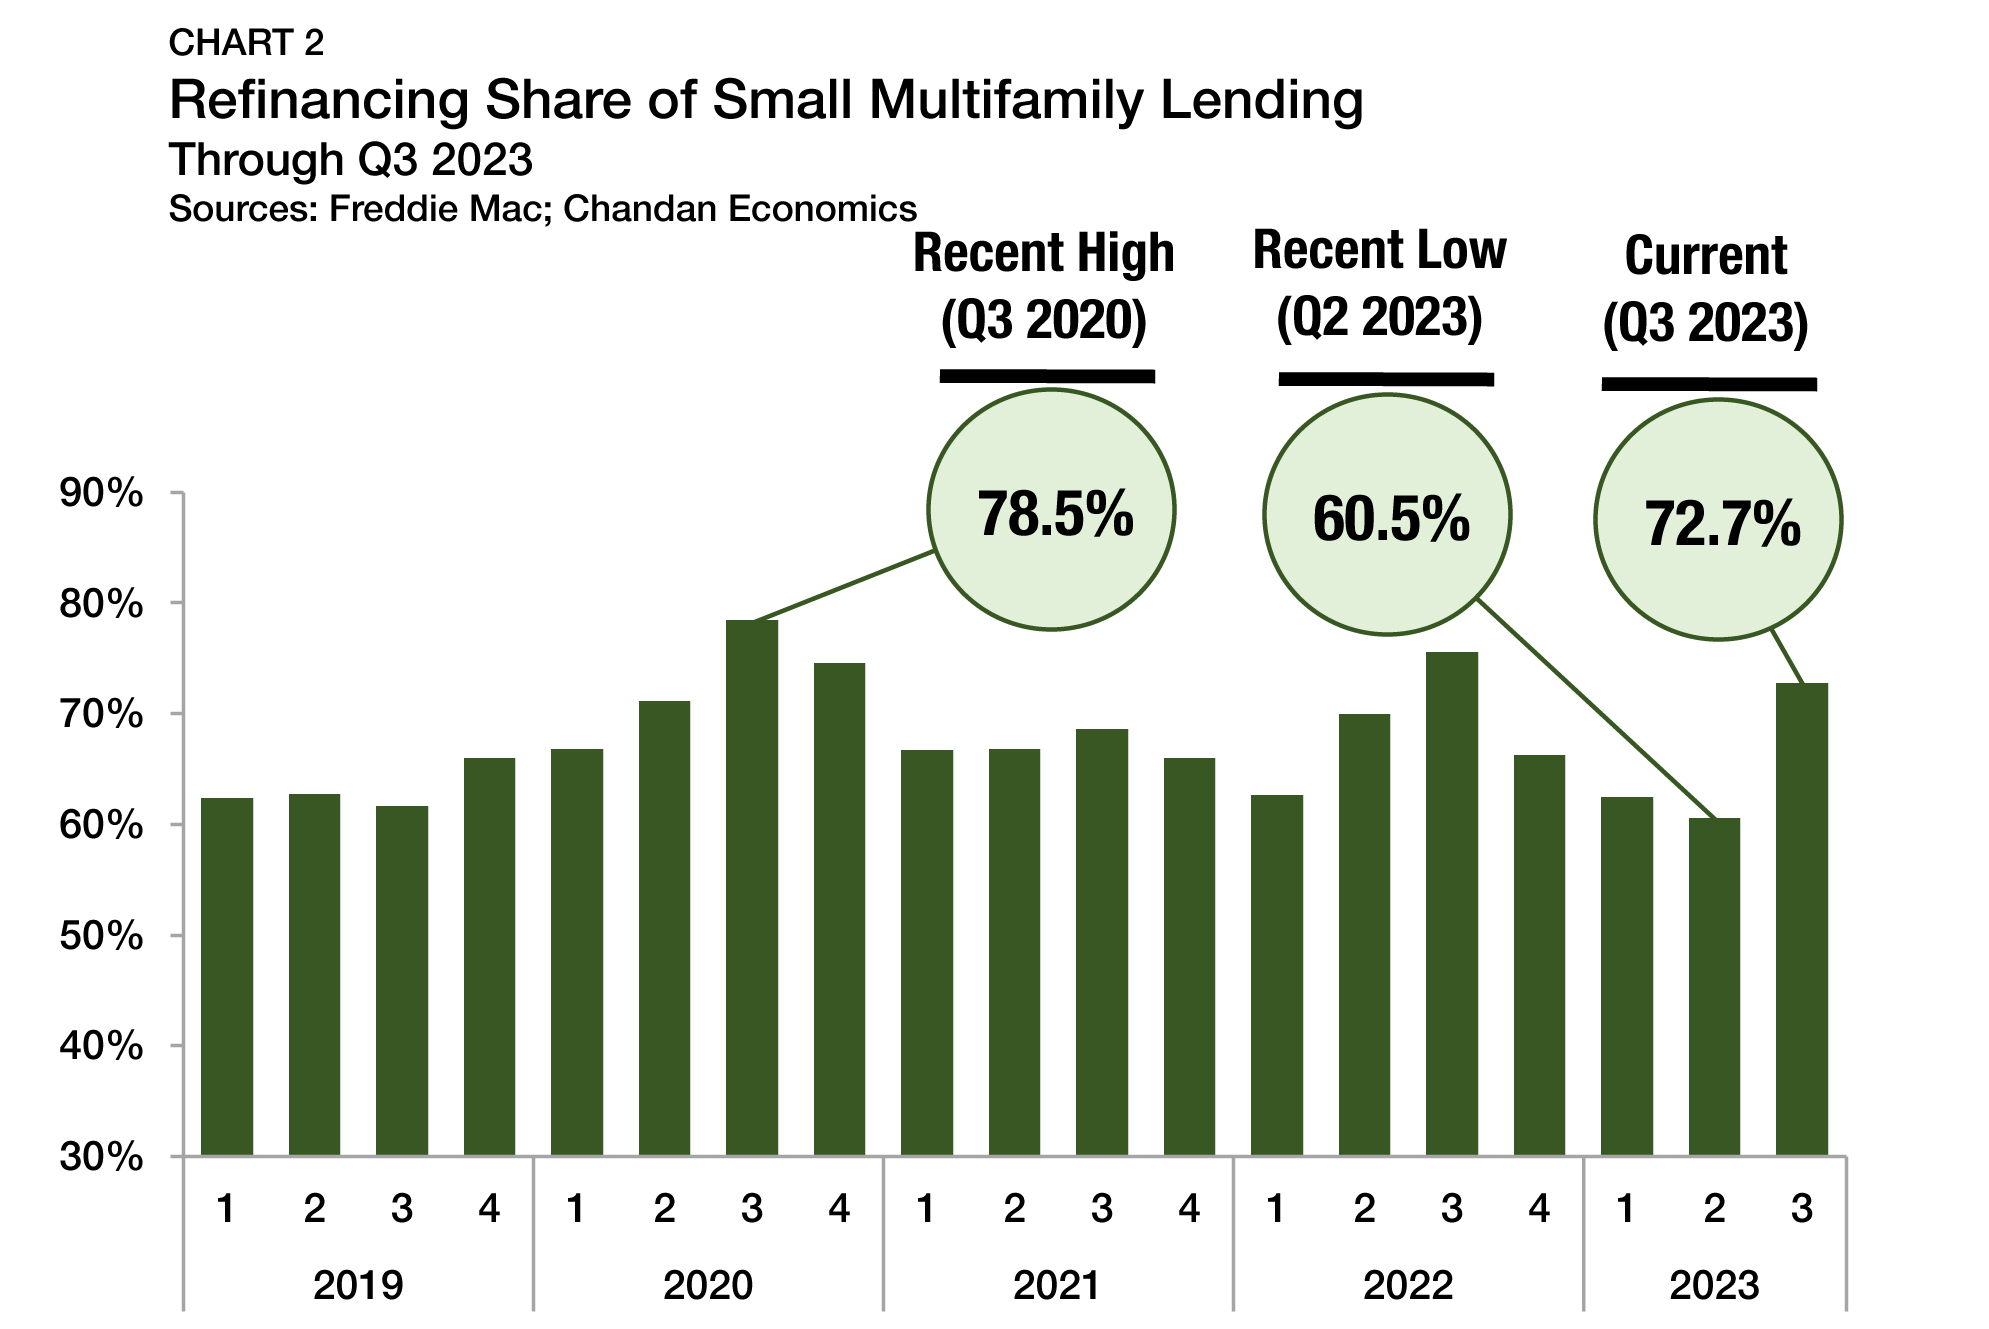
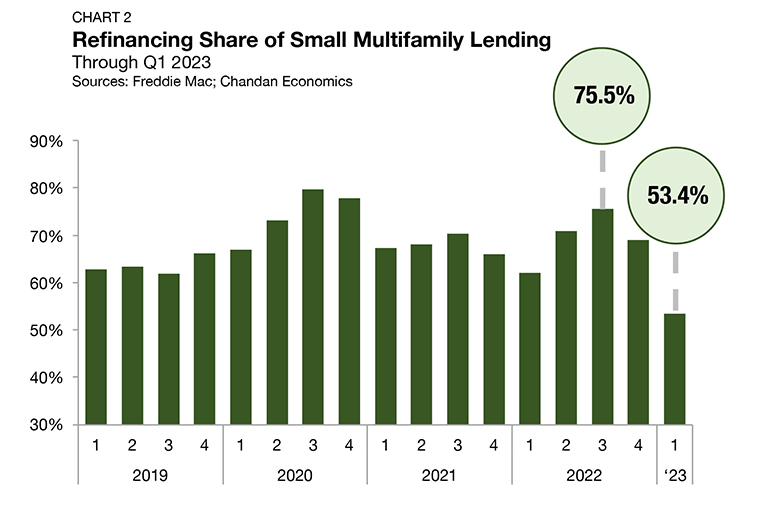
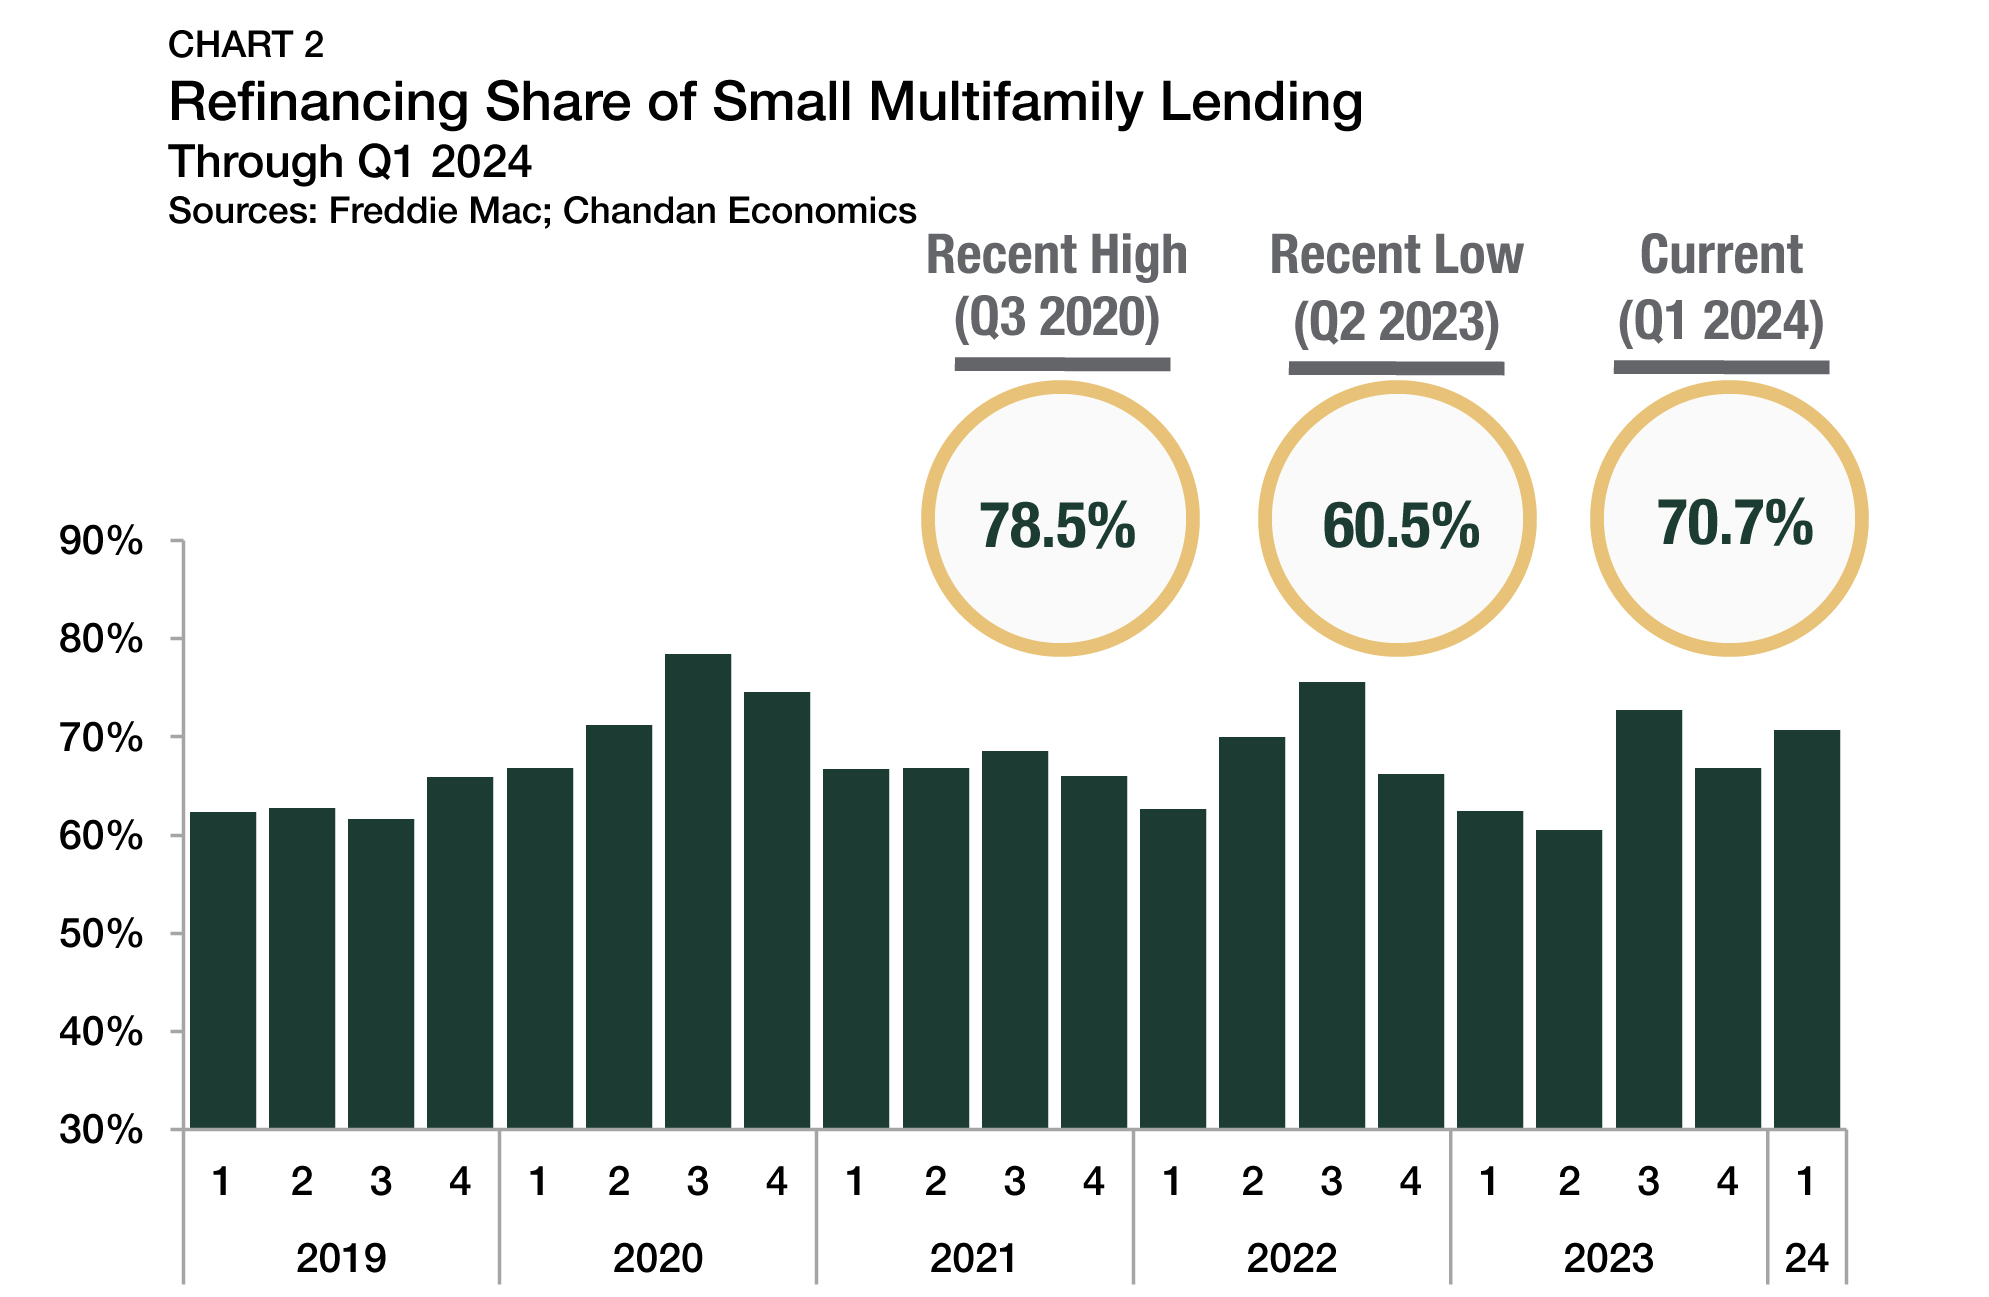
A high interest rate environment makes cash-out refinancing less attractive. When interest rates are favorable, borrowers often use accrued equity in their properties to finance subsequent acquisitions. In high interest rate environments, cash-out refinancing may result in a voluntary increase in debt servicing costs.
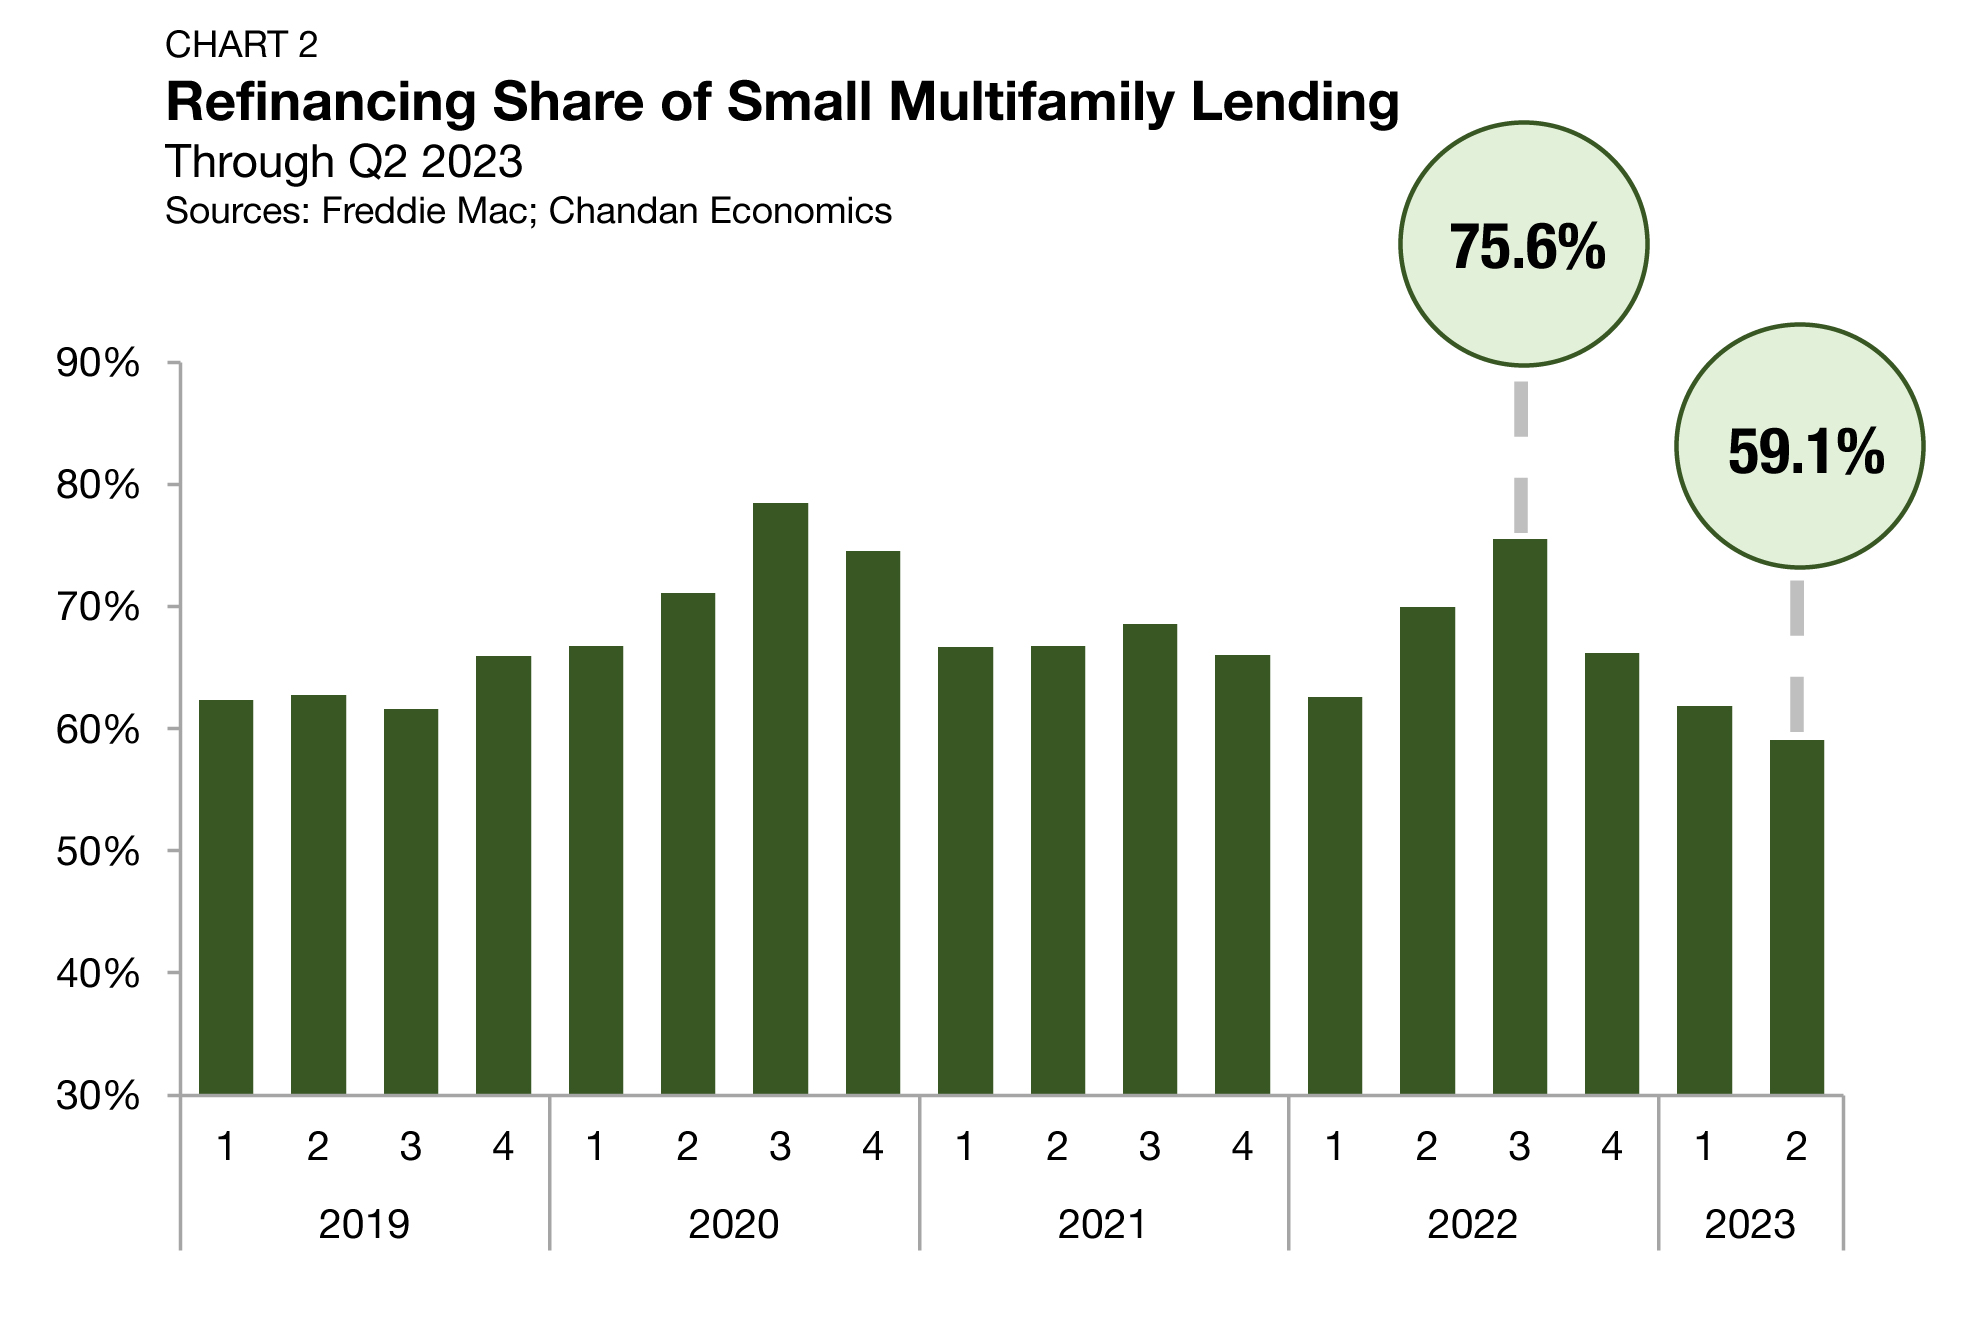
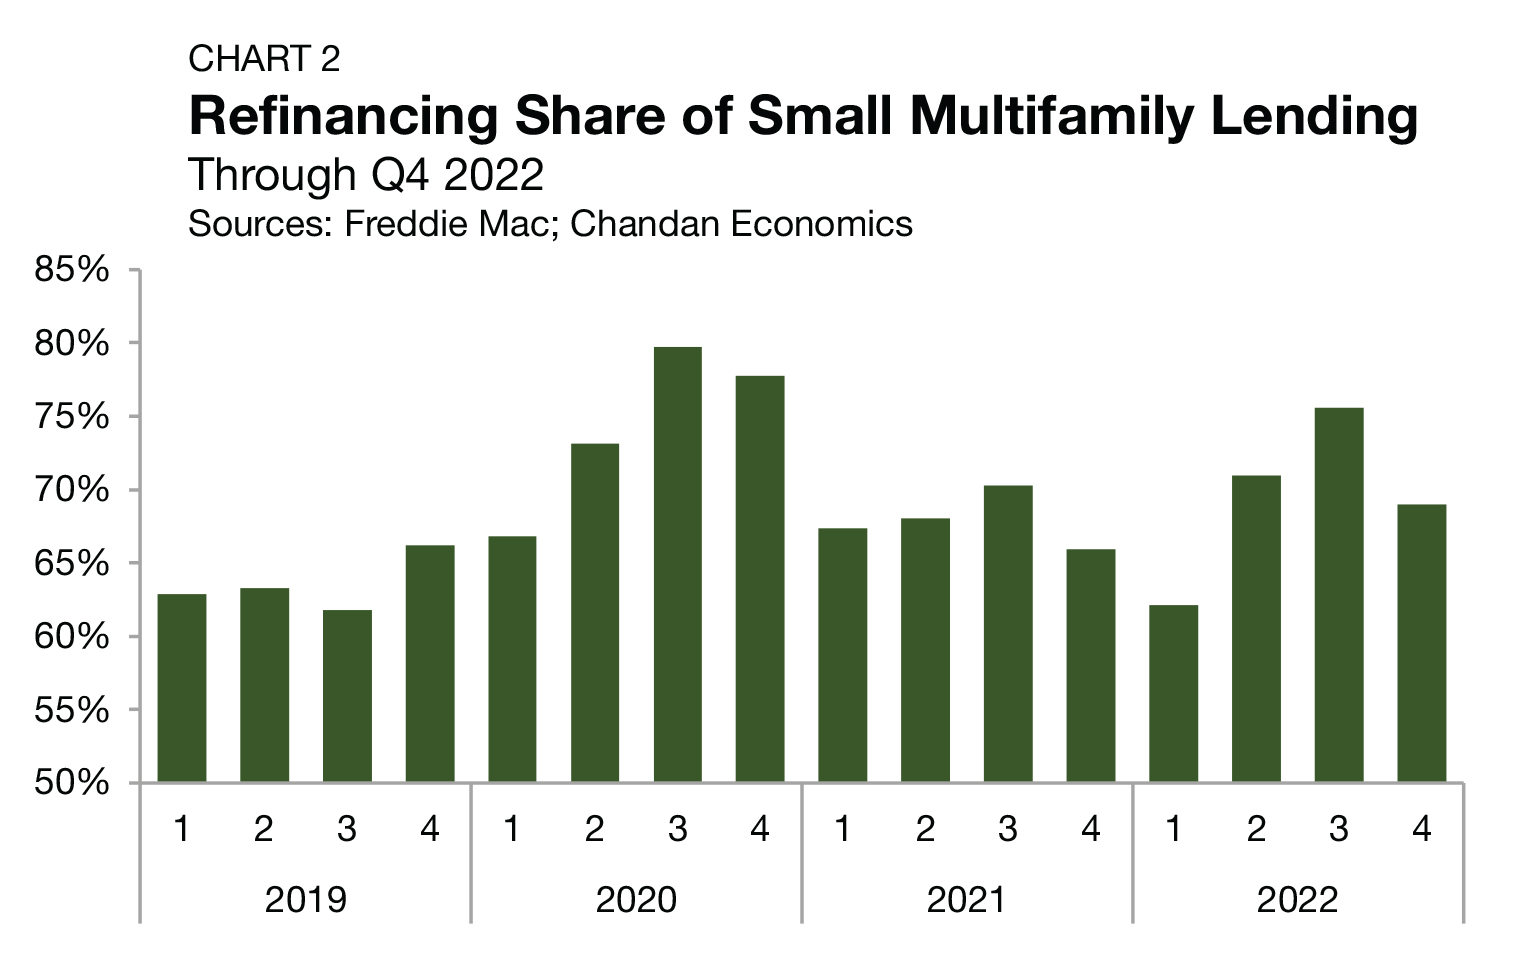
After the refinancing share of originations reached a high of 75.6% in the third quarter of 2022, it has fallen in three consecutive quarters, landing at a low of 60.5% in the second quarter of 2023 (Chart 2). The refinancing share of originations has been normalizing over the past three-quarters of available data, ranging between 66.8% and 72.7%.
Arbor Small Multifamily Price Index
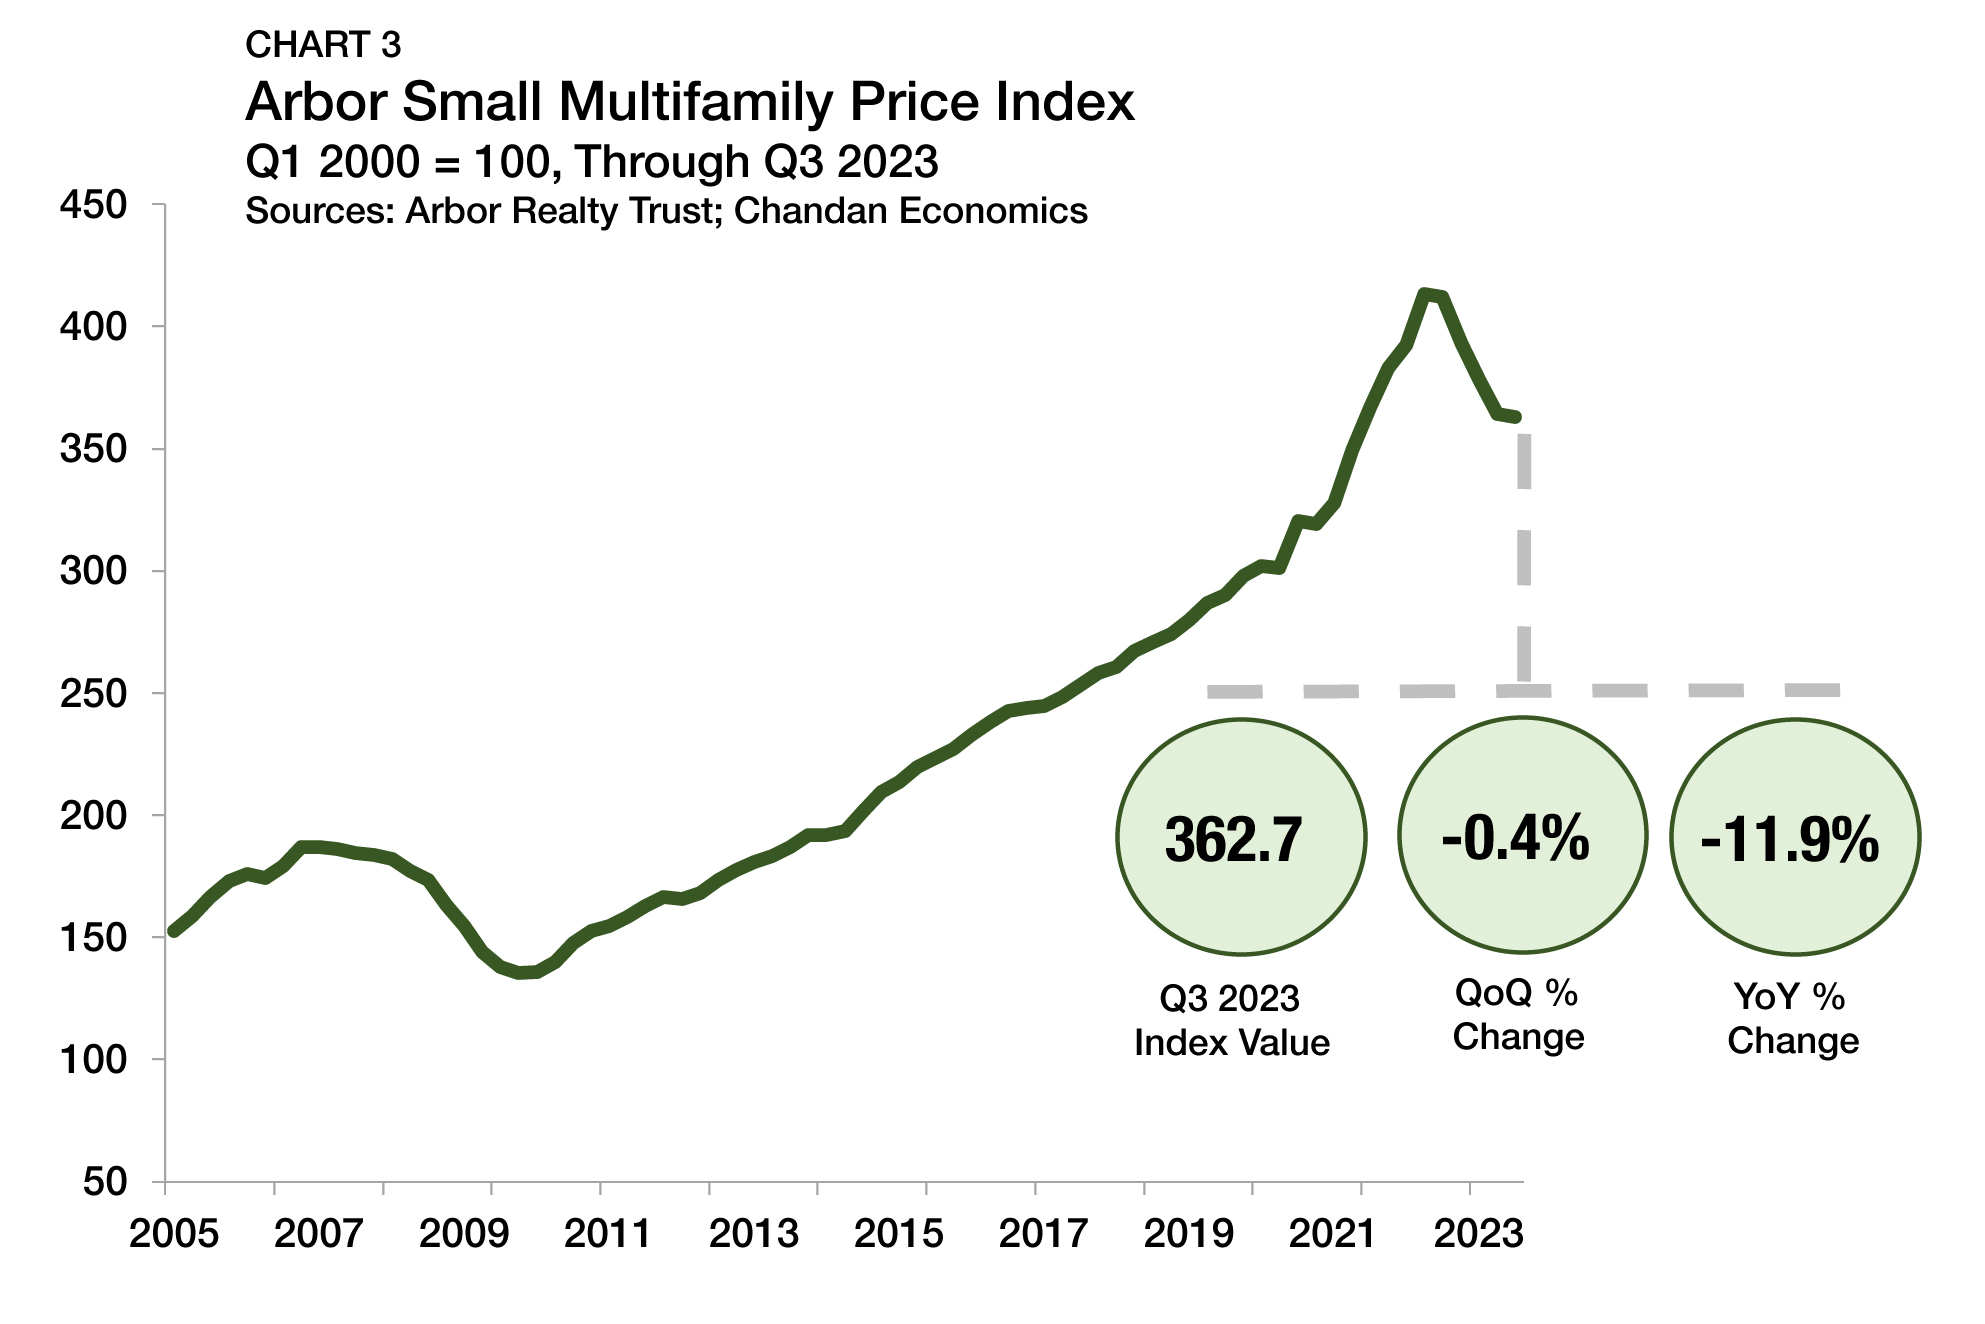
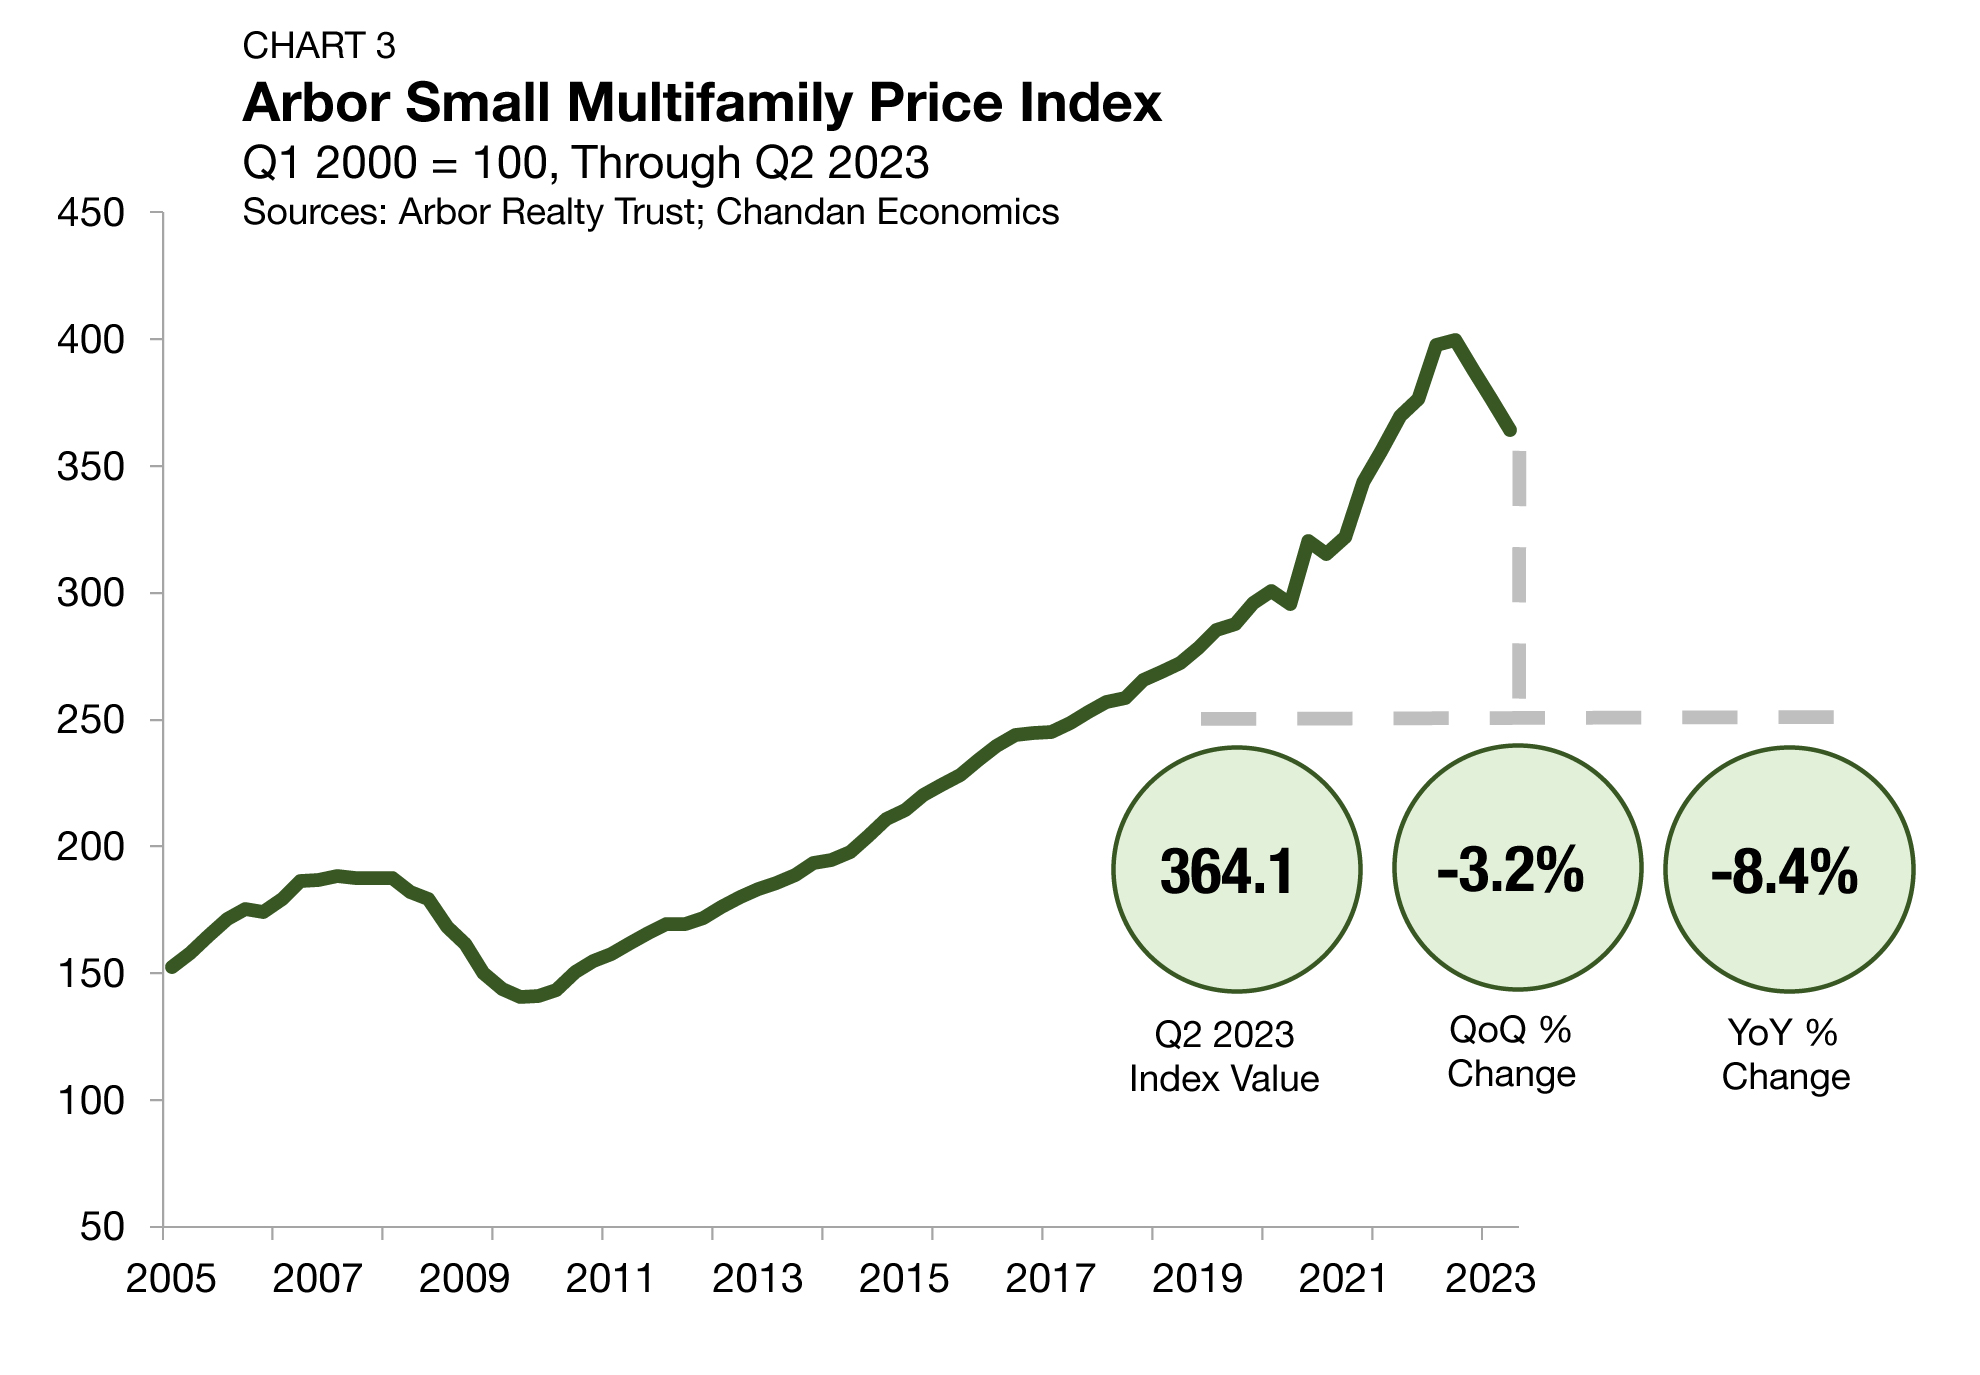
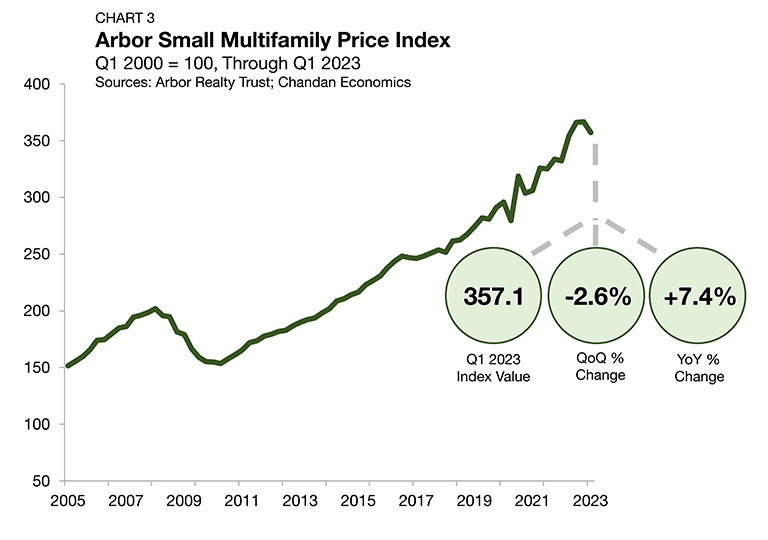
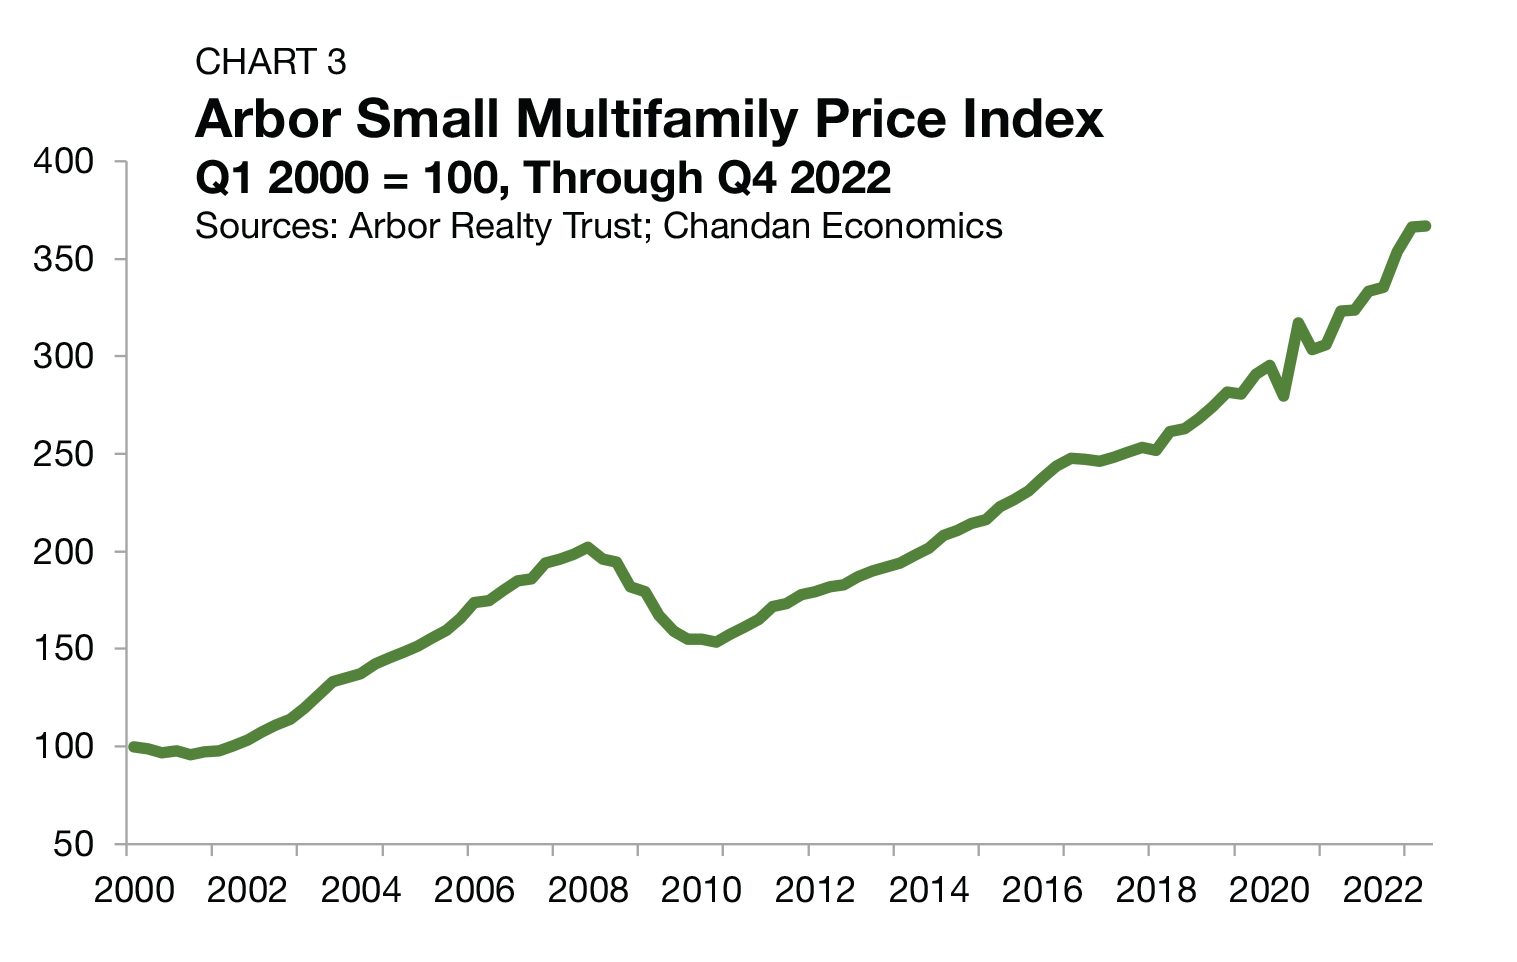
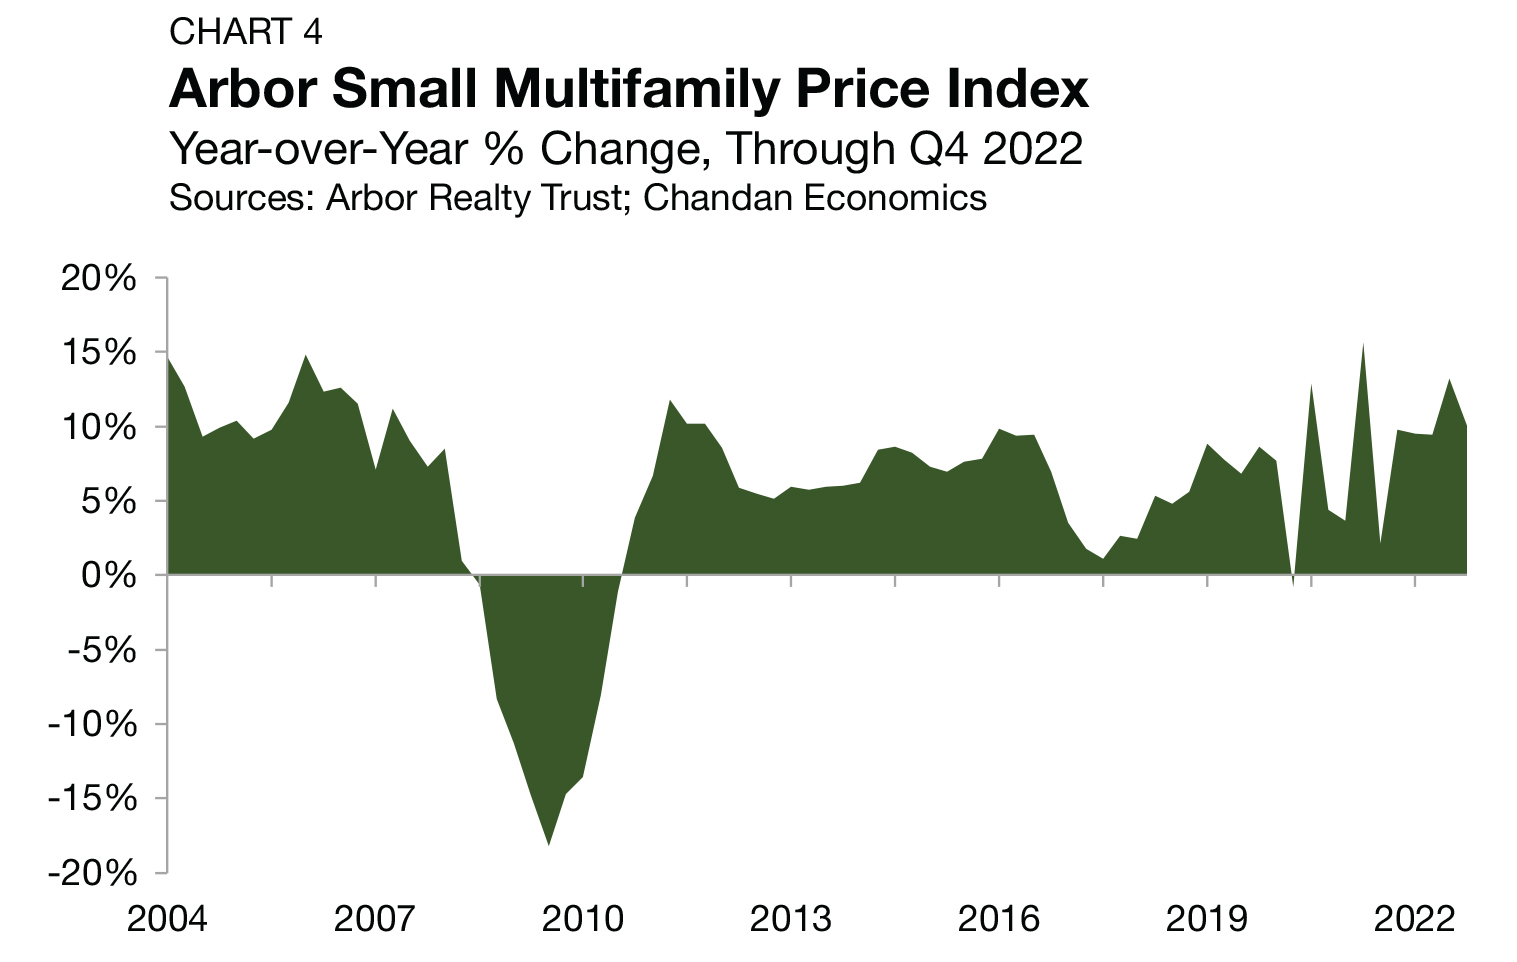
Through the first quarter of 2024, the Arbor Small Multifamily Price Index shows that small multifamily asset valuations were down 4.3% from a year earlier (Chart 3). While annual price growth remains negative, the first-quarter reading marks an improvement from the prior two quarters, where annual price declines reached above 9%. Further, quarter-over-quarter, prices held effectively flat, falling by just 0.2% in the year’s first three months. The first-quarter movement comes as expense growth has narrowly outpaced property-level incomes, which weighed against valuations, even as cap rates ticked down by a few basis points.

Following the small multifamily sector’s peak in the third quarter of 2022, asset prices have declined in six consecutive quarters, dropping 11.8% in aggregate value. Despite recent declines, small multifamily valuations today are still 19.9% higher than before the pandemic.
Cap Rates & Spreads
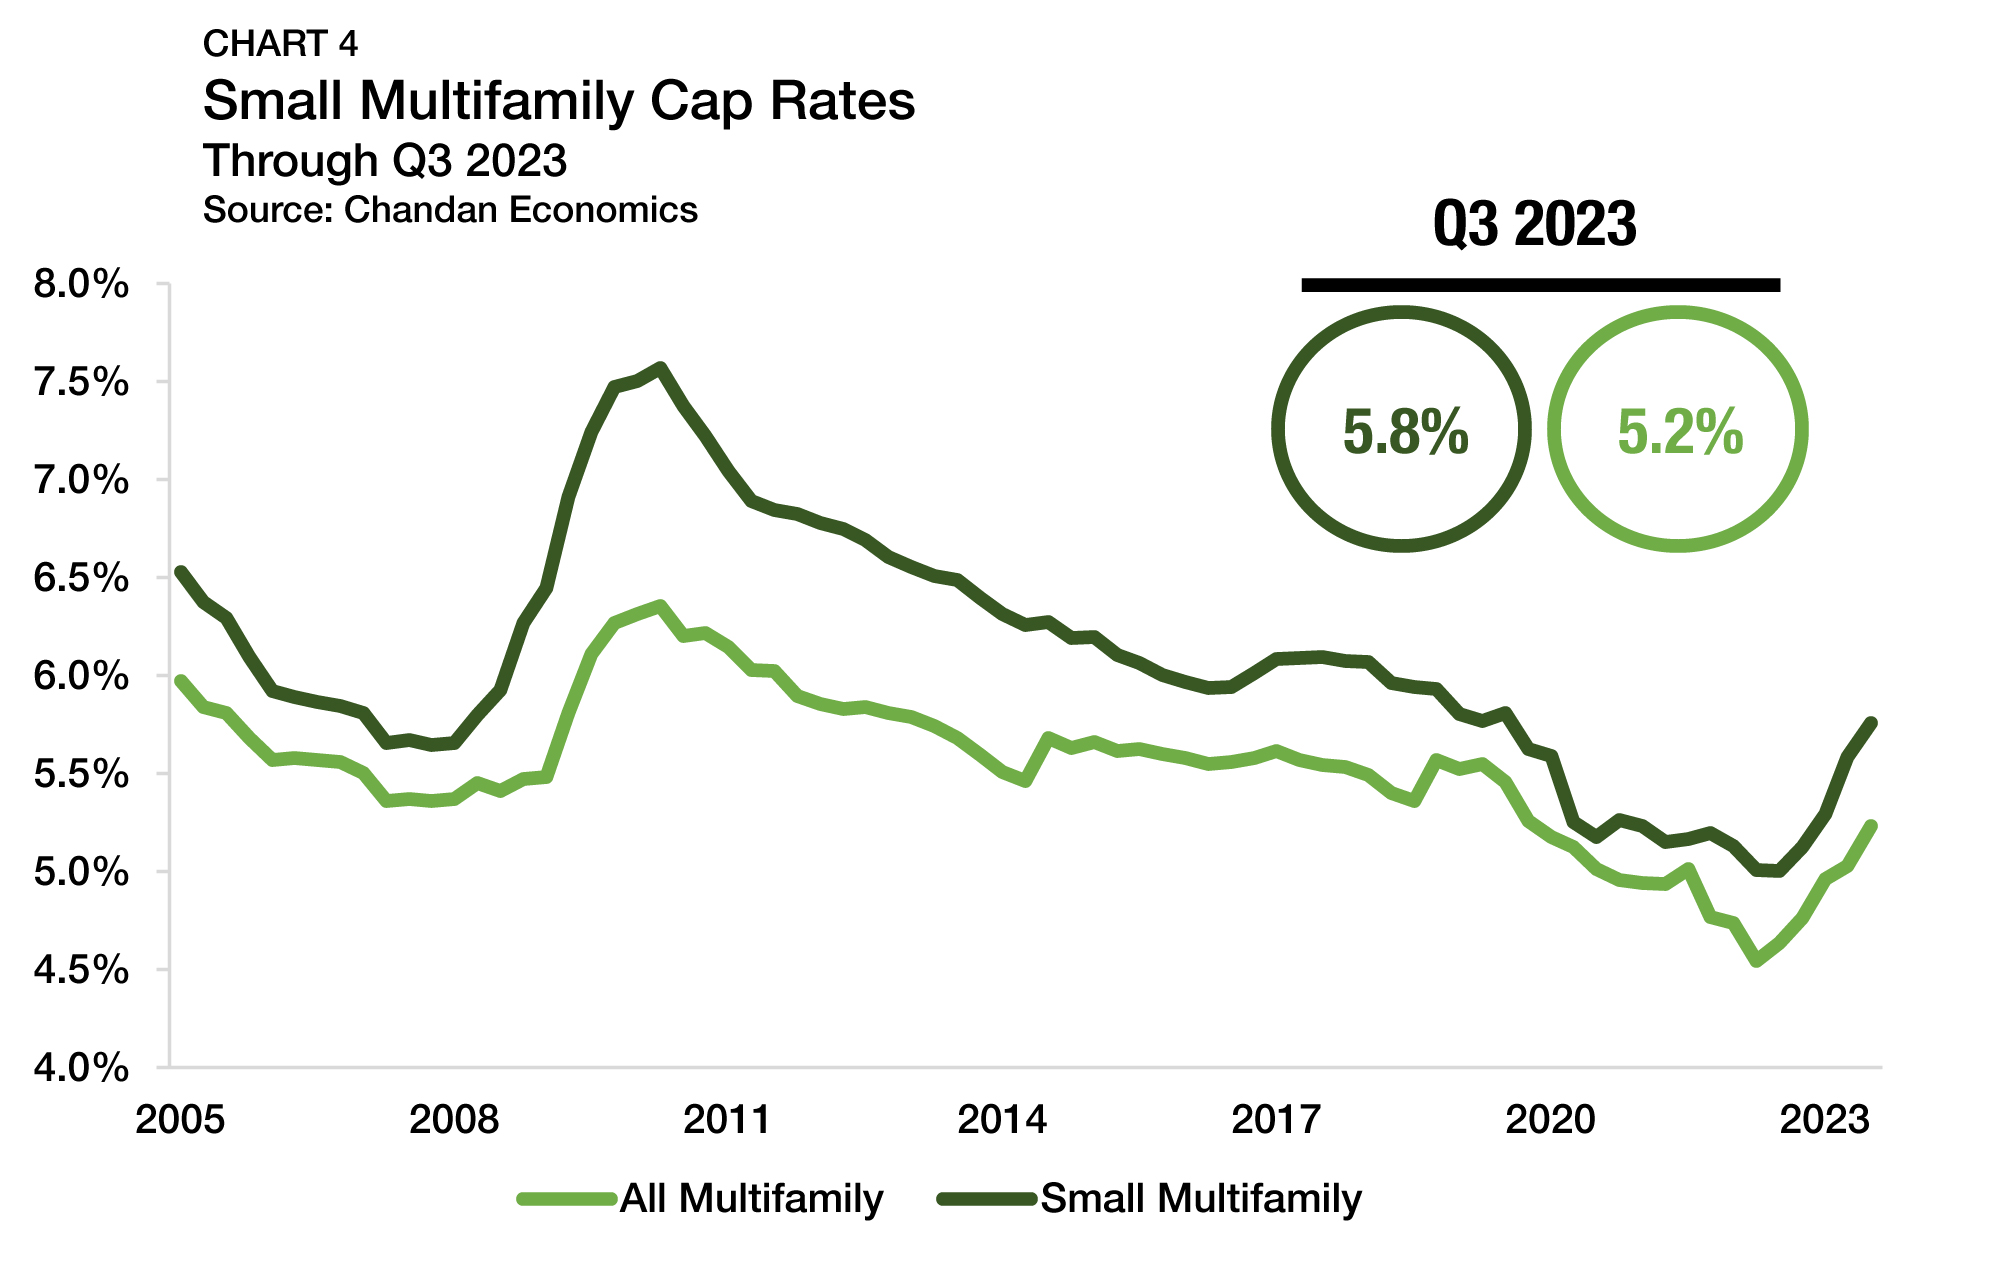
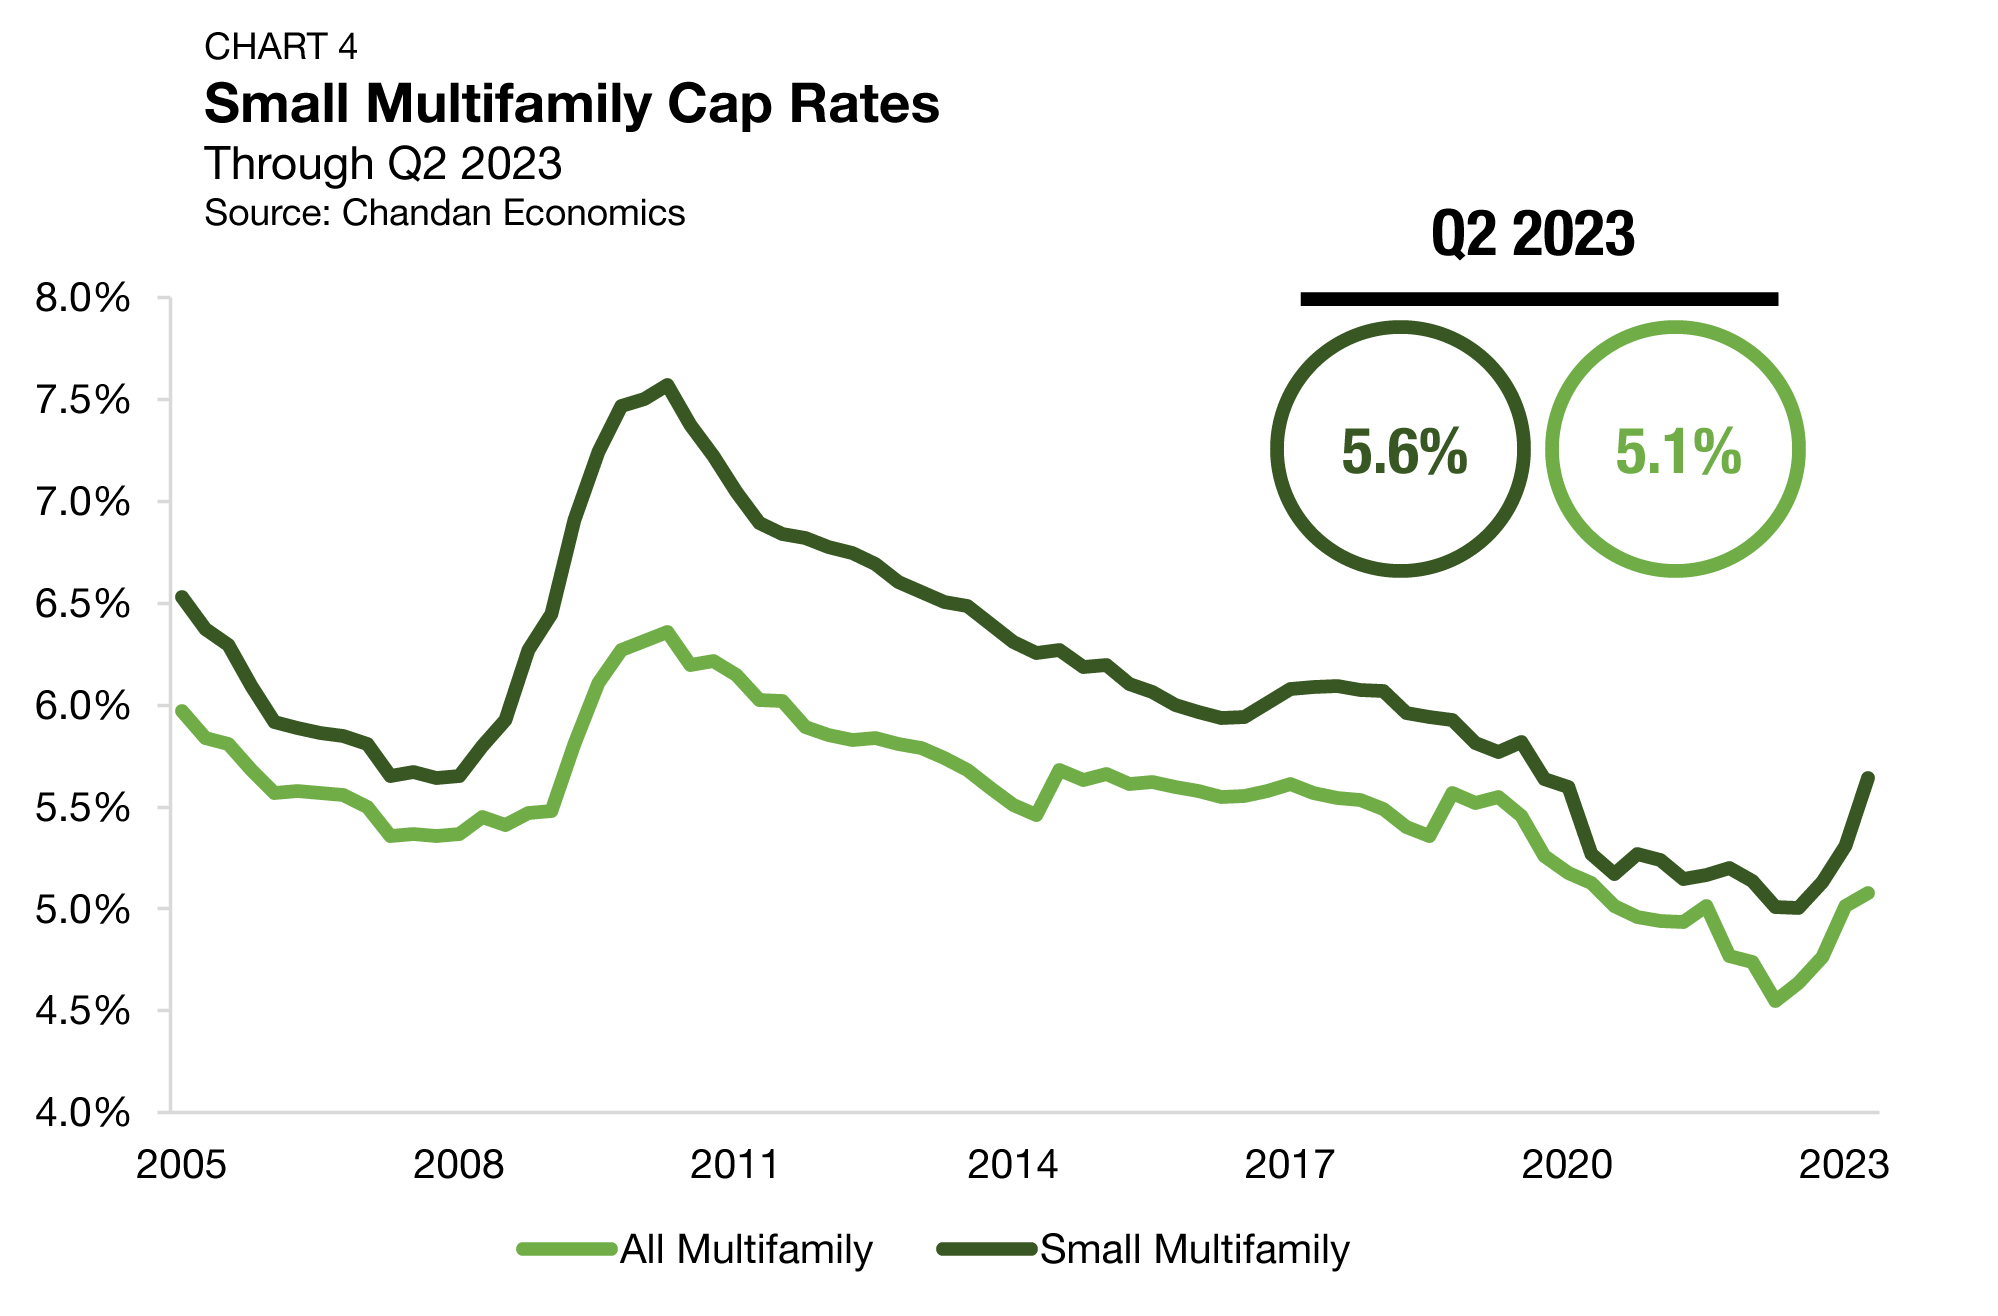
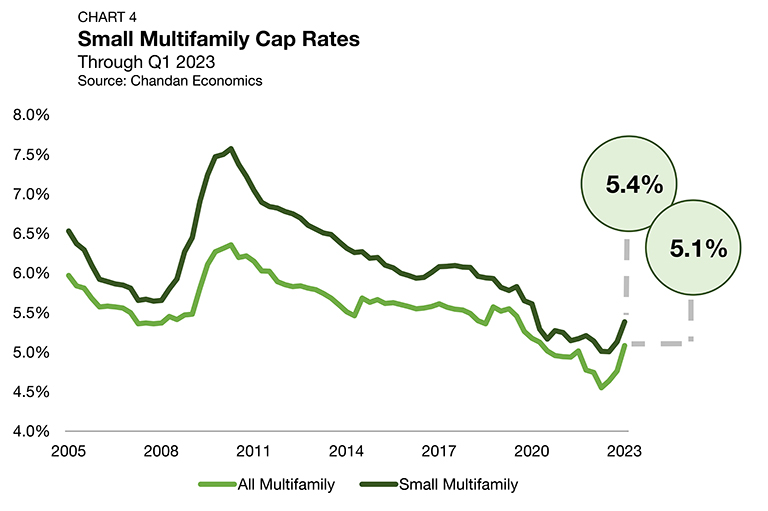
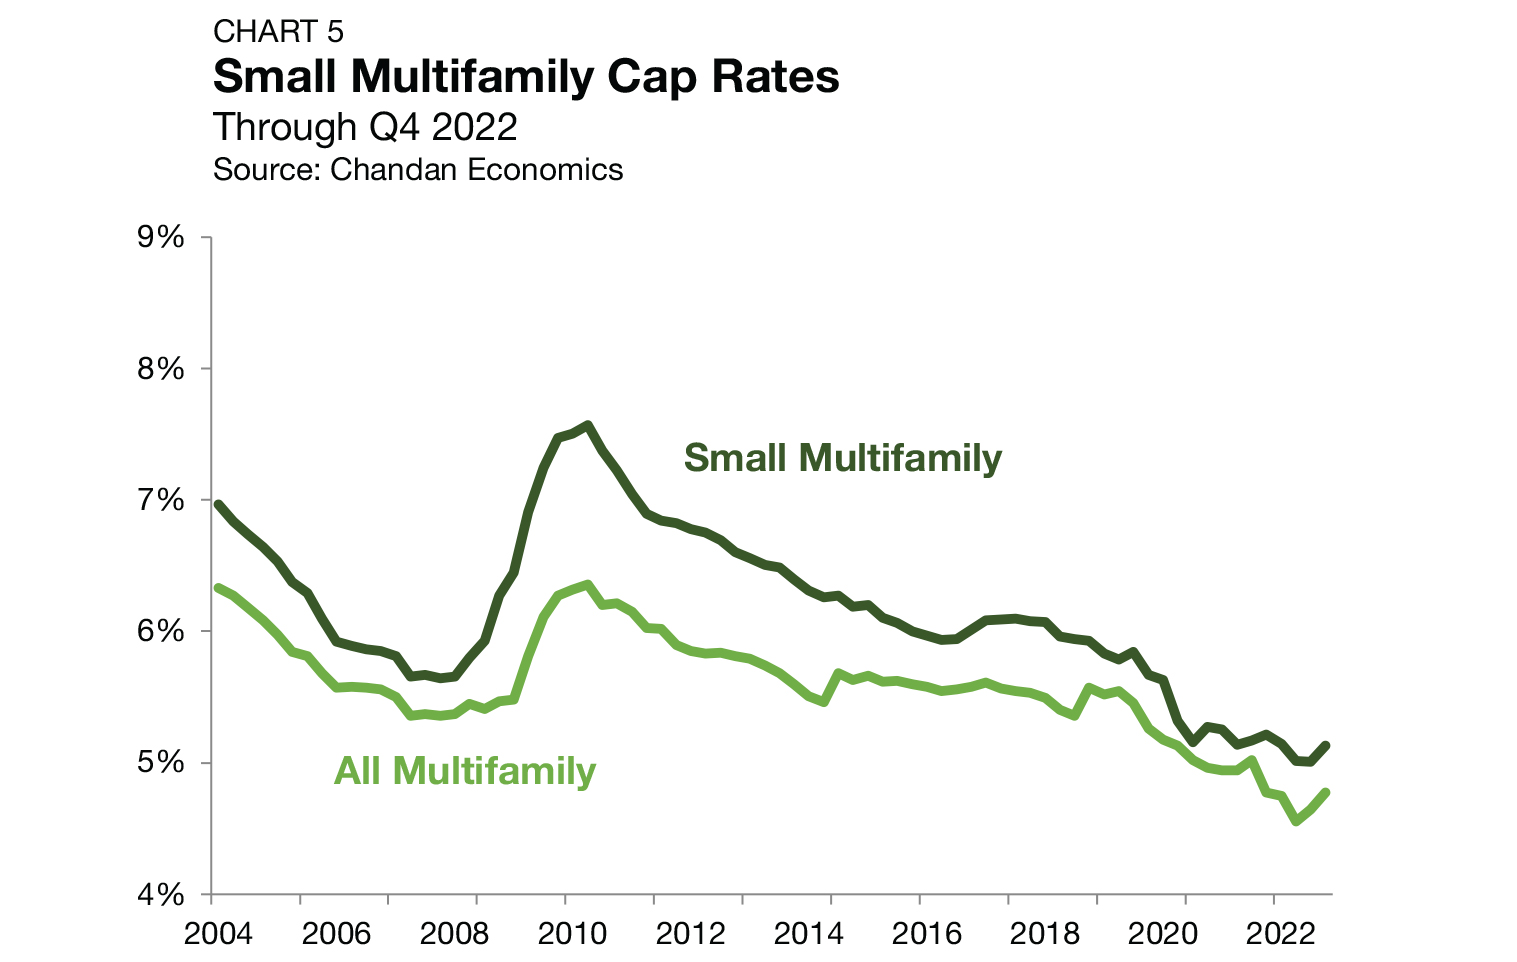
In the first quarter of 2024, small multifamily cap rates averaged 5.7% — declining quarter-over-quarter for the first time since mid-2022 (Chart 4). The marginal decline of 5 basis points represents a surprising shift in direction. Similar trends have also been reported for prime multifamily properties, an indication that recent patterns in rising cap rates could be reversing sector-wide.

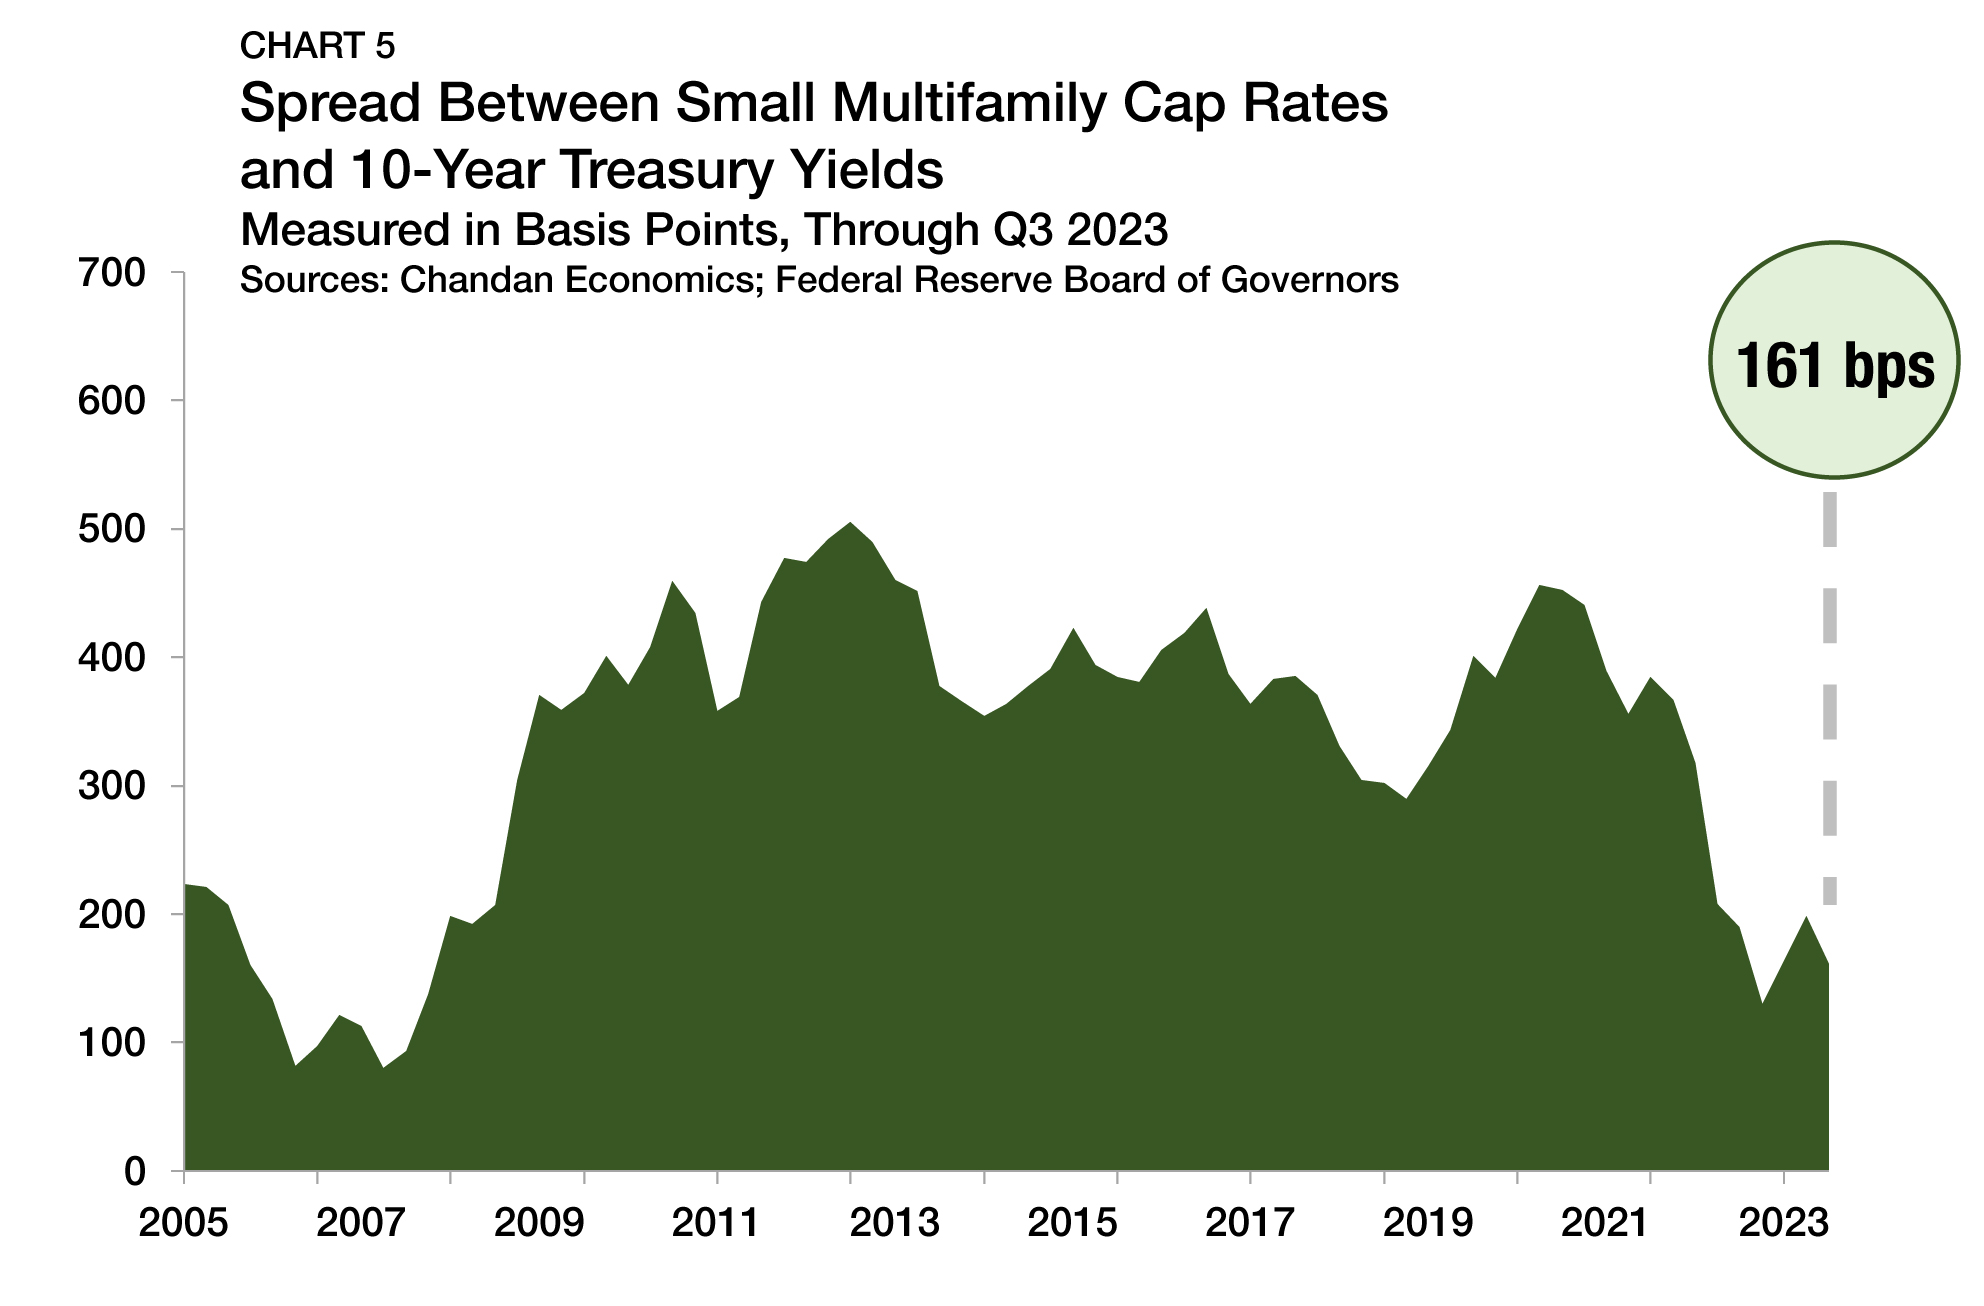
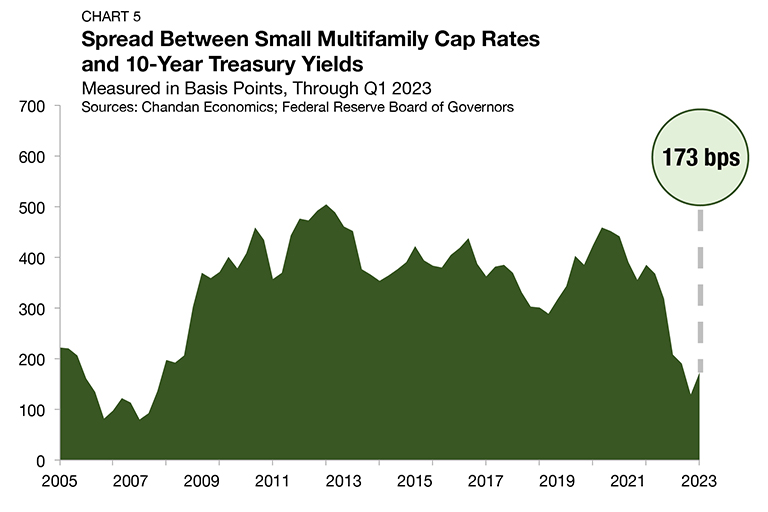
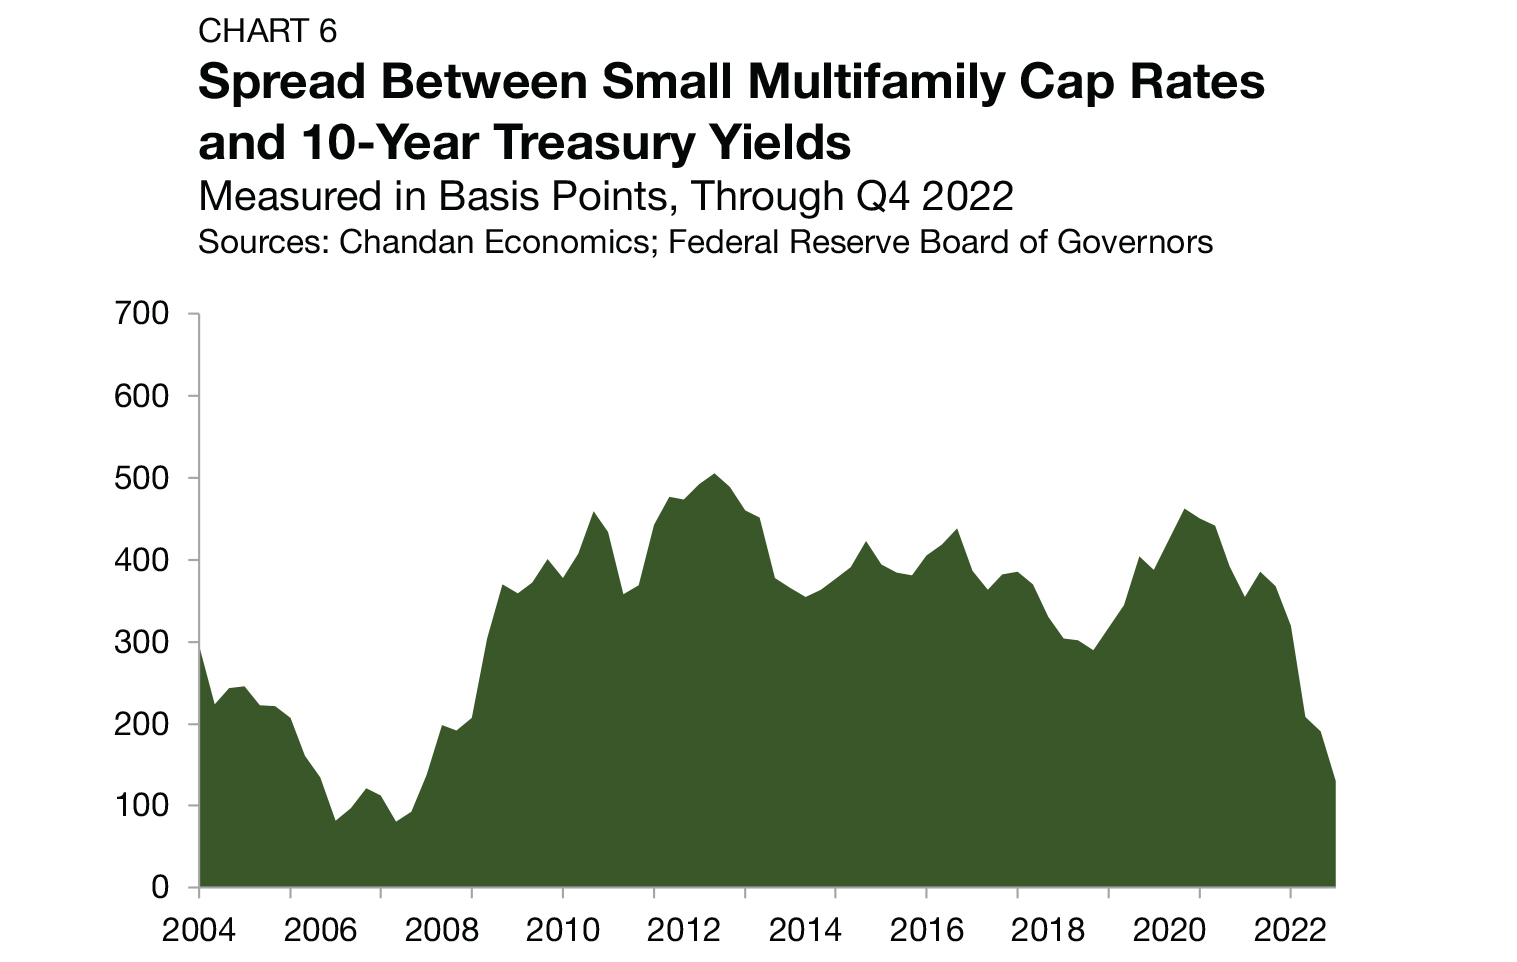
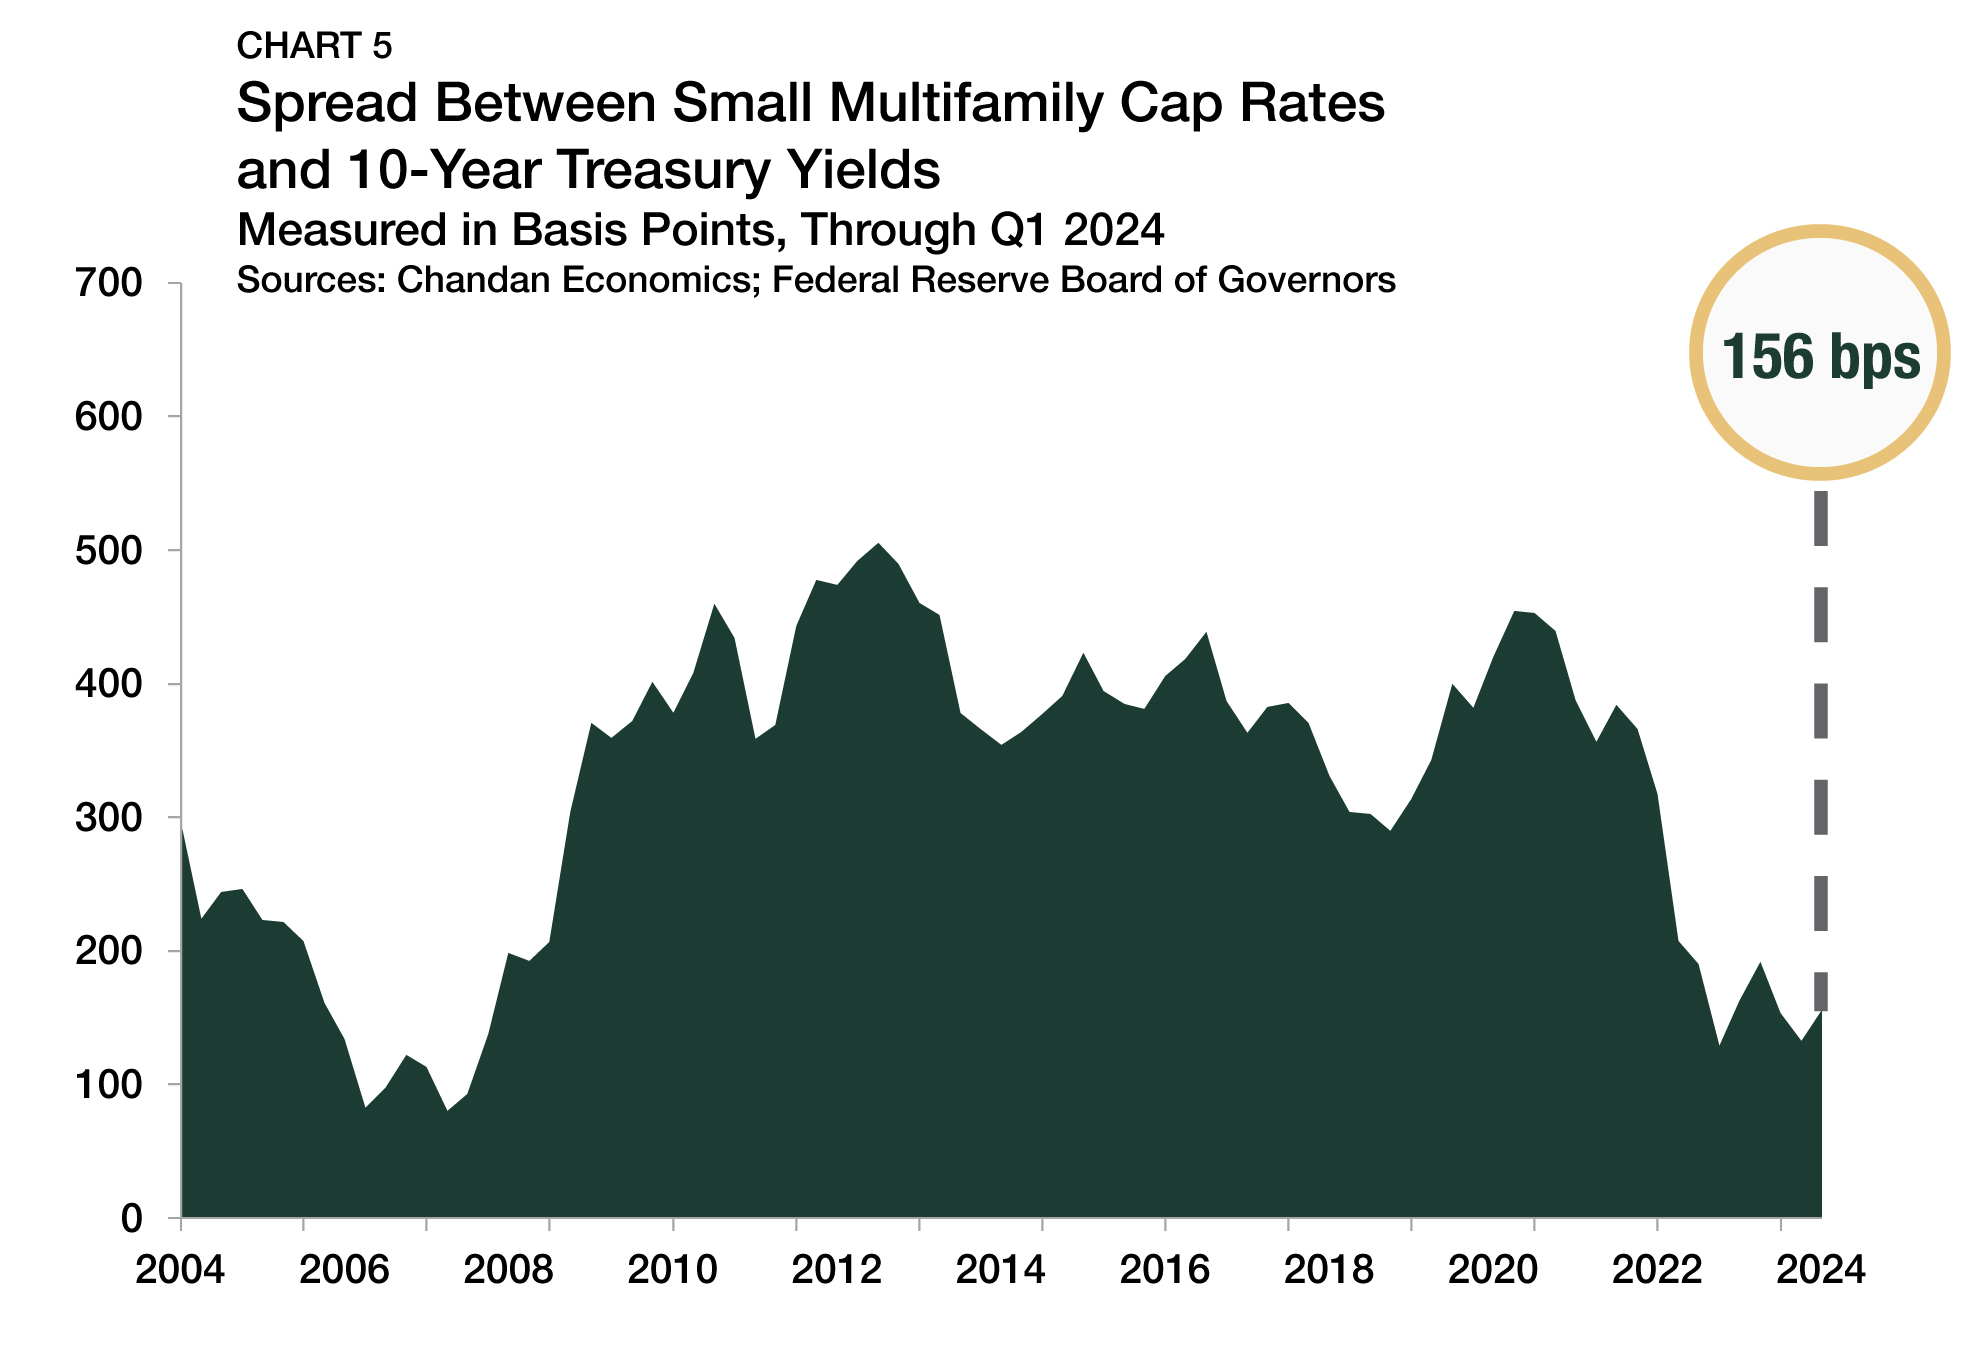
The small multifamily risk premium, best measured by comparing cap rates to the yield on the 10-year Treasury, approximates the additional compensation that investors require to account for higher levels of risk. This risk premium widened by 23 bps in the first quarter of 2024, reaching 156 bps (Chart 5).
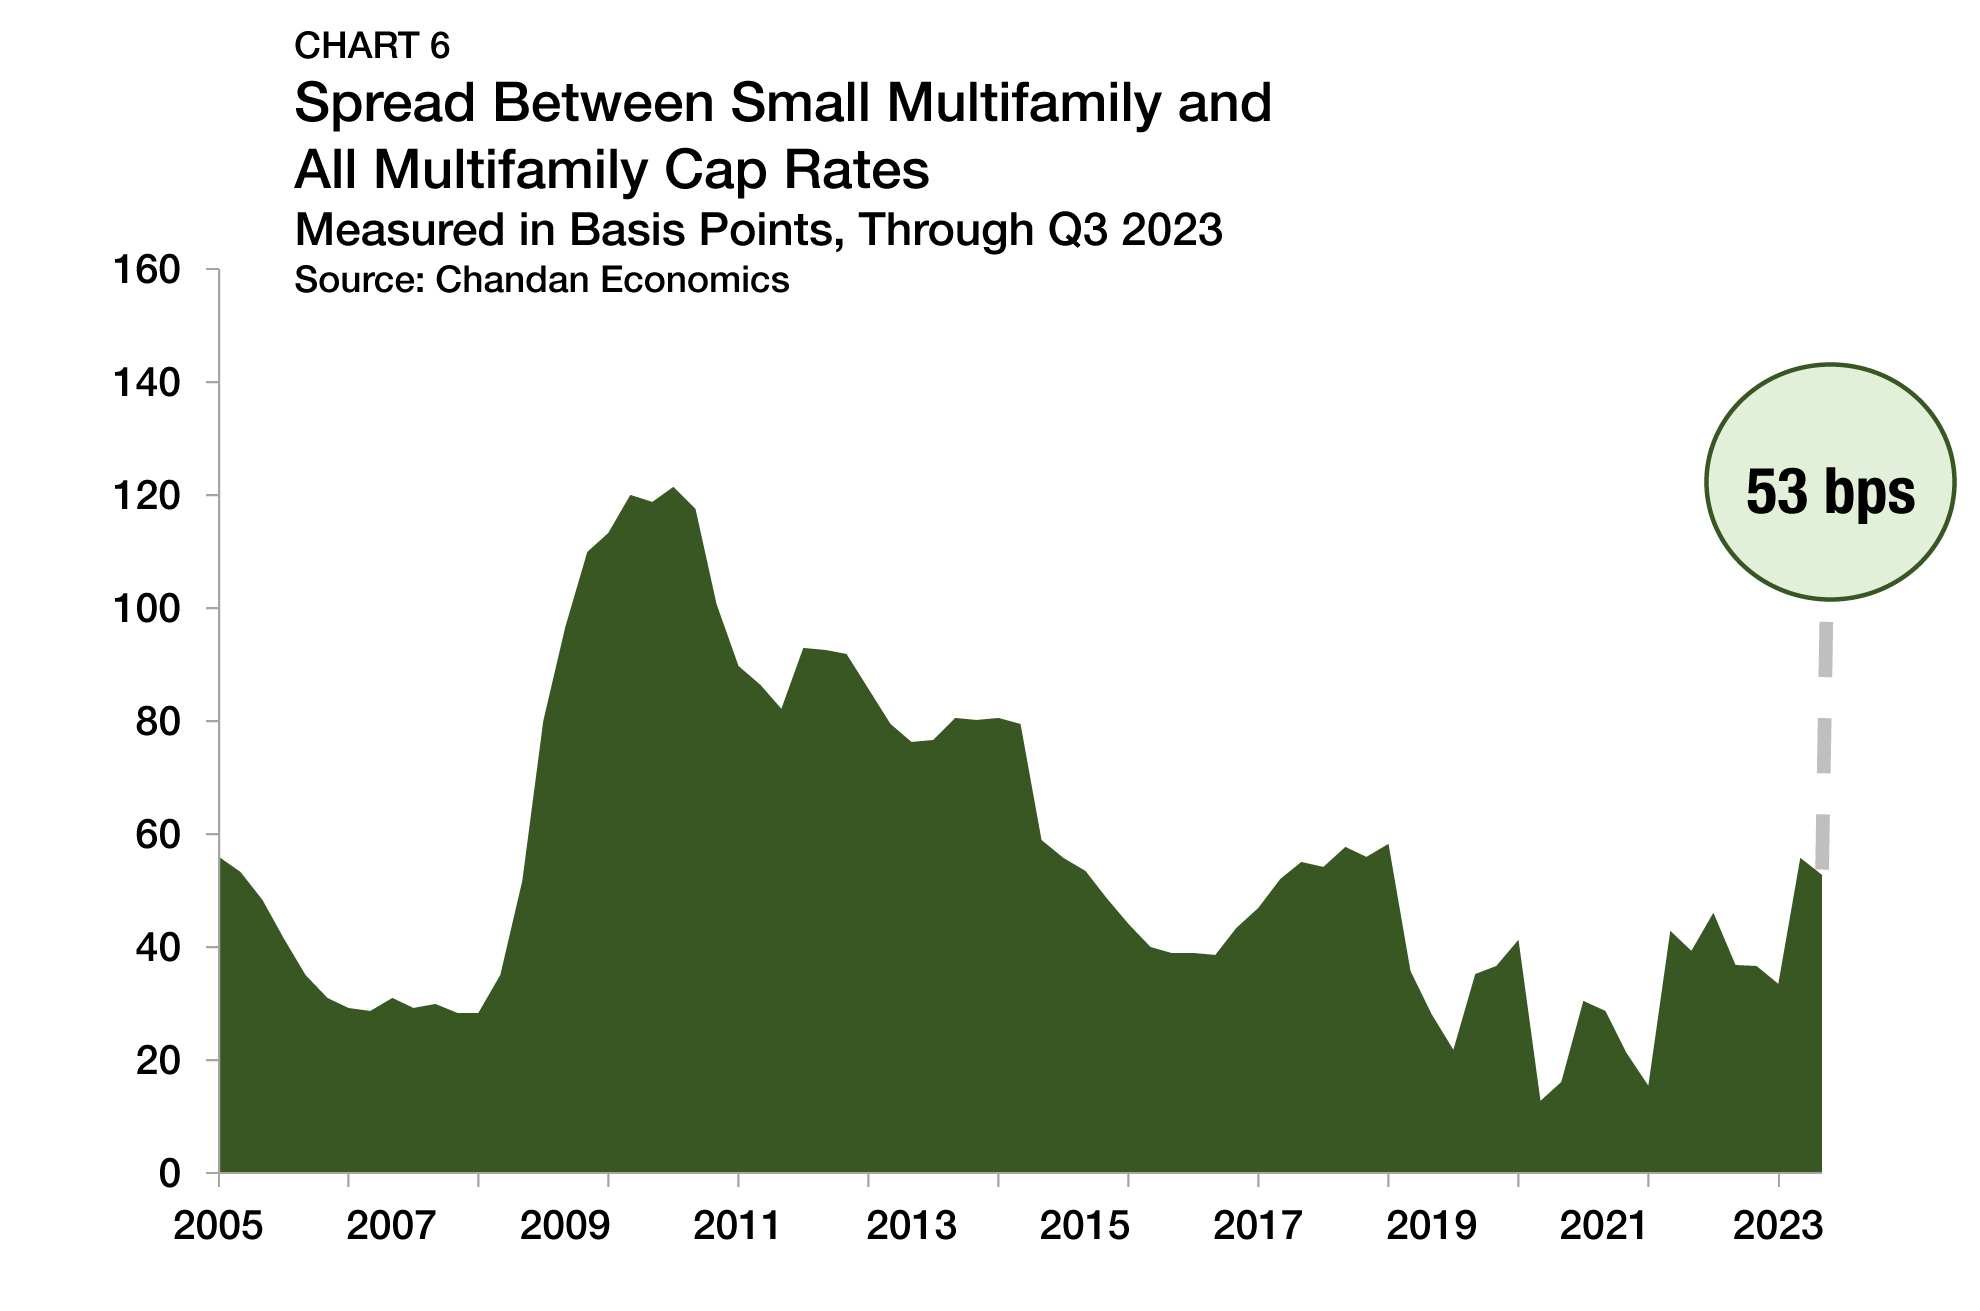
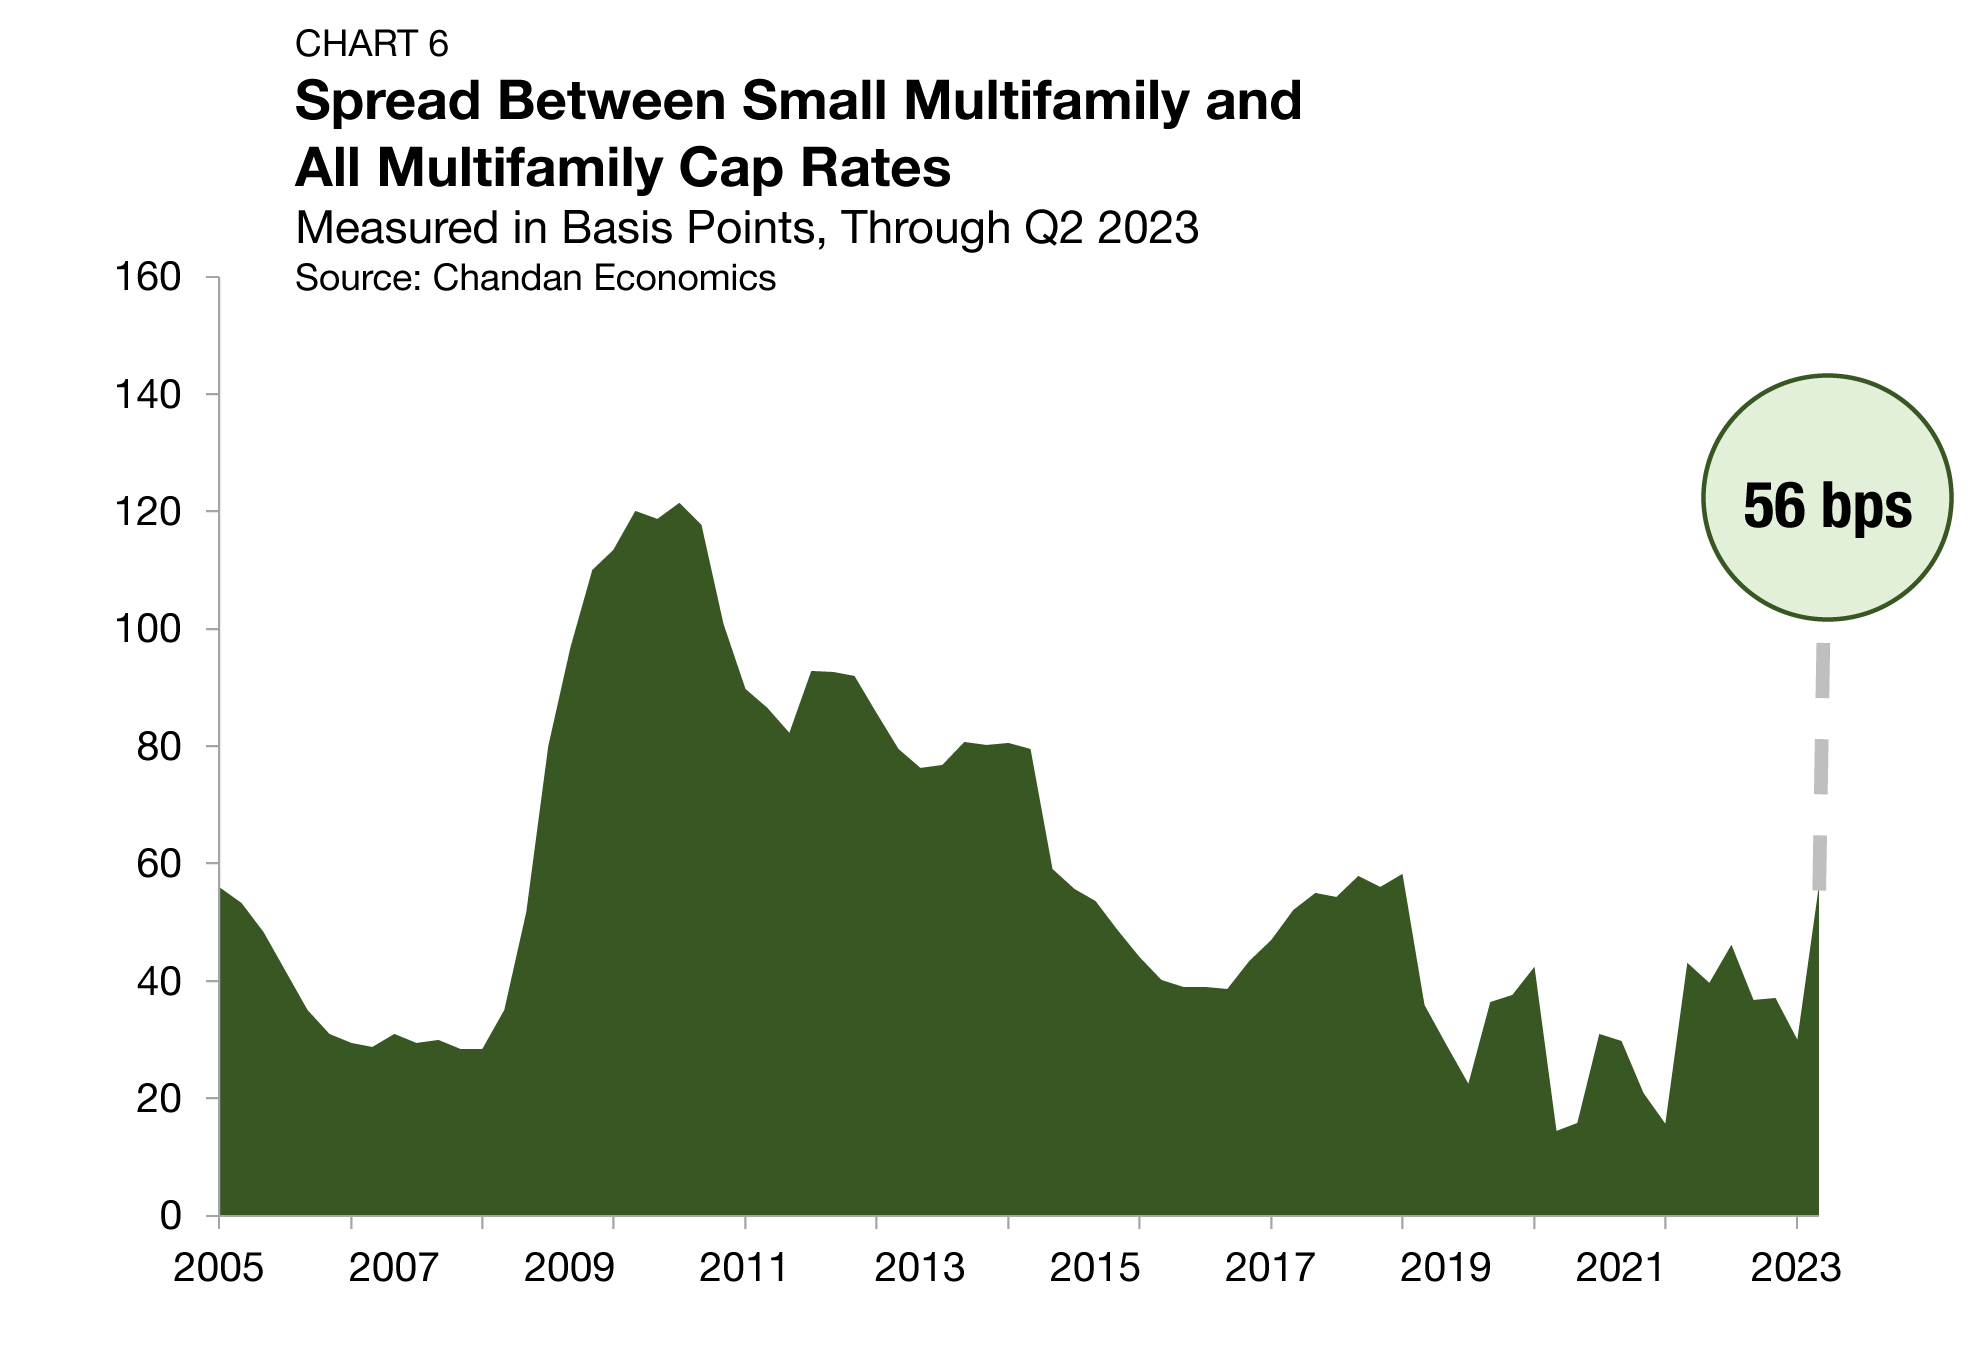
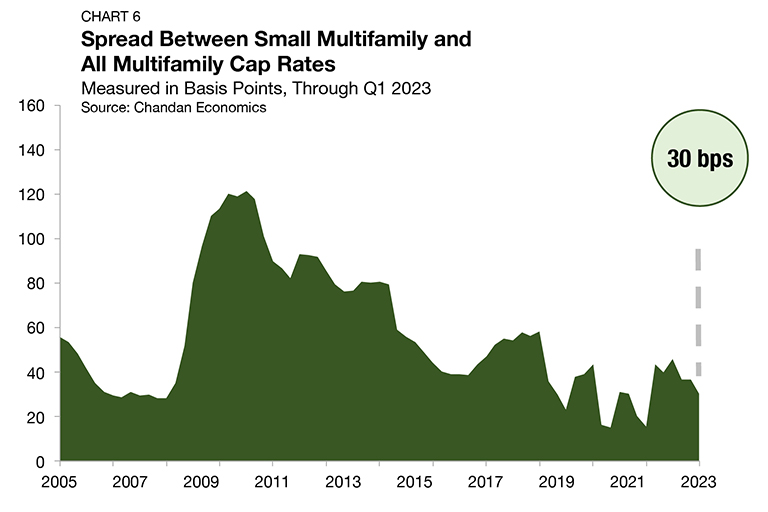
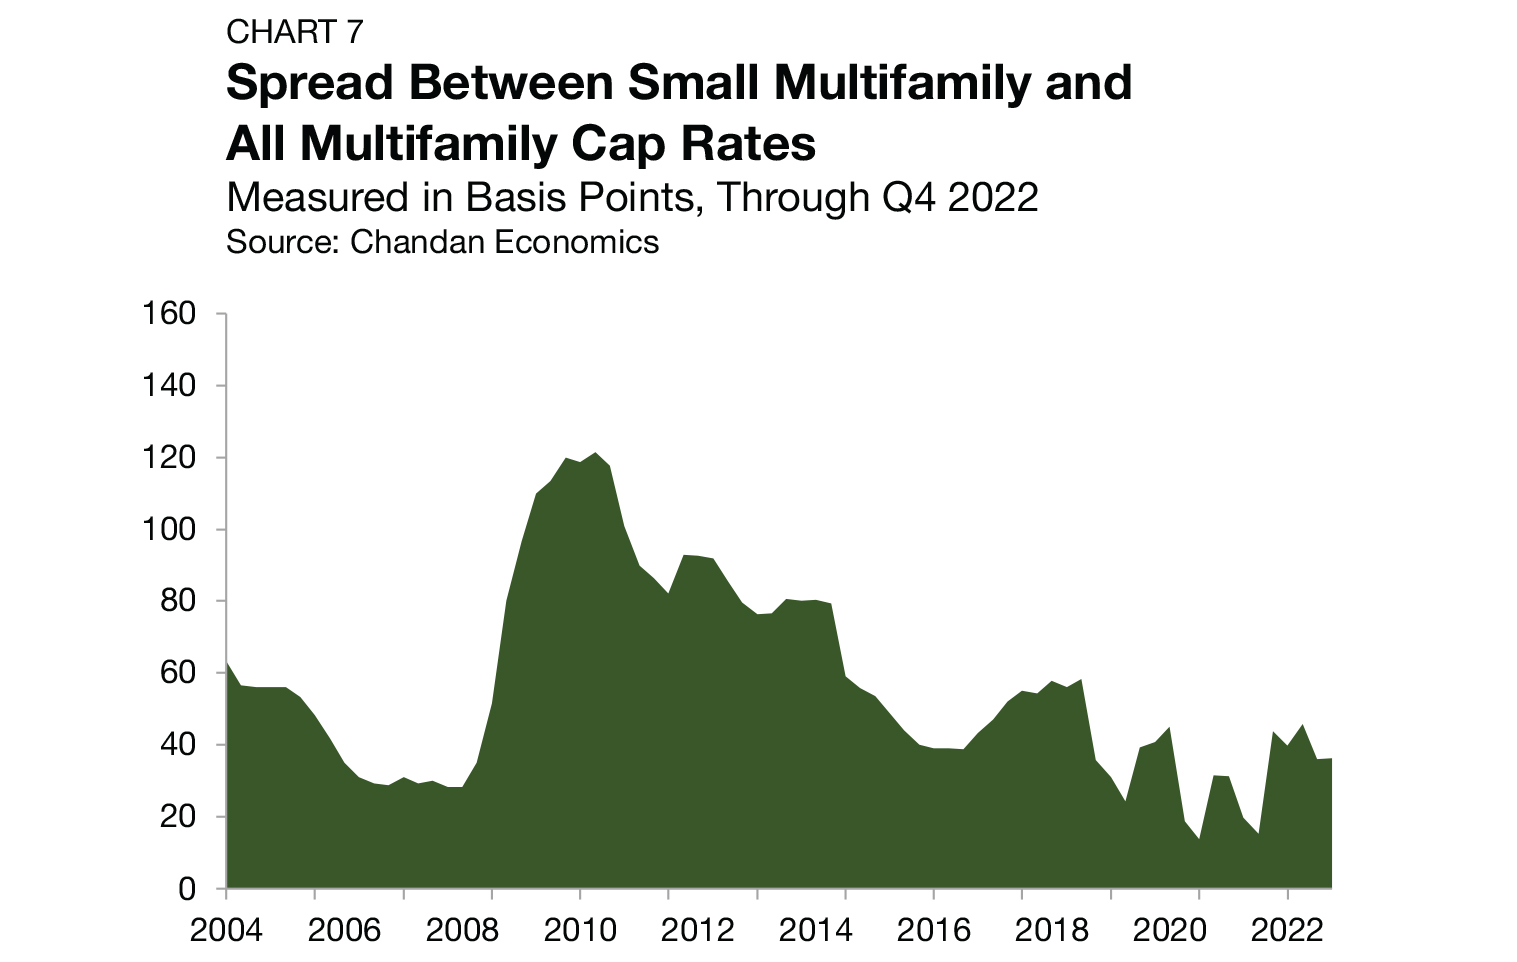
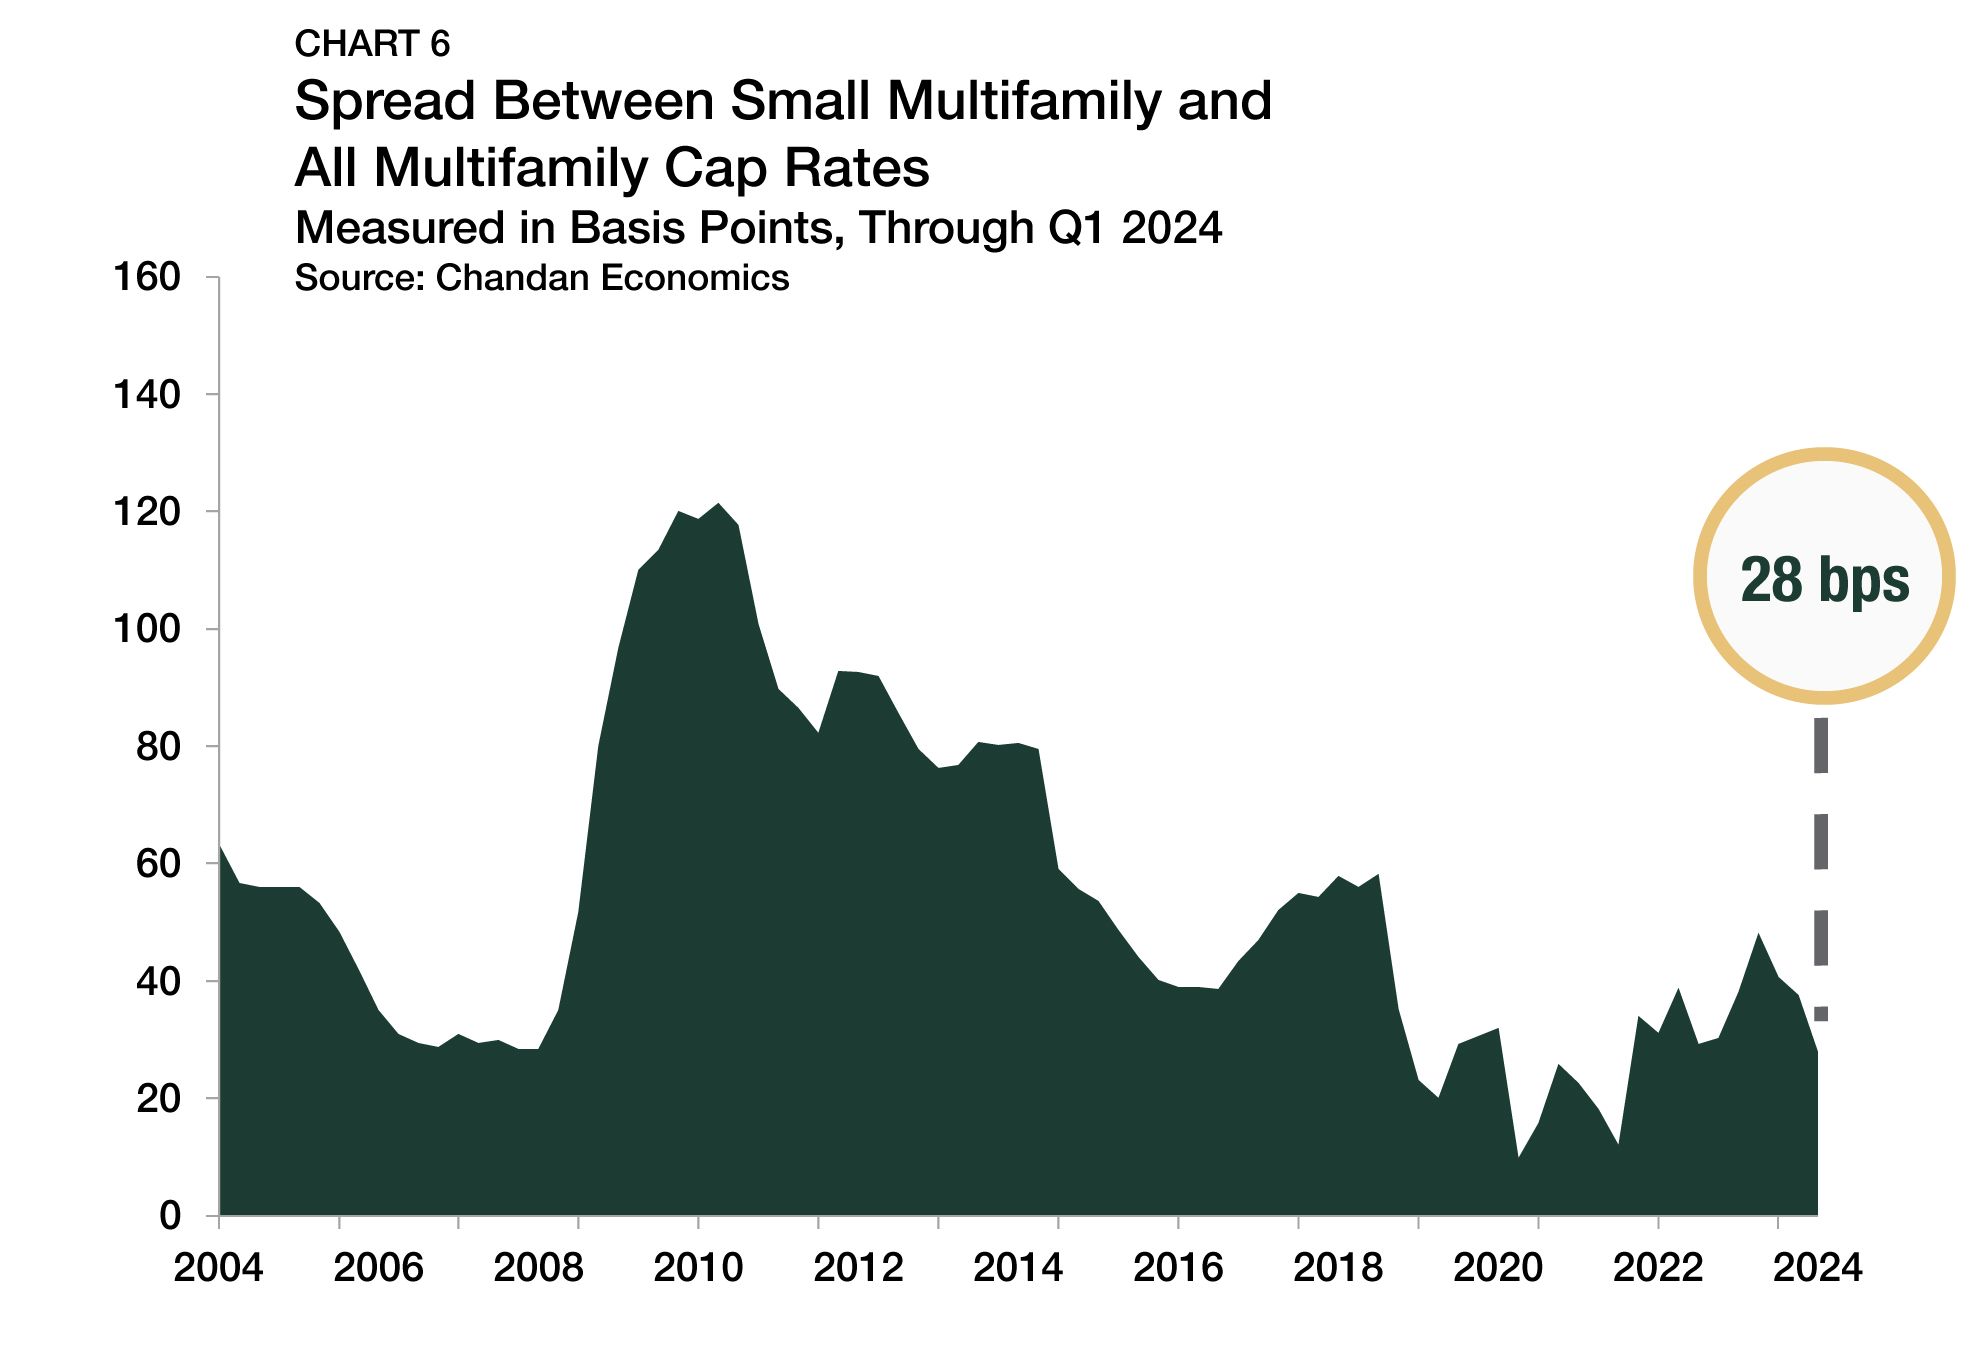
The first quarter increase arrives as 10-year Treasury yields averaged 4.2% over the year’s first three months — down from 4.5% in the fourth quarter of 2023. Despite the slight increase, the current risk premium is less than half of the average risk premium of 370 bps observed between 2015 and 2019. Meanwhile, the cap rate spread between small multifamily assets and the rest of the multifamily sector, a measure of the risk unique to smaller properties, narrowed by 10 bps during the first quarter to finish at 28 bps (Chart 6).
Expense Ratios
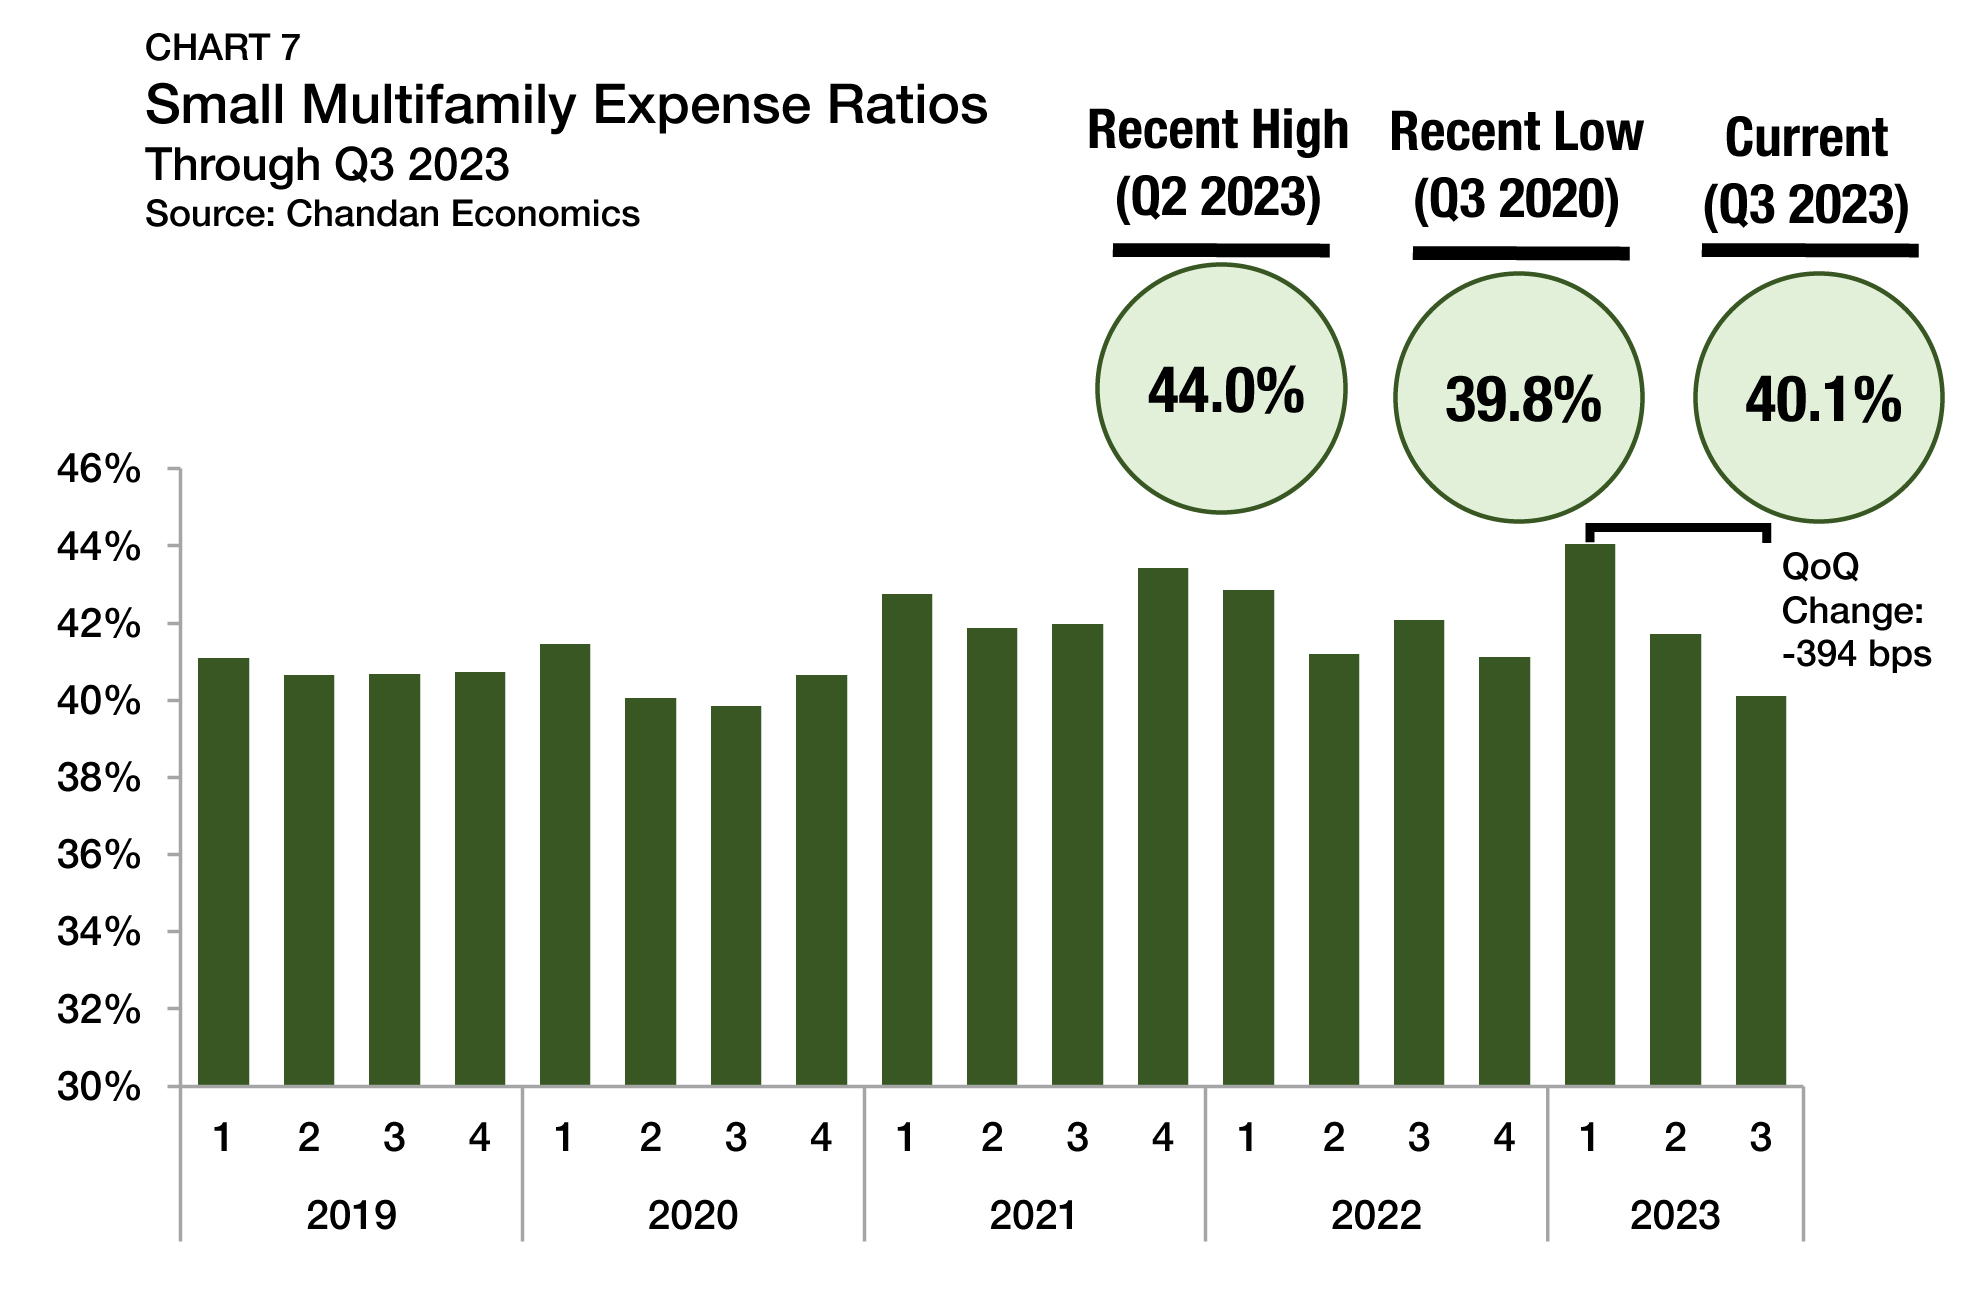
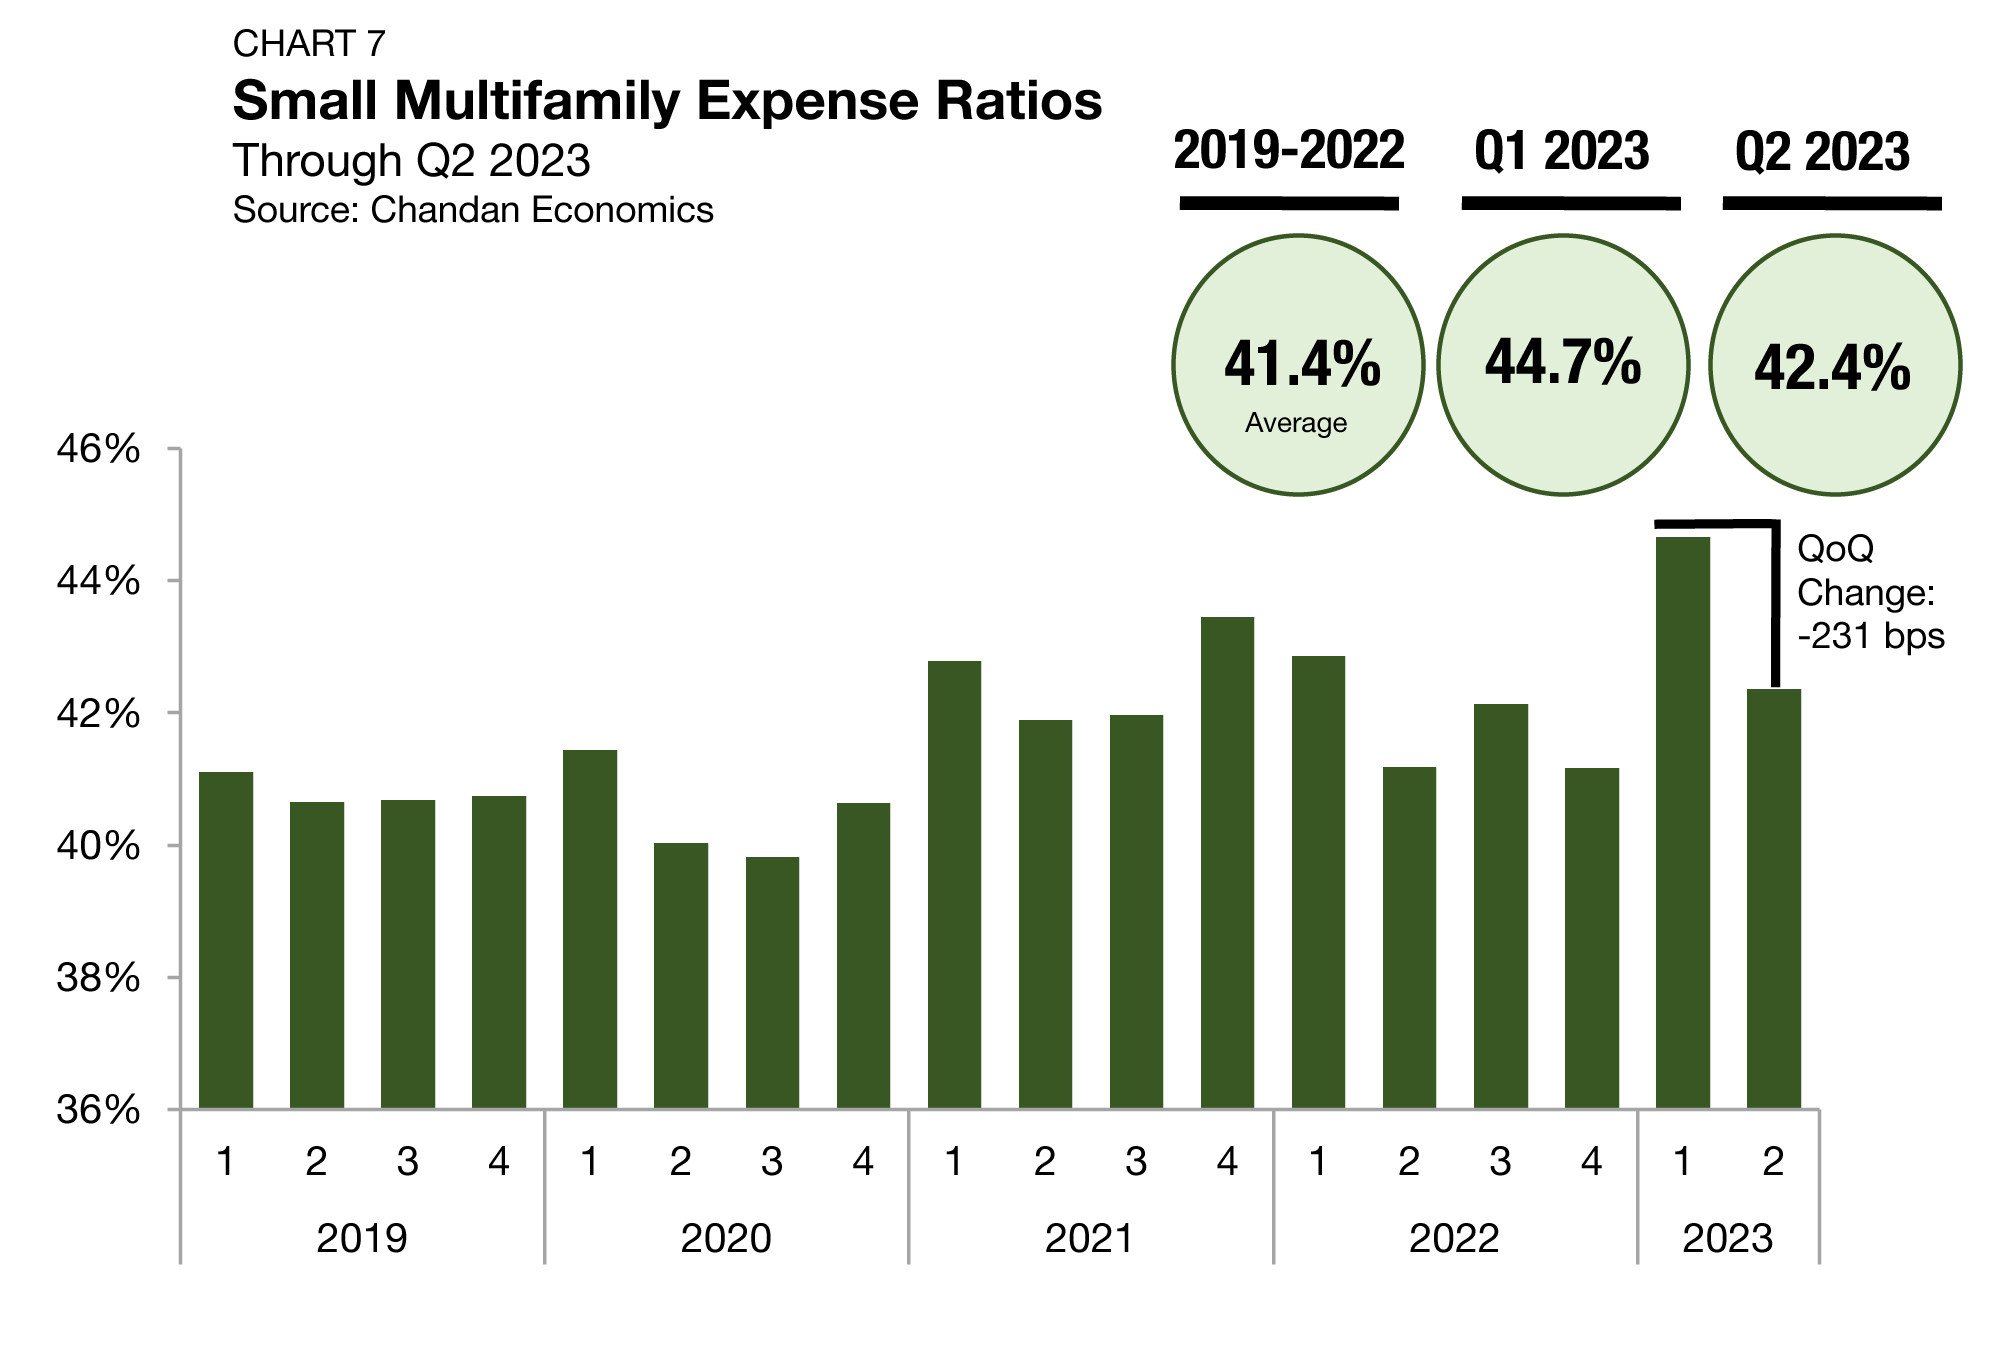
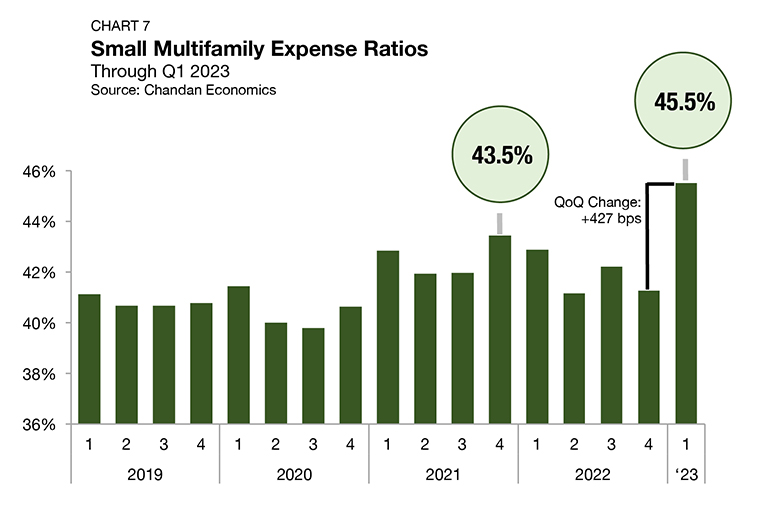
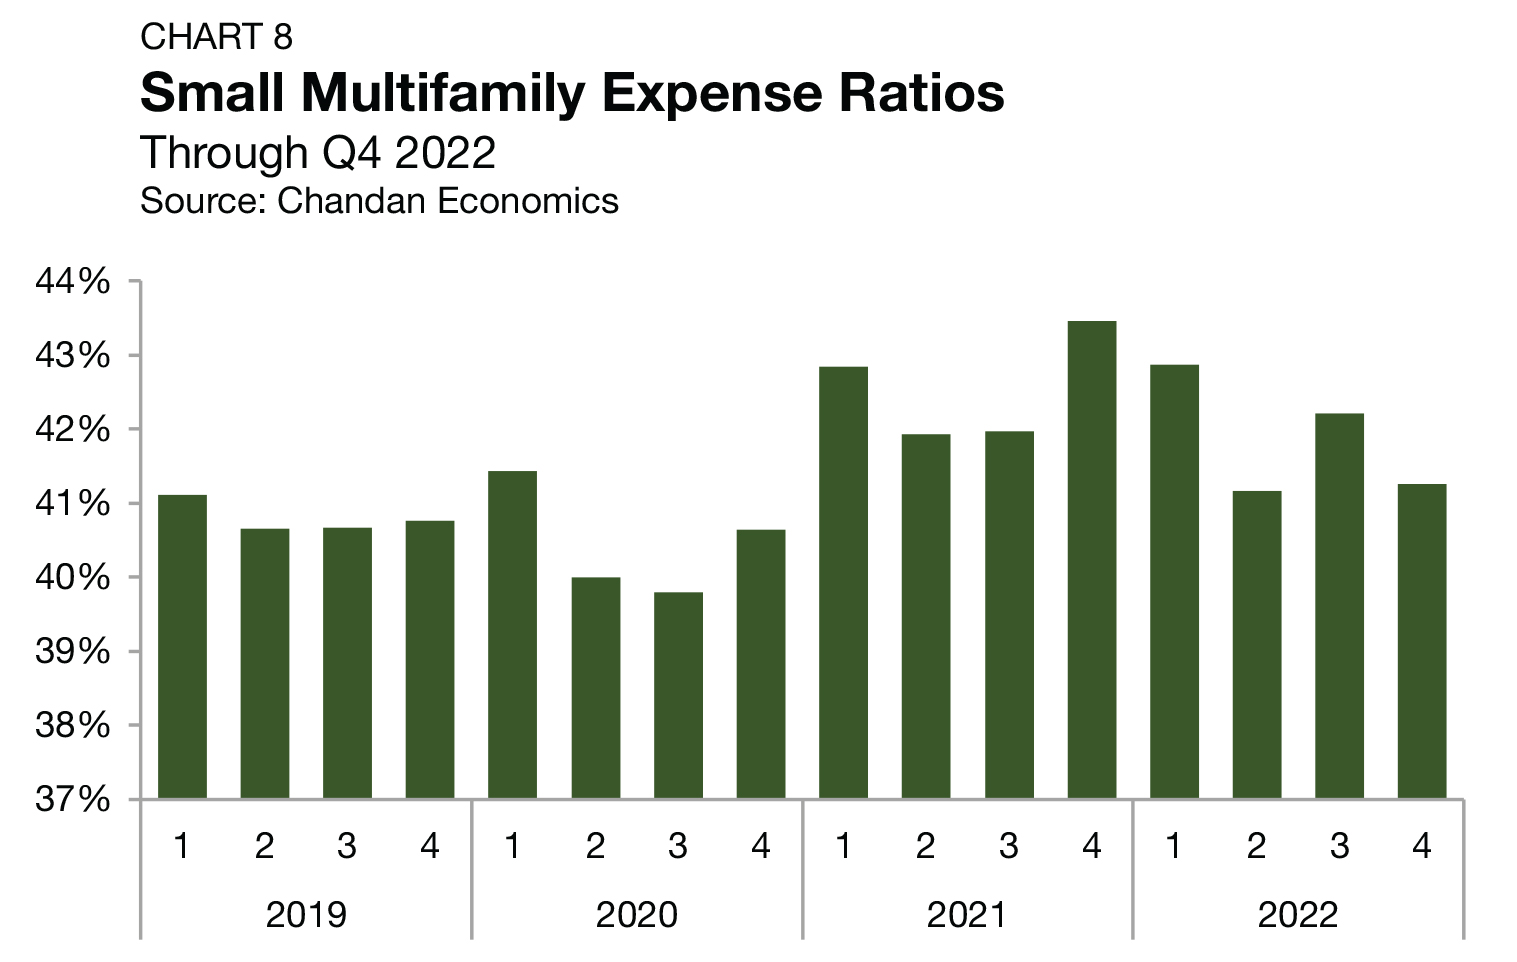
Expense ratios, measured as the relationship between underwritten property-level expenses and effective gross income, have remained stable in recent quarters. In the first quarter of 2024, expense ratios in small multifamily properties receiving financing averaged 40.7% — rising slightly from the 39.7% observed during the prior quarter (Chart 7). Expense ratios peaked at 43.2% in the first quarter of 2023, just as property insurance prices sharply increased. However, expense ratios have quickly come back down to a normal range. Over the past four quarters of available data, expense ratios have deviated by less than a percentage point — ranging between 39.7% and 40.9%.

Occupancy Rates
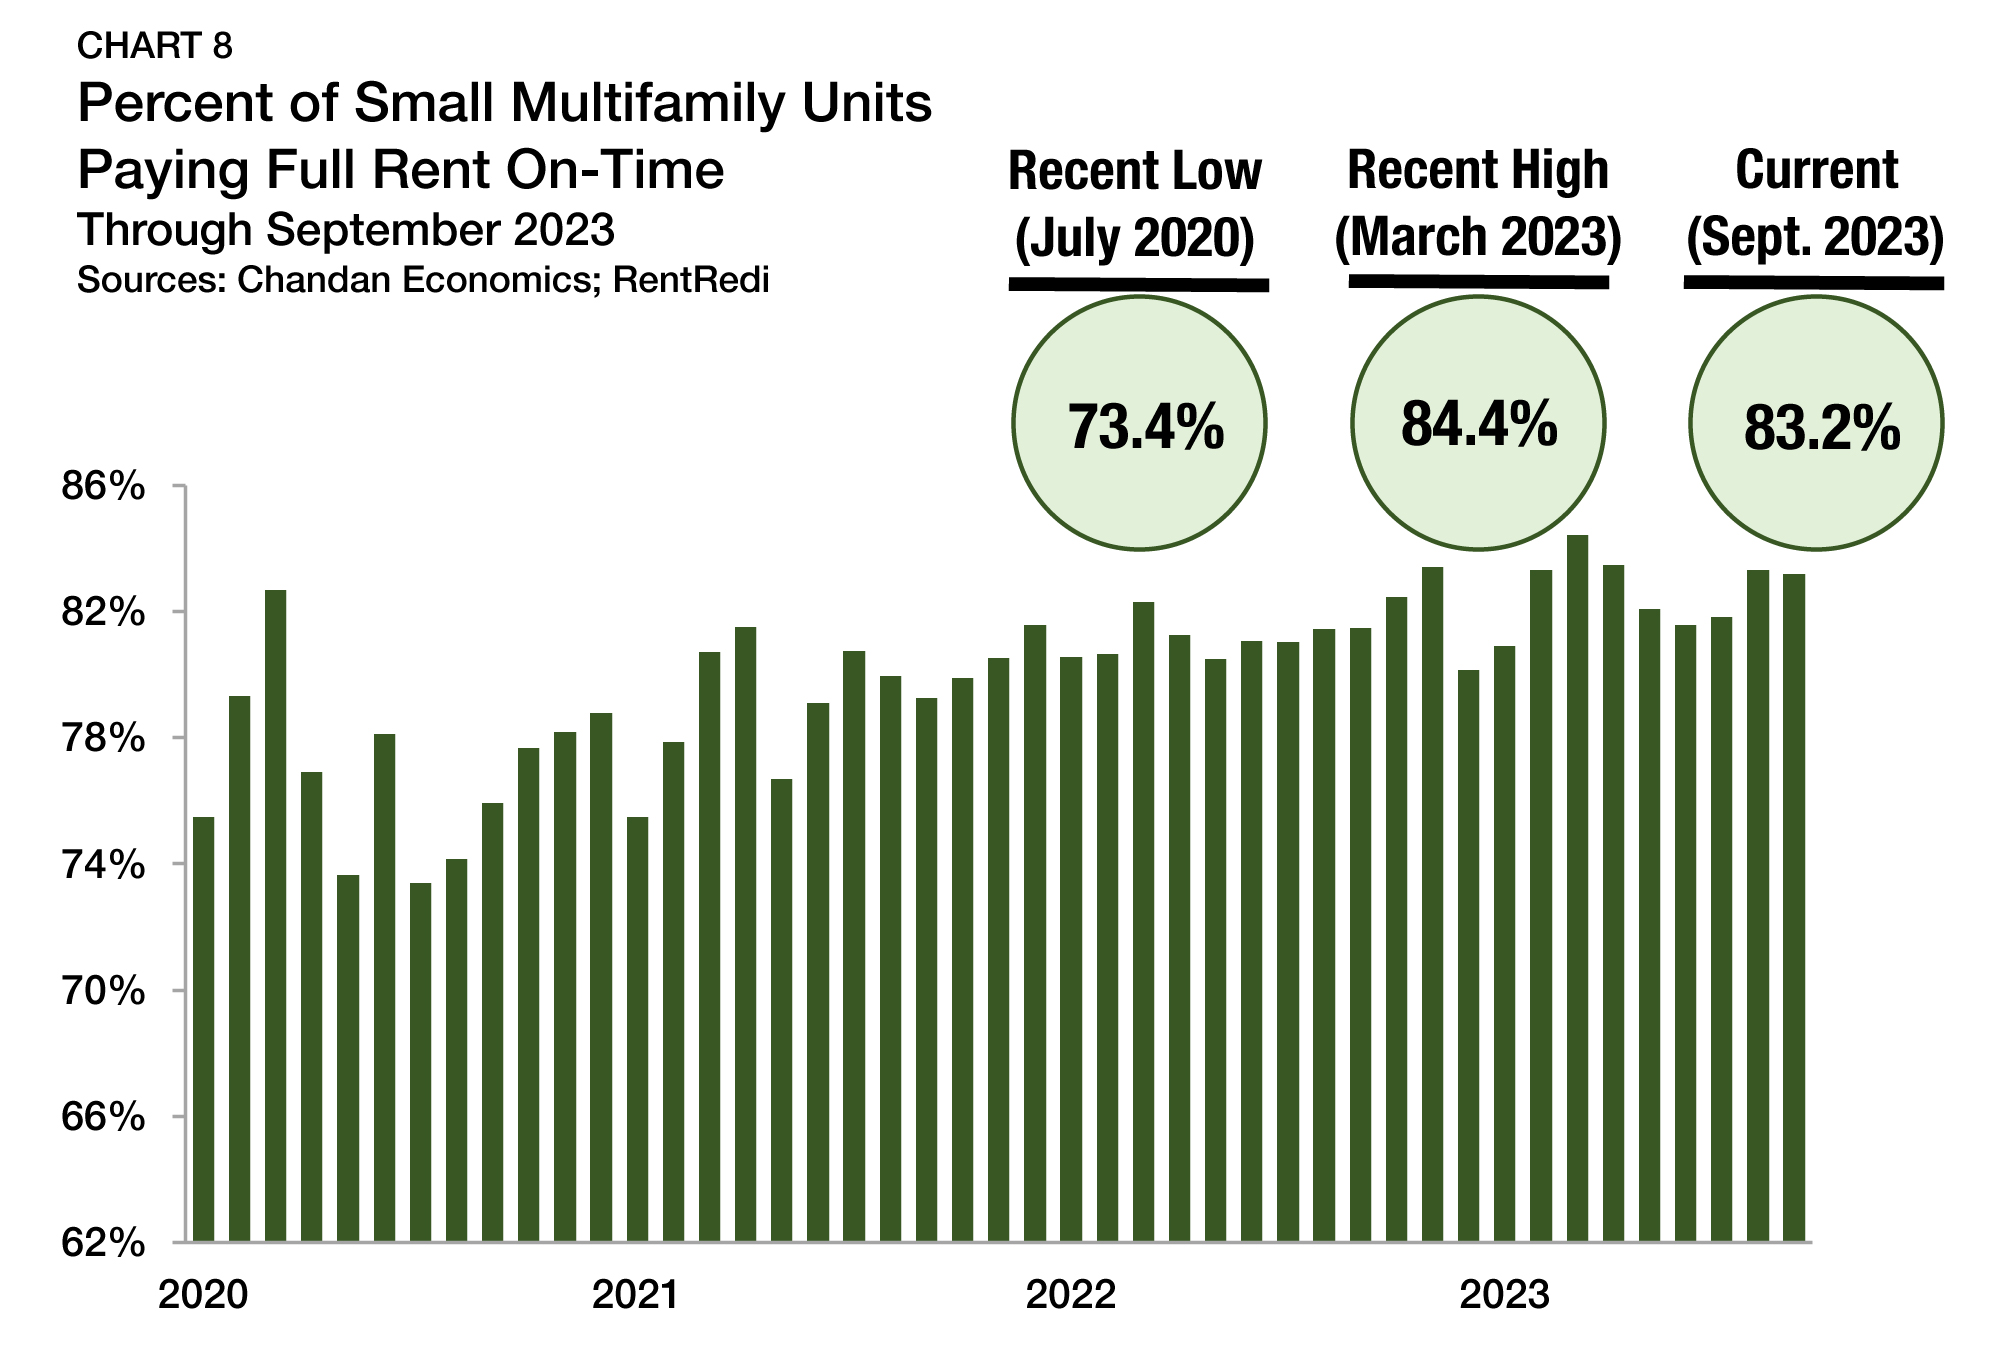
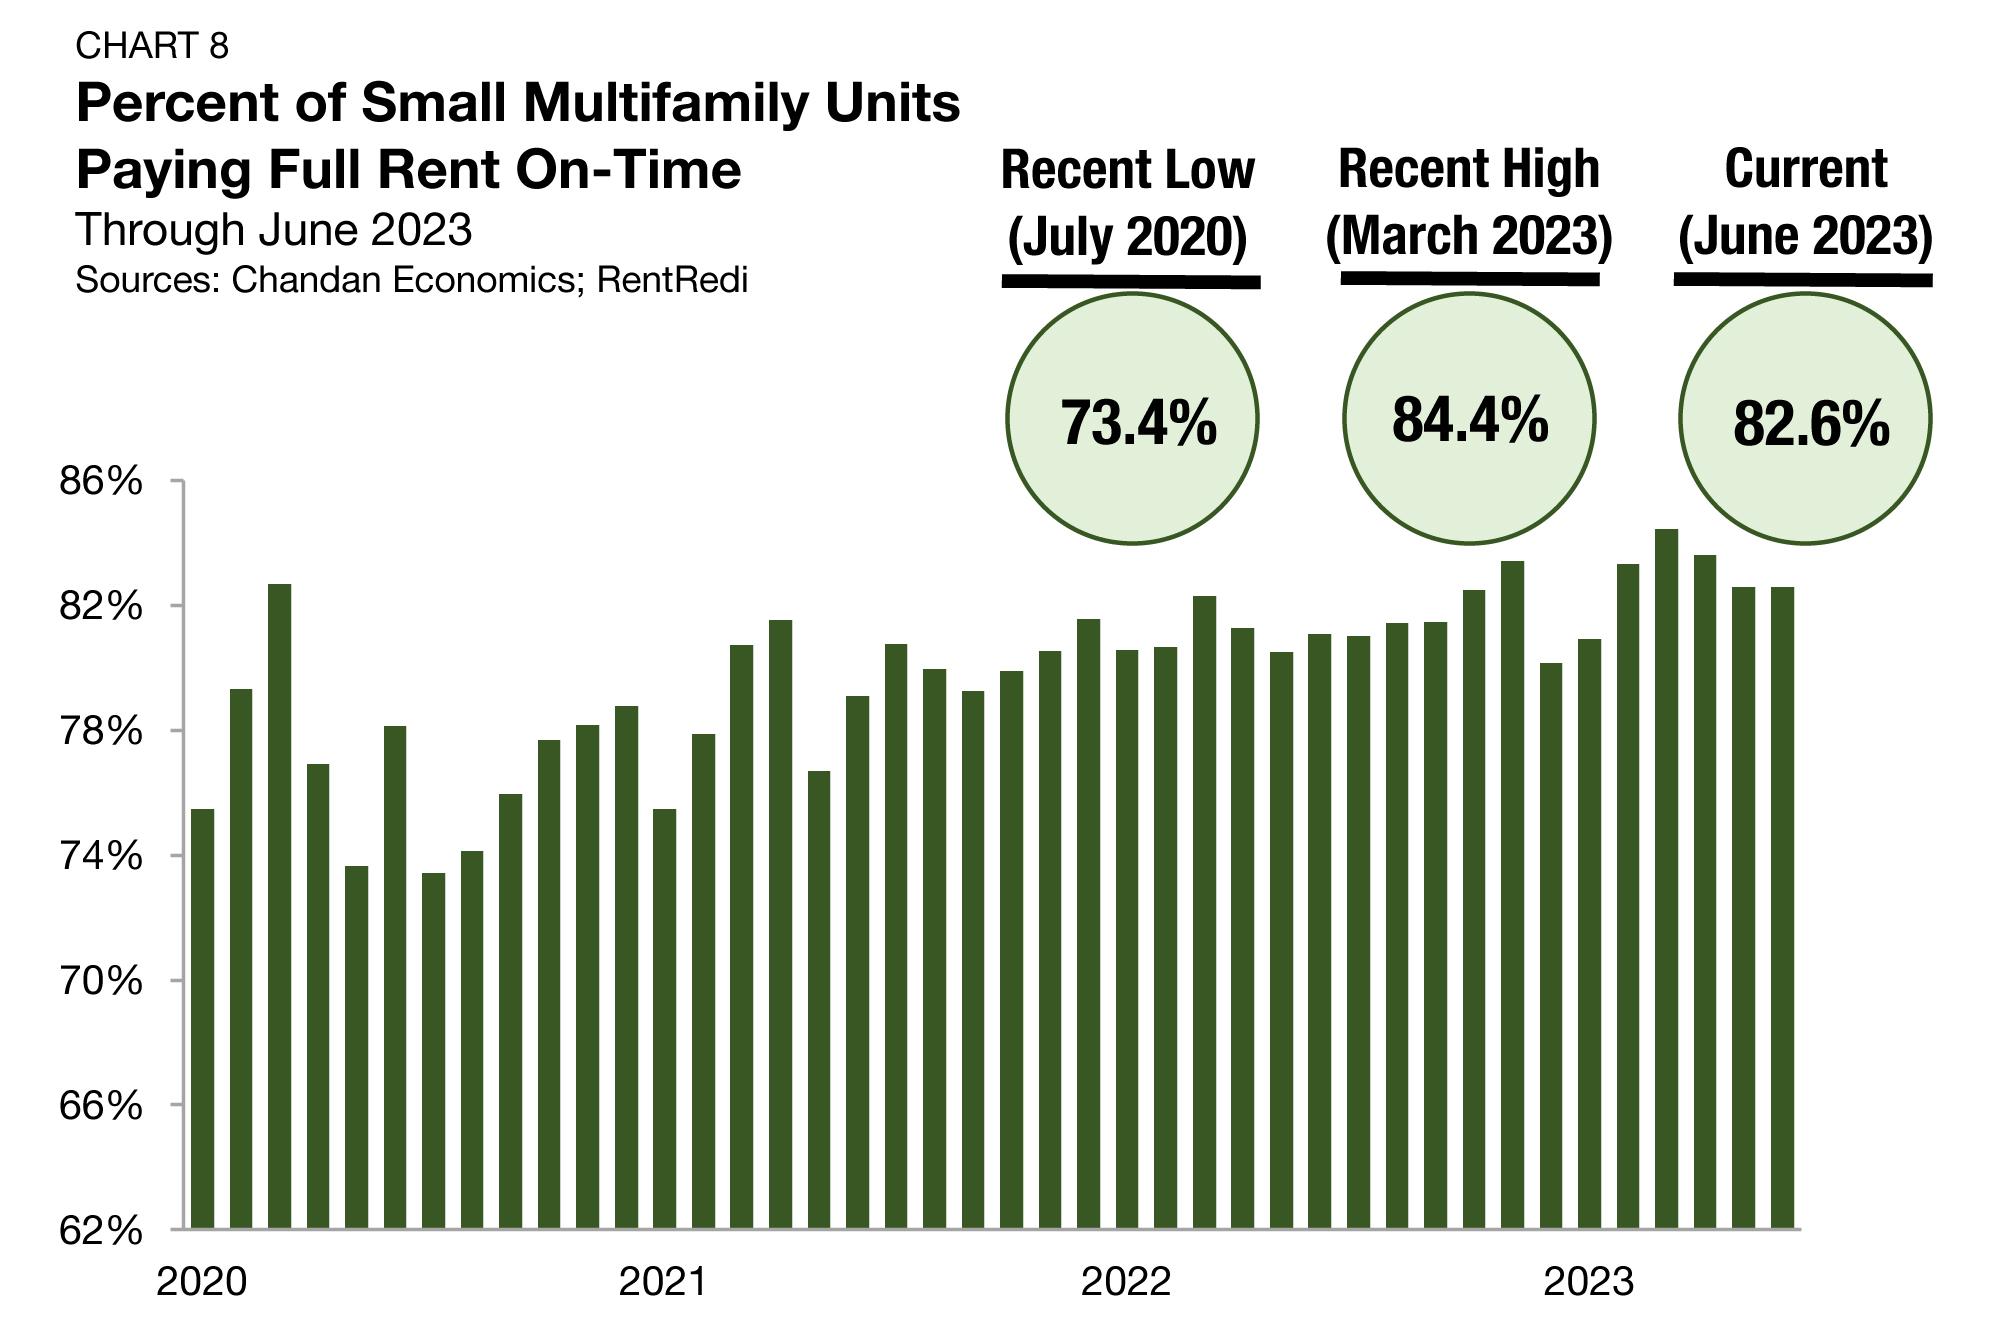
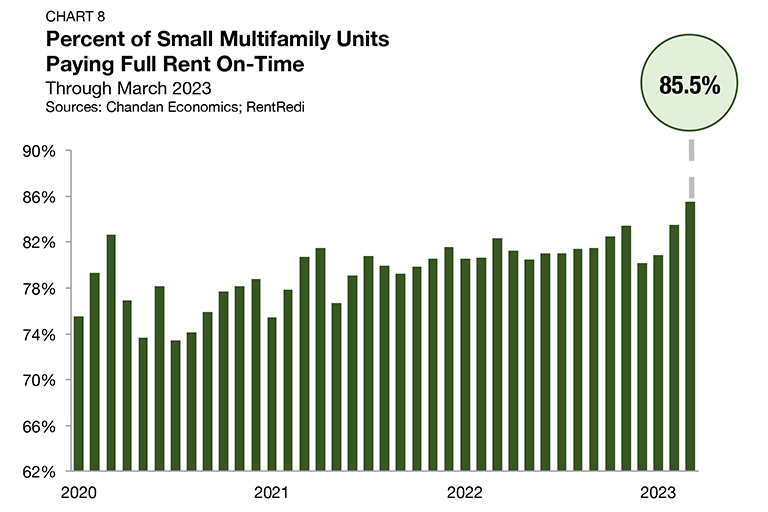
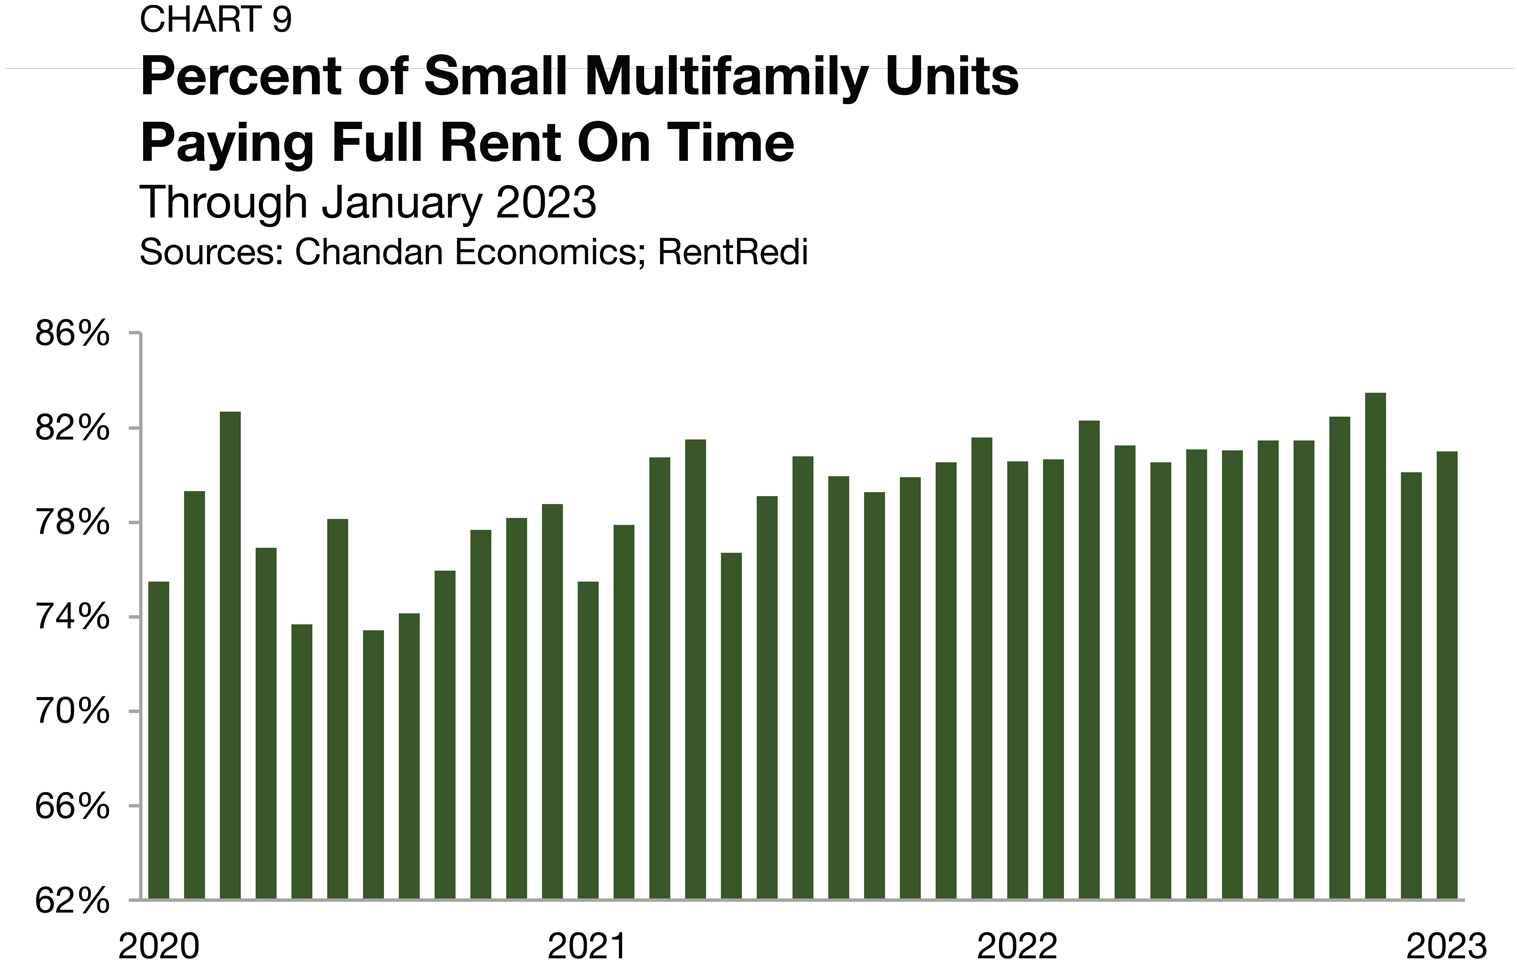
In the first quarter of 2024, small multifamily properties receiving financing had an average occupancy rate of 96.6% (Chart 8). In each of the past two quarters, small multifamily occupancy rates declined, falling 127 bps in total, although they remain slightly higher than where they were a year ago.
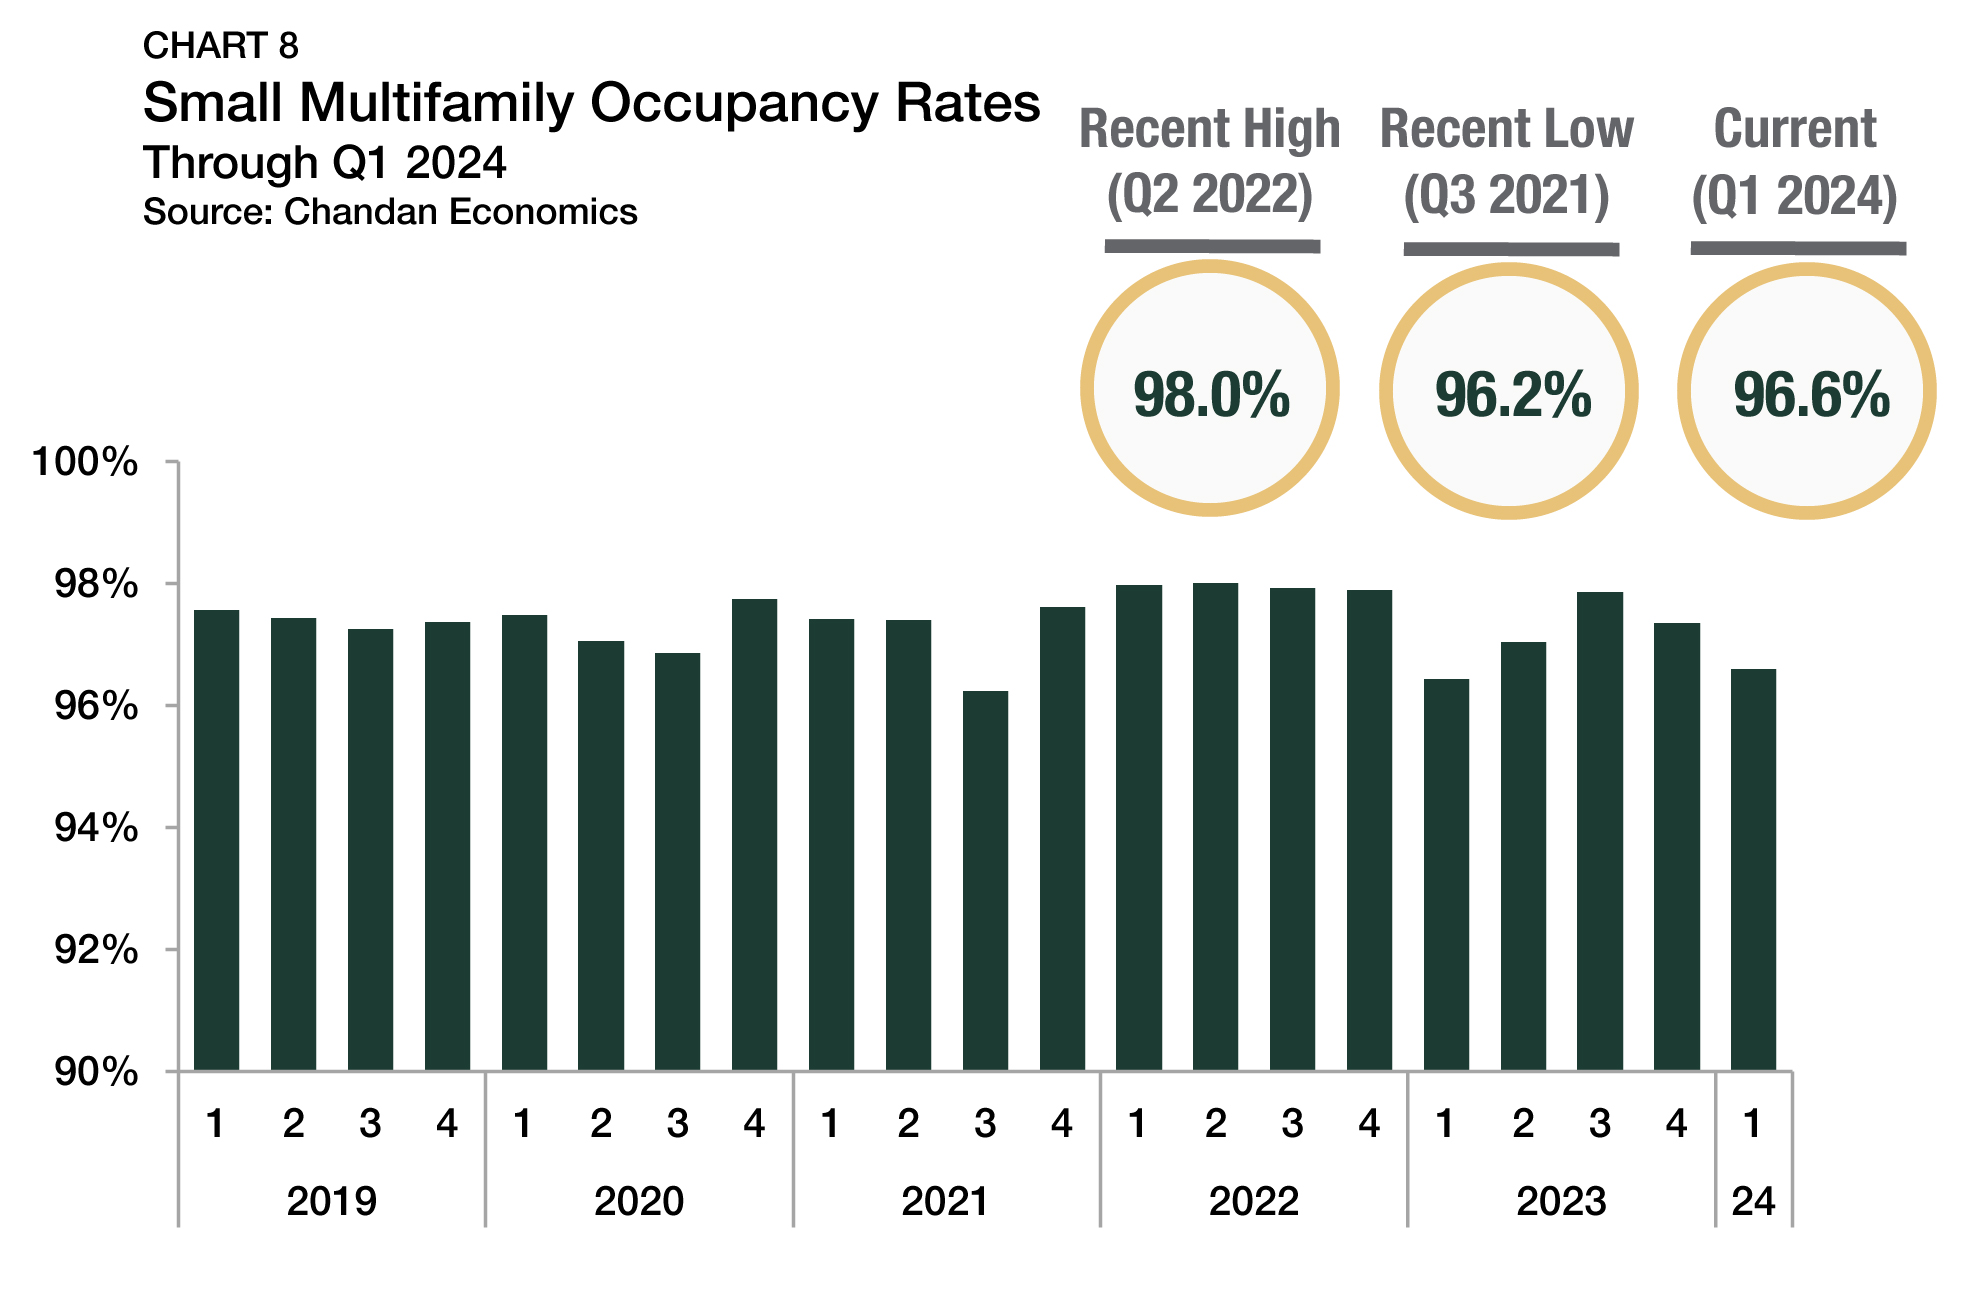
Small multifamily properties have a 2% higher occupancy rate than other types of multifamily real estate. This trend is supported by the relationship-driven nature of small multifamily owners. According to a recent report by the Terner Center for Housing Innovation at UC Berkeley, a majority of small multifamily property owners report that at least half of their rental units were leased at below-market-rate rent prices in an effort to retain quality tenants.
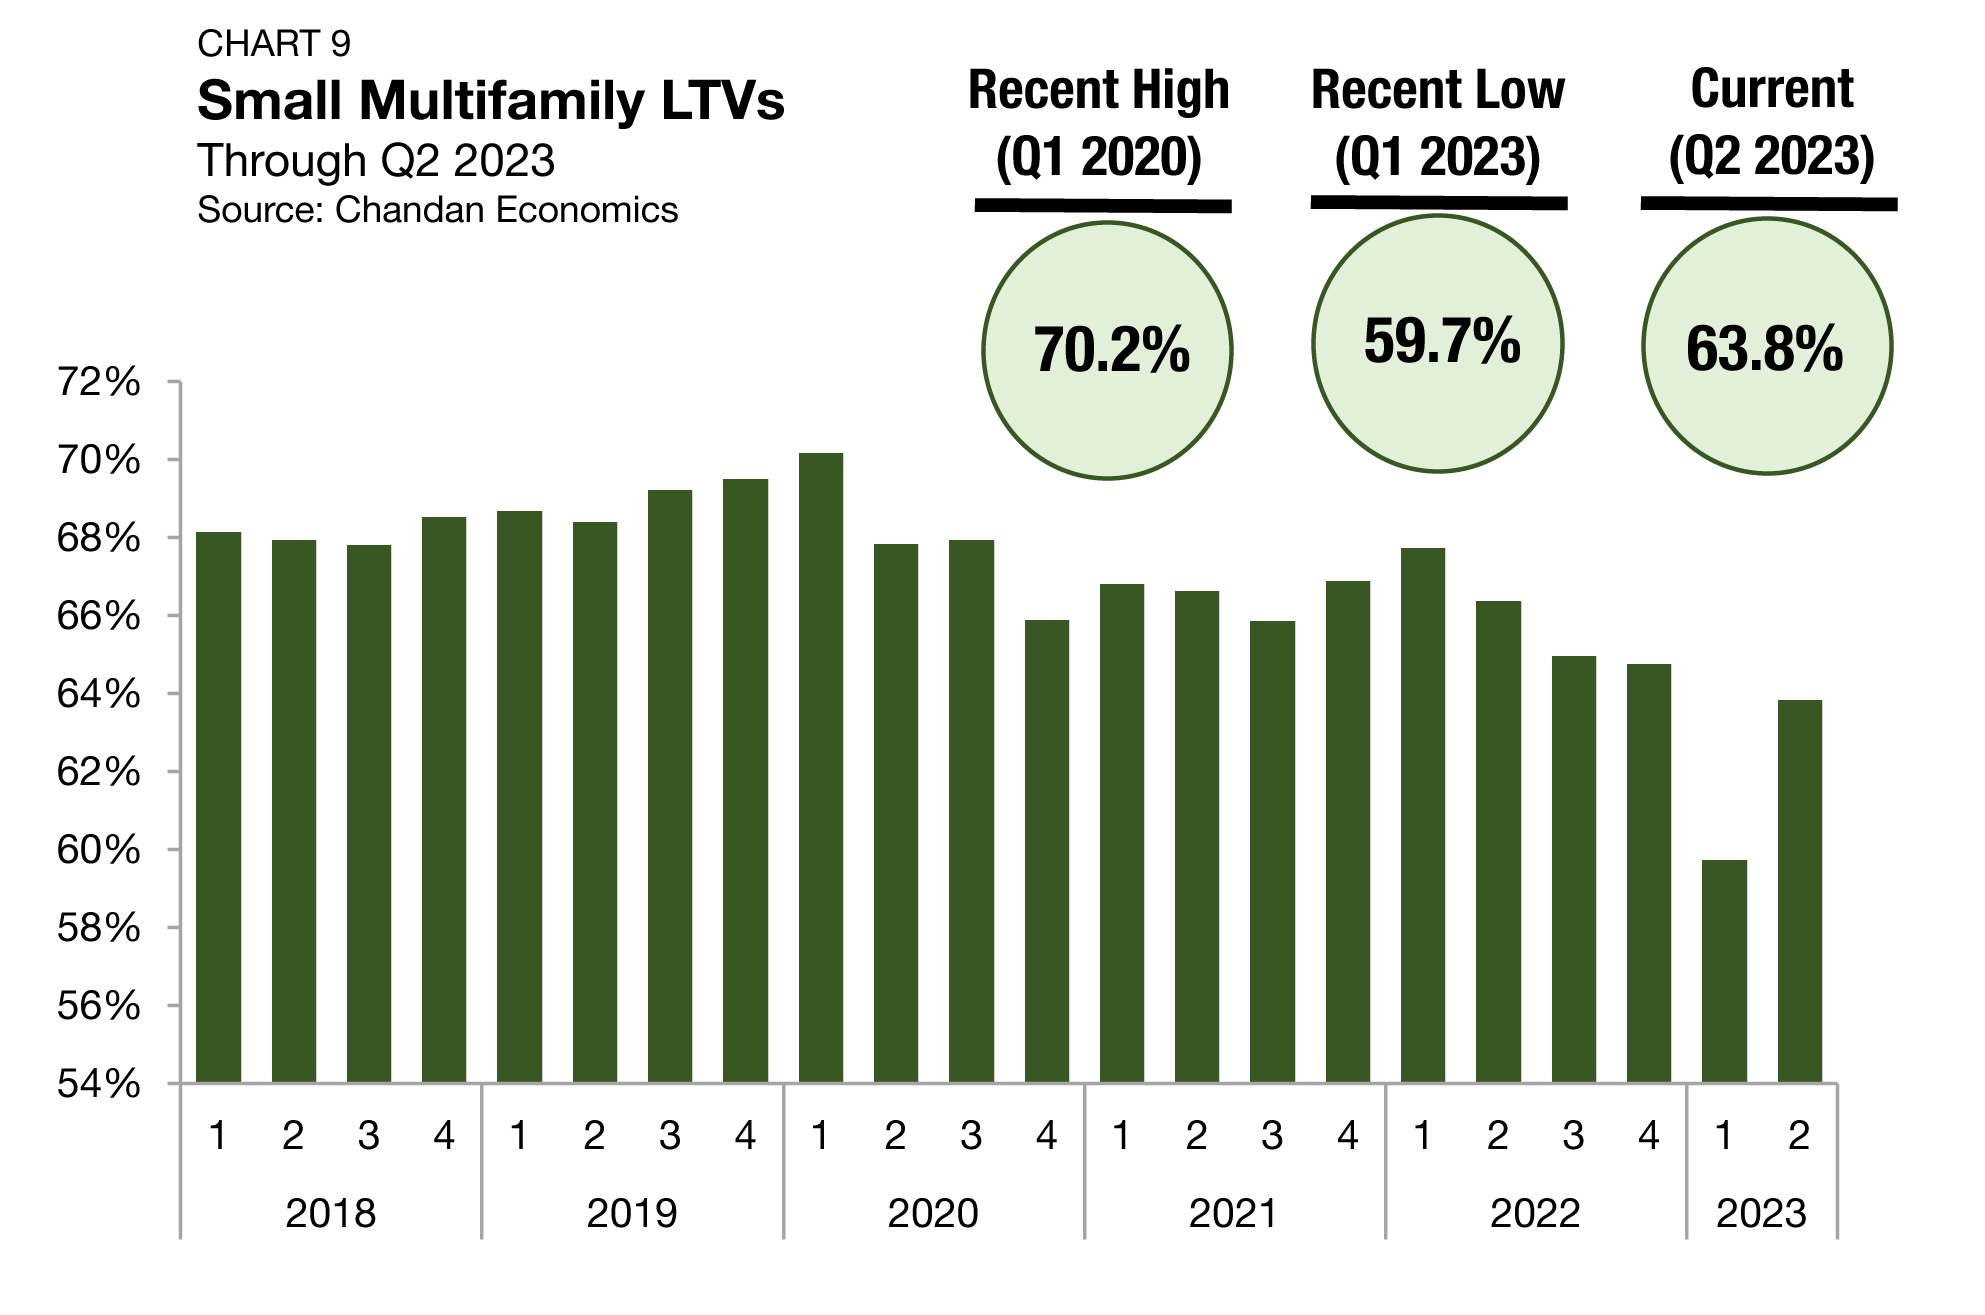
Leverage & Debt Yields
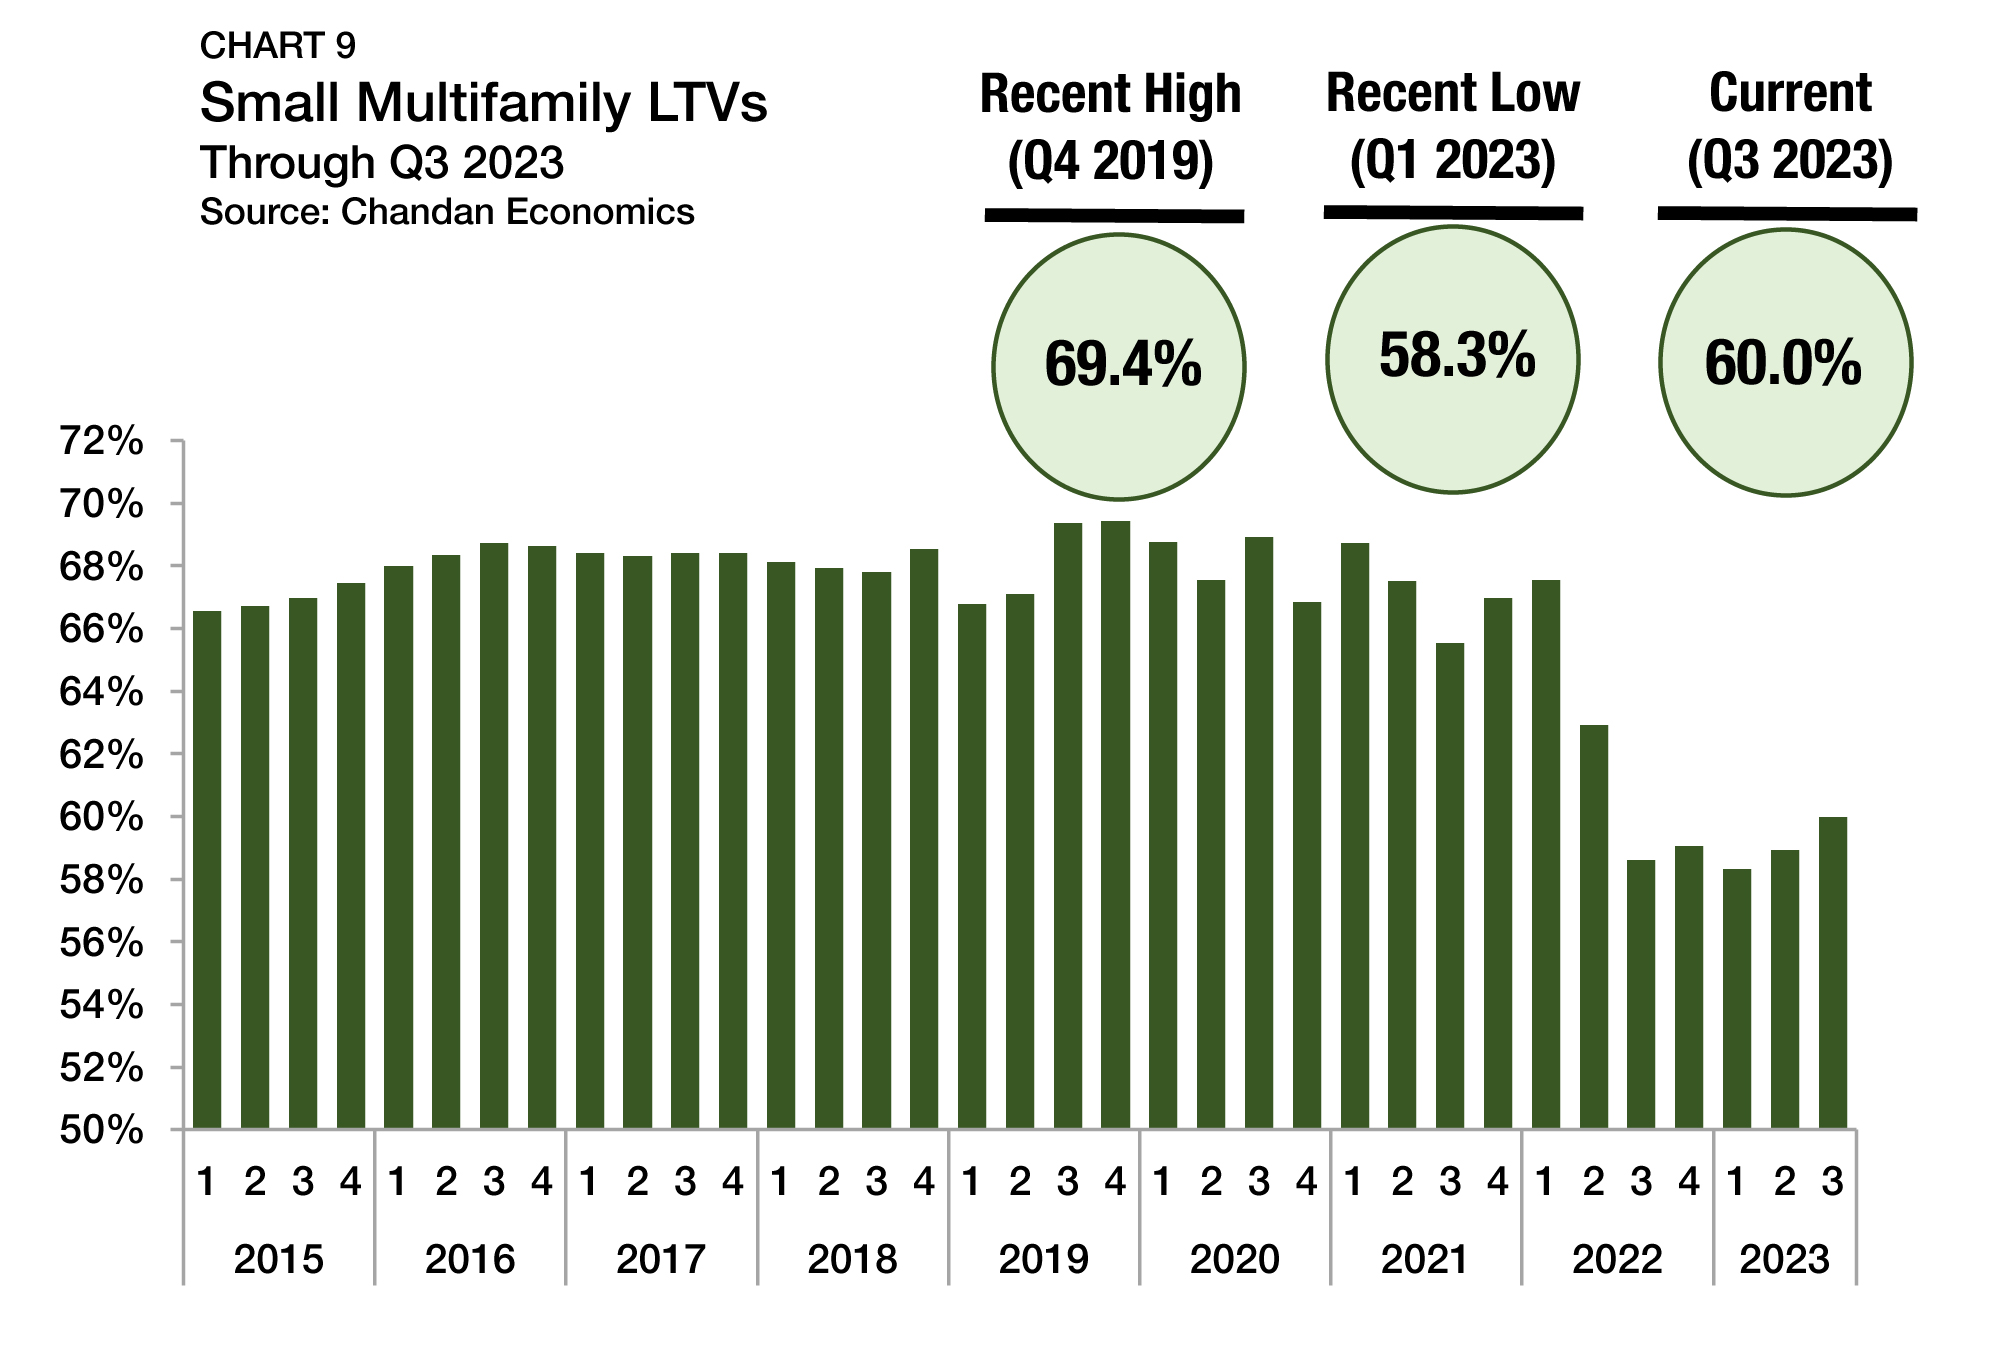
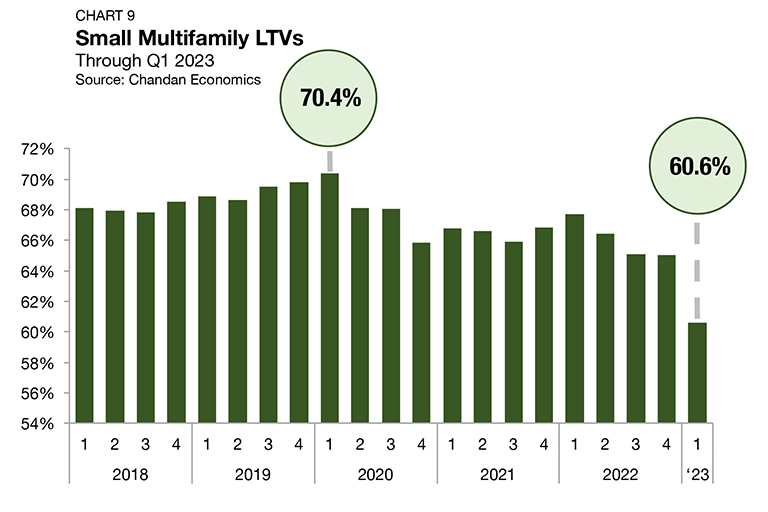
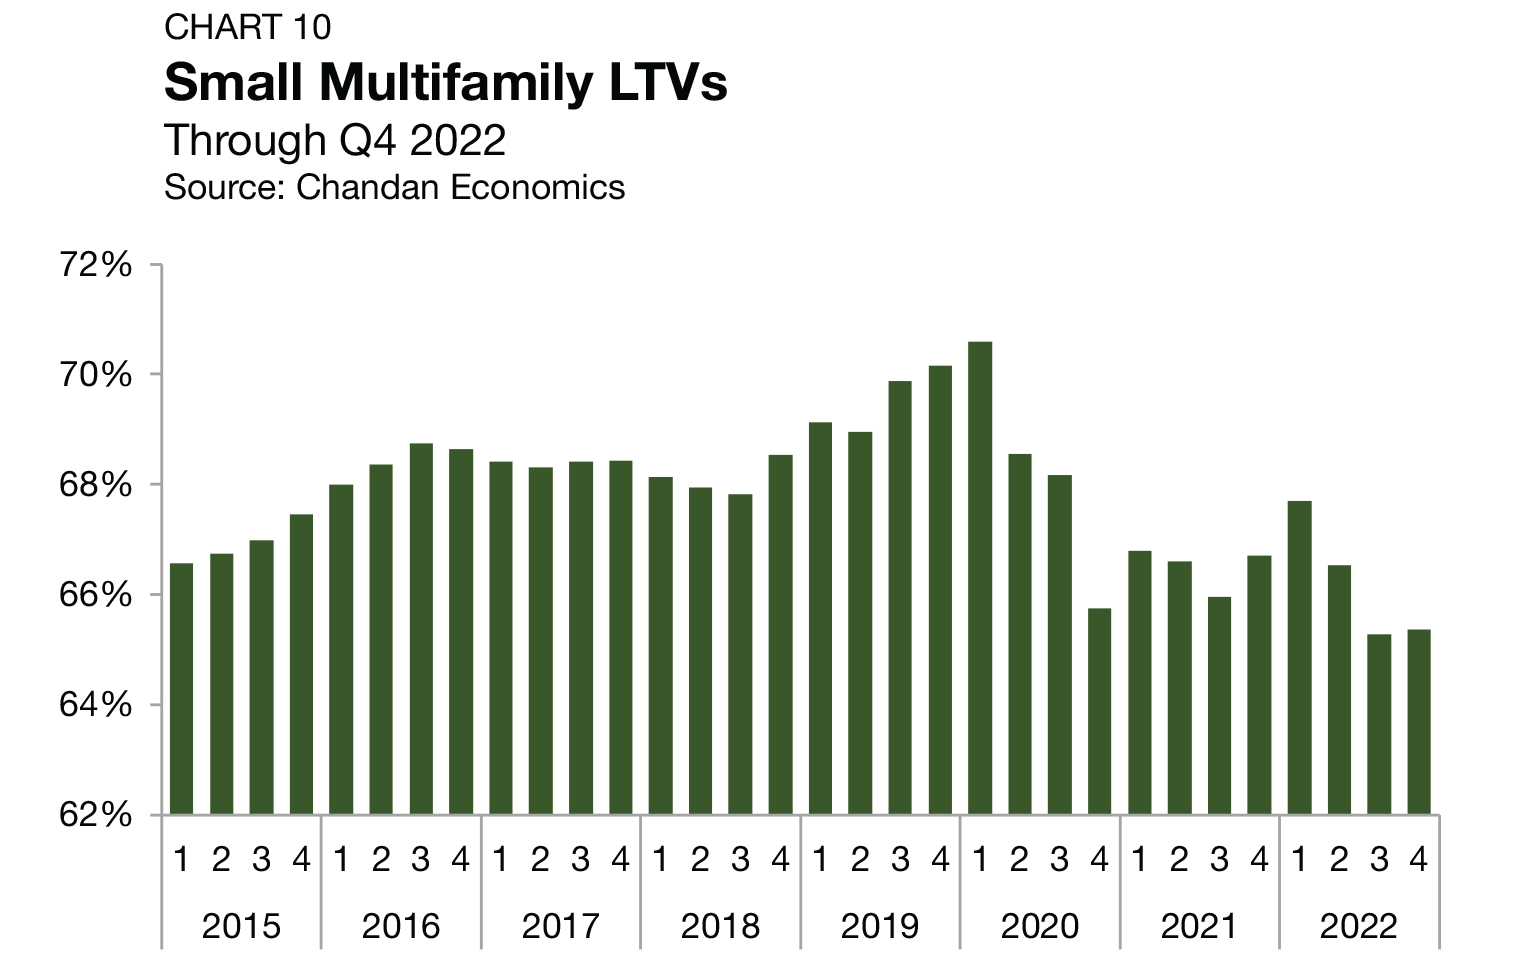
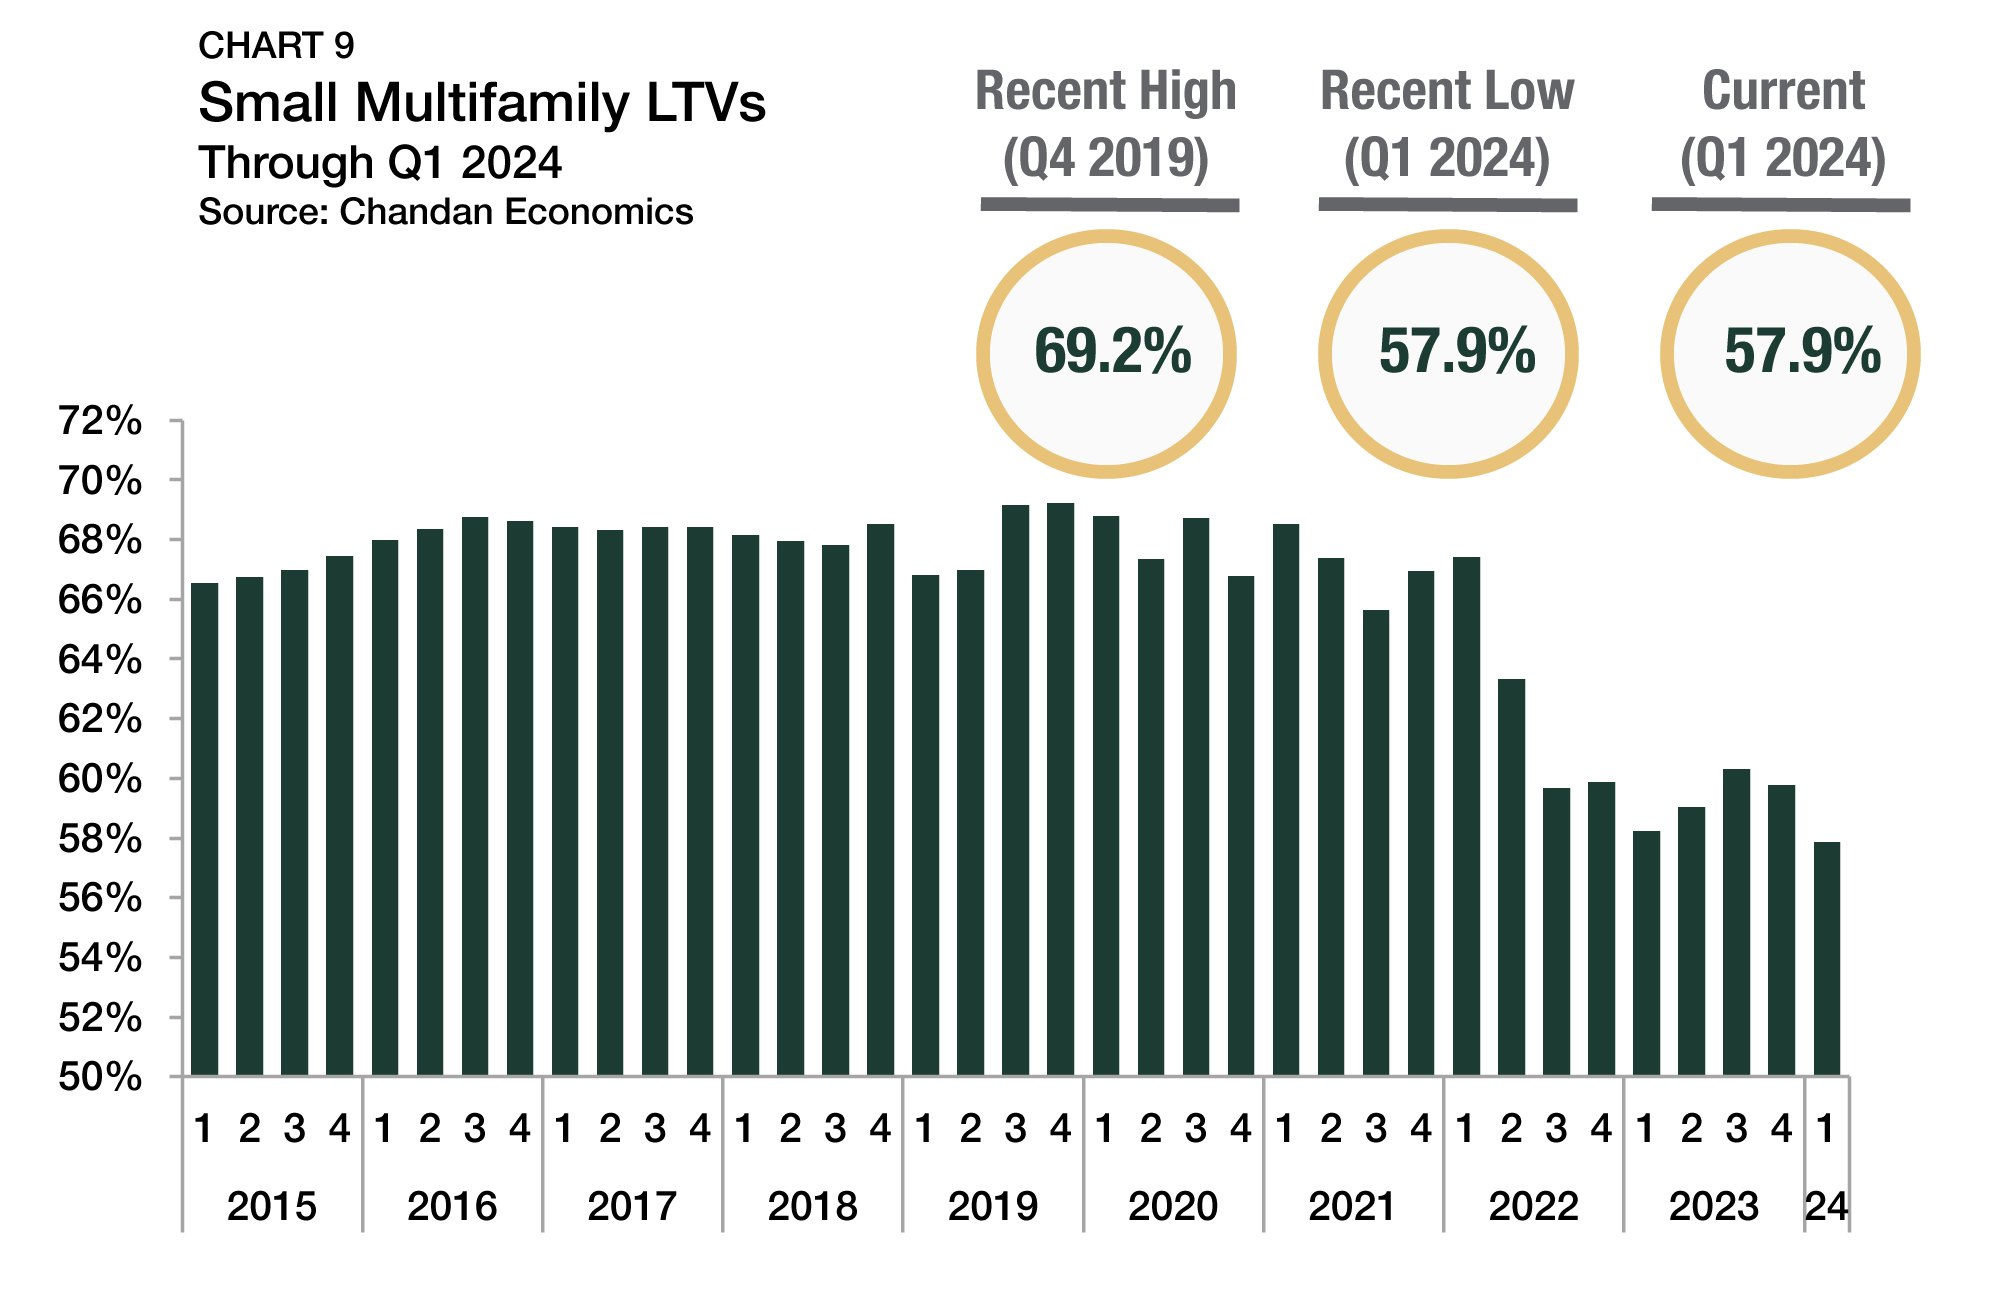
Debt underwriting standards remained tight through the first quarter of 2024. Loan-to-value ratios (LTVs) slid by 179 bps from the previous quarter, settling at 57.9% (Chart 9). Small multifamily LTVs have generally declined since the onset of the pandemic. After hitting a record high of 69.2% in the fourth quarter of 2019, they have dropped in 11 of 17 quarters. In that time, average LTVs have decreased by 11.4 percentage points, highlighting that lenders require more substantial equity cushions when trends in valuations are volatile.
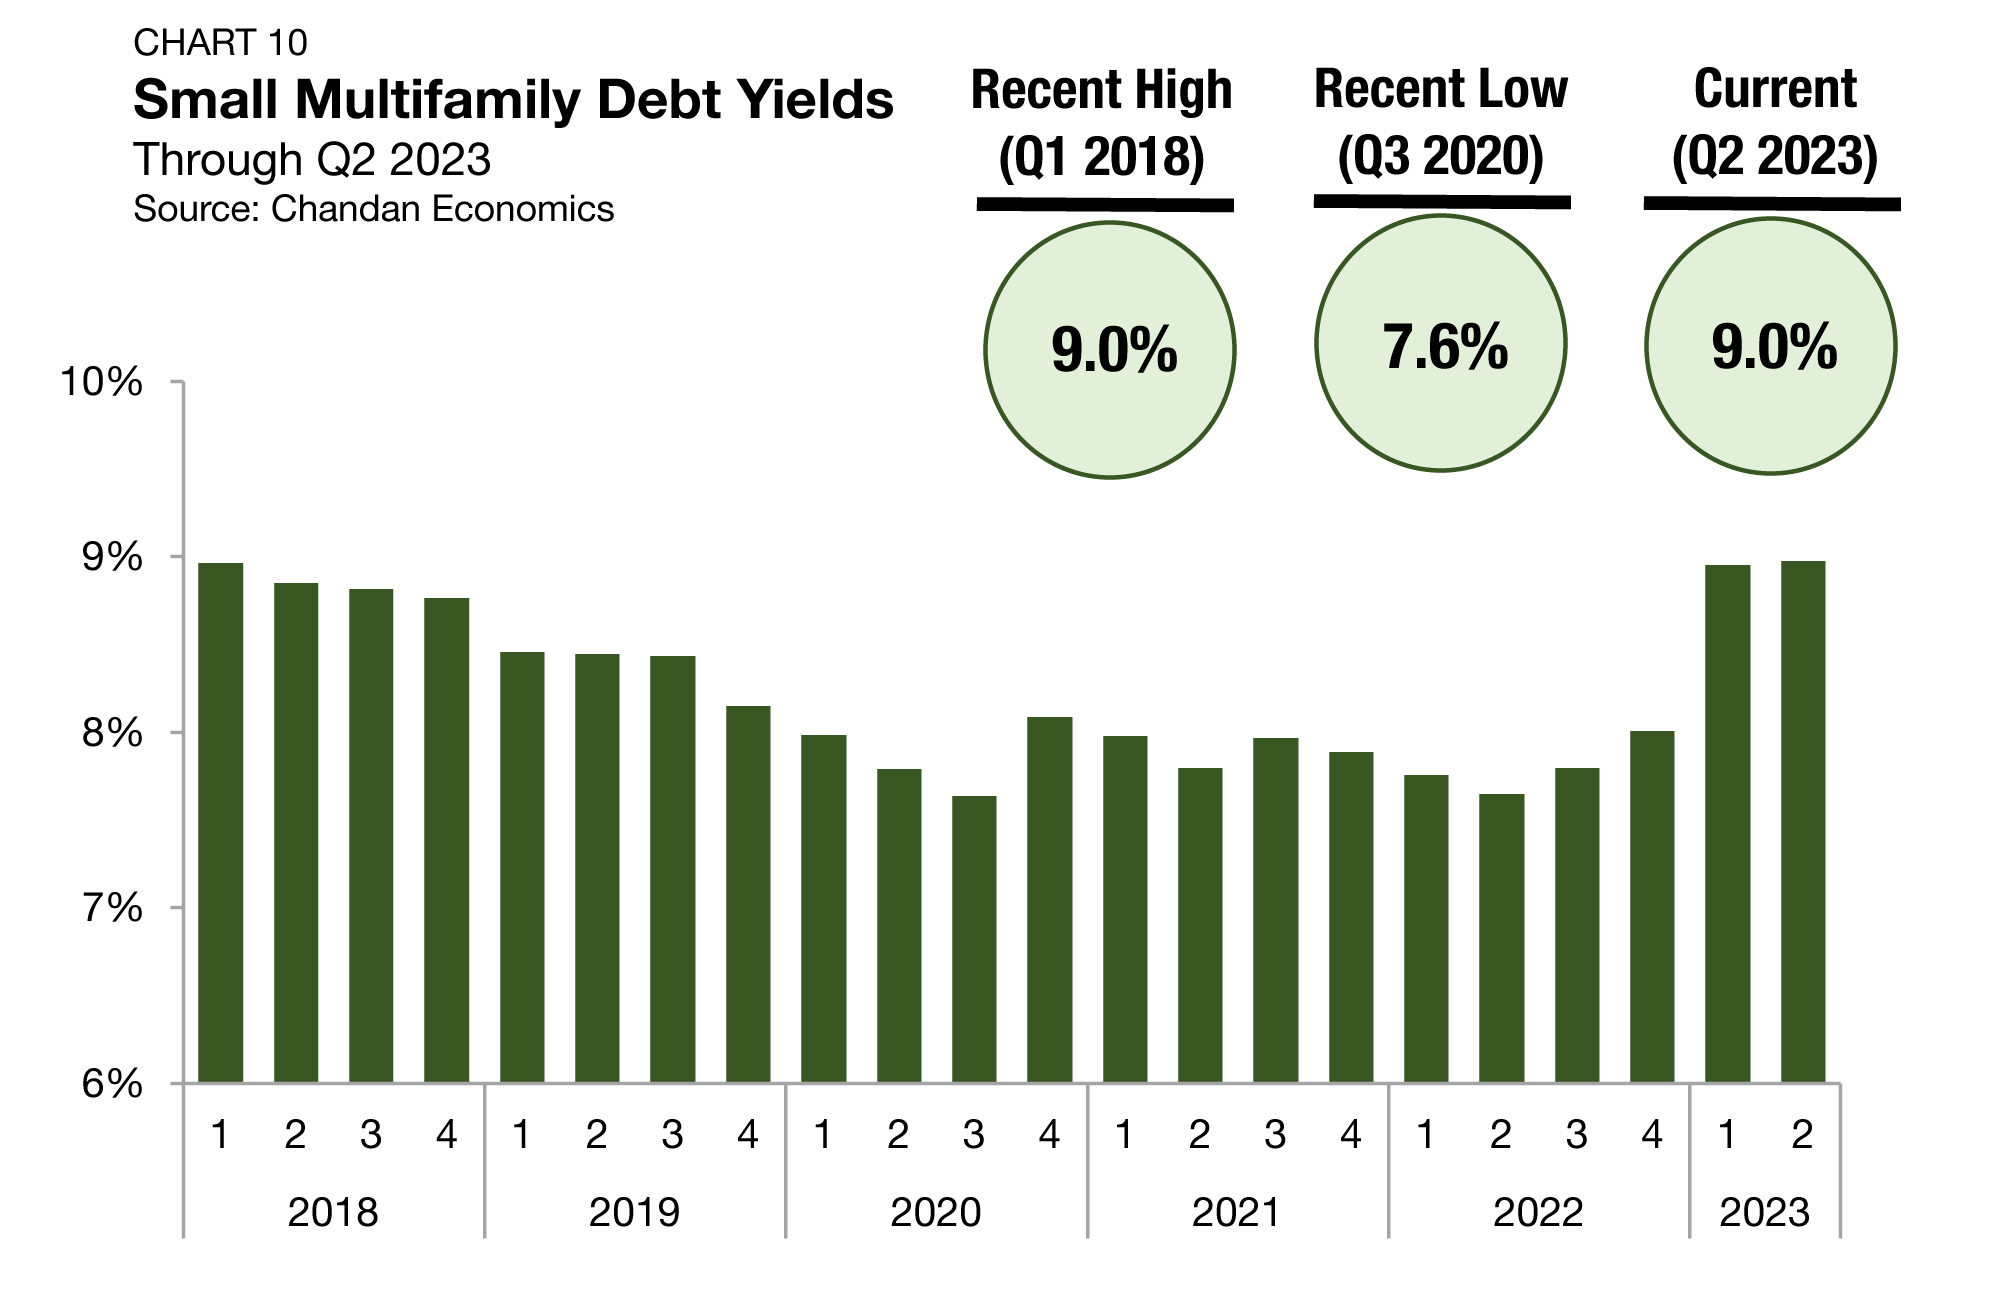
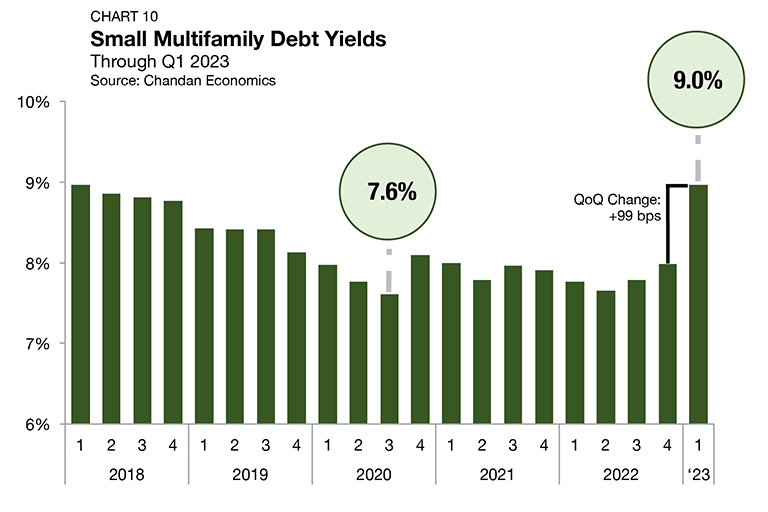
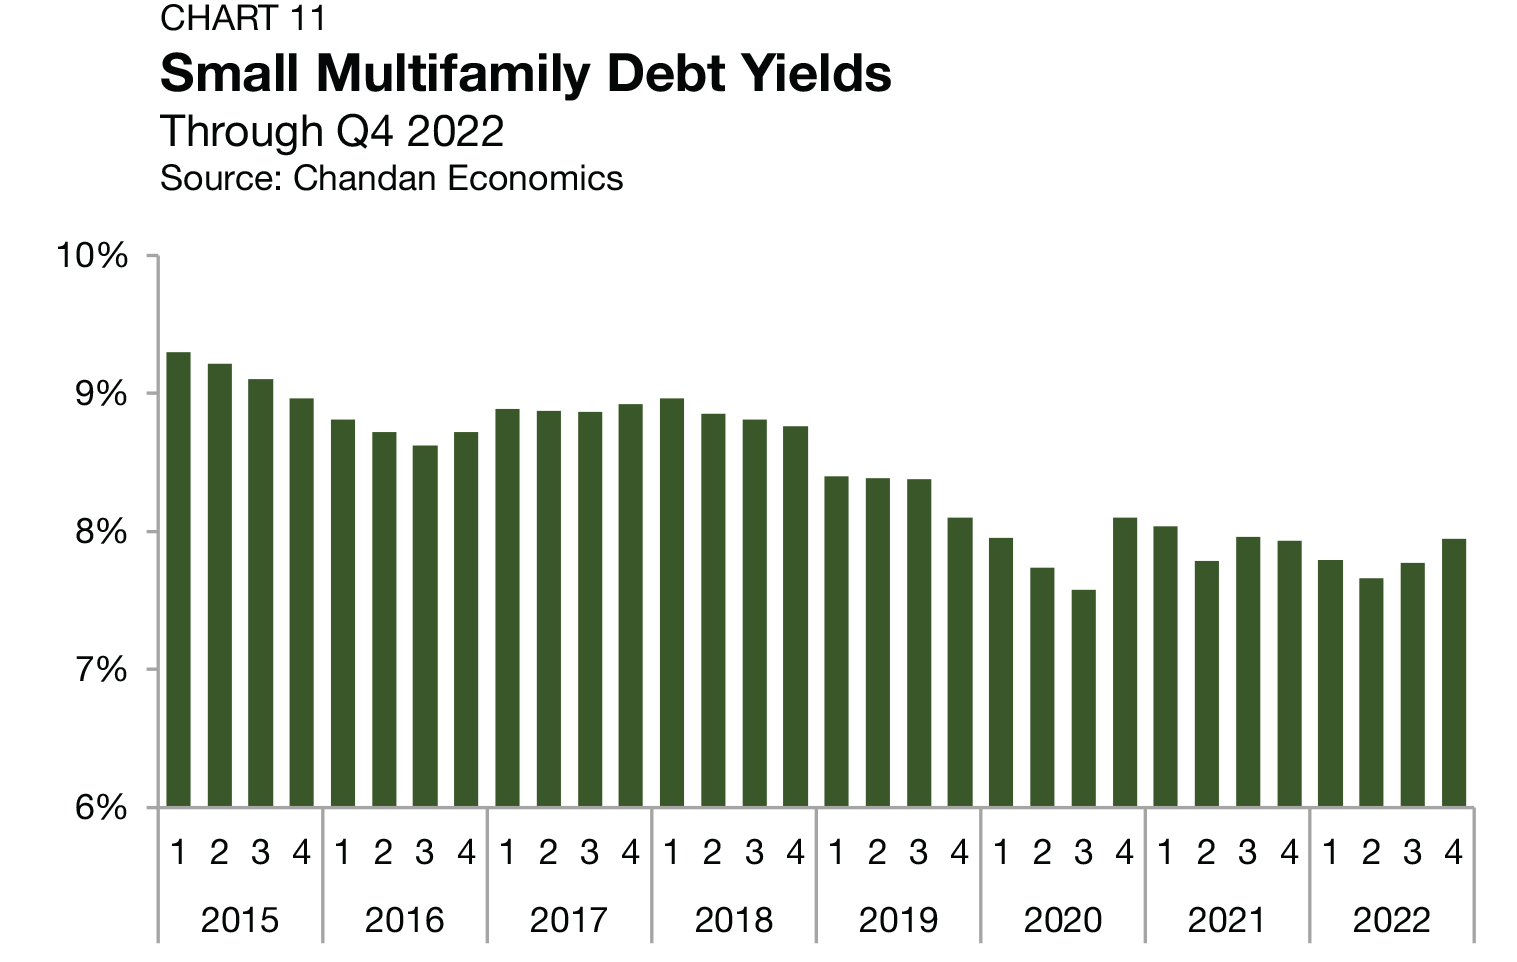
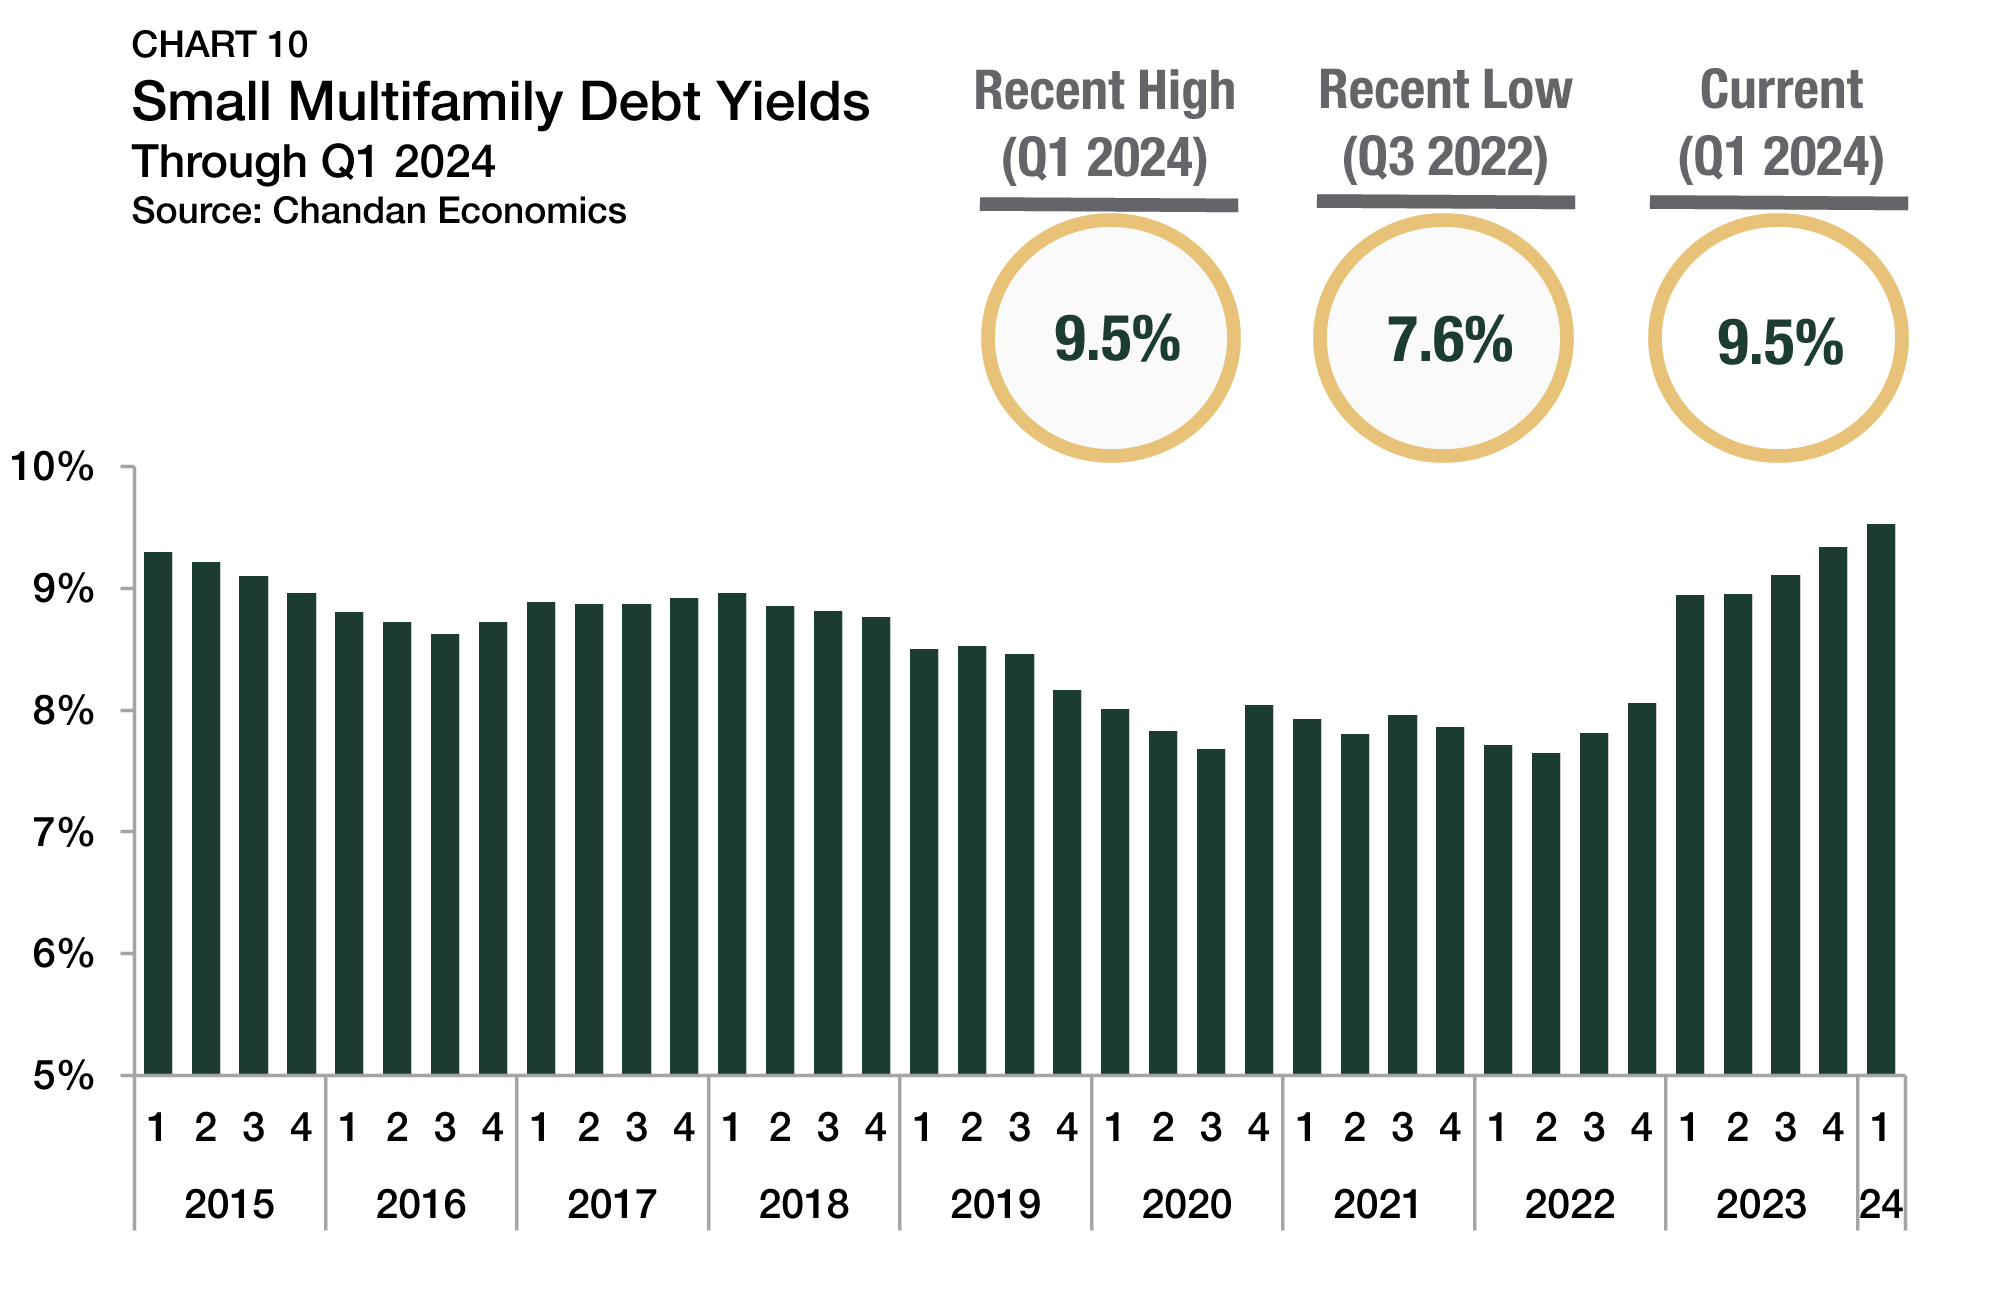
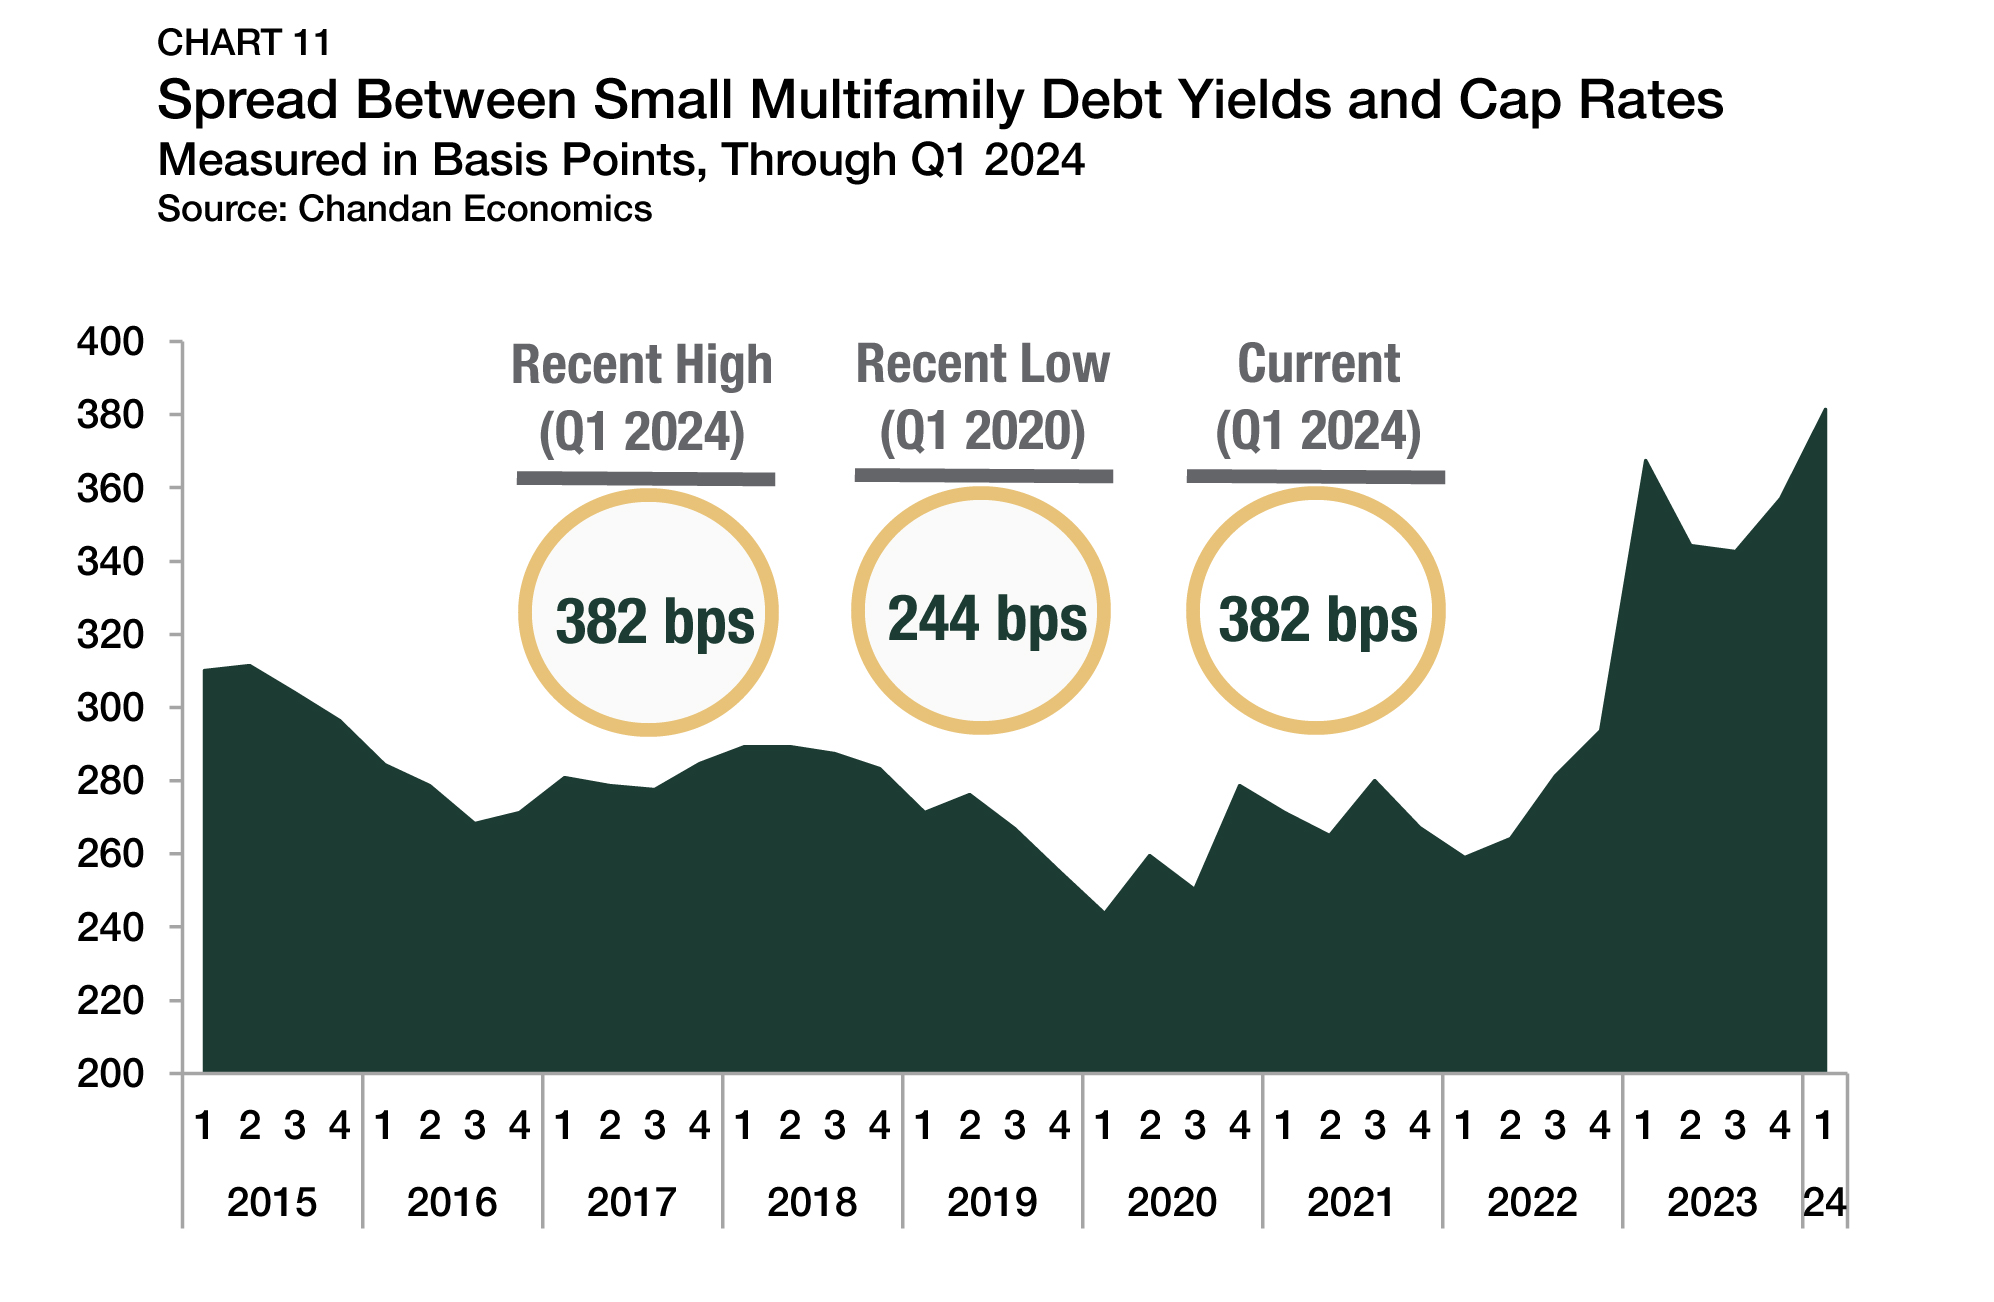
Average debt yields for small multifamily loans continued climbing higher in the first quarter of 2024, reaching 9.5% (Chart 10). Small multifamily debt yields have risen in each of the past seven quarters, hitting their highest point in nearly a decade. While cap rates and debt yields are higher than a year ago, debt yields have increased more substantially. In the first quarter of 2024, the spread between debt yields and cap rates widened to 382 bps — the most significant difference since 2013 (Chart 11).
The inverse of debt yields, the debt per dollar of net operating income (NOI), for small multifamily loans fell again in the first quarter of 2024. Small multifamily borrowers secured an average of $10.49 in new debt for every $1.00 of property NOI, a decline of $0.21 from the previous quarter and its lowest level since 2014.
Outlook
The small multifamily subsector’s stronger-than-average occupancy rates provide a stable foundation that will allow property owners to hold steady through the current high interest rate environment. As evidenced by the recent stabilization of asset prices and cap rates, as well as an uptick in large investor buying activity, there is growing confidence that the sector is rebounding from its cyclical bottom. For the small multifamily sector, interest rate headwinds will likely create a bumpy road to recovery in 2024, but smoother pavement lies ahead.
For more small multifamily research and insights, visit arbor.com/articles
Disclaimer
All content is provided herein “as is” and neither Arbor Realty Trust, Inc. or Chandan Economics, LLC (“the Companies”) nor their affiliated or related entities, nor any person involved in the creation, production and distribution of the content make any warranties, express or implied. The Companies do not make any representations regarding the reliability, usefulness, completeness, accuracy, currency nor represent that use of any information provided herein would not infringe on other third party rights. The Companies shall not be liable for any direct, indirect or consequential damages to the reader or a third party arising from the use of the information contained herein.