Small Multifamily Investment Trends Report Q1 2022
Cap rates hold steady as valuations accelerate into Spring 2022
Key Findings
- Small multifamily originations are on pace to hit $64.4 billion in 2022, declining from a record-setting 2021 yet remaining elevated.
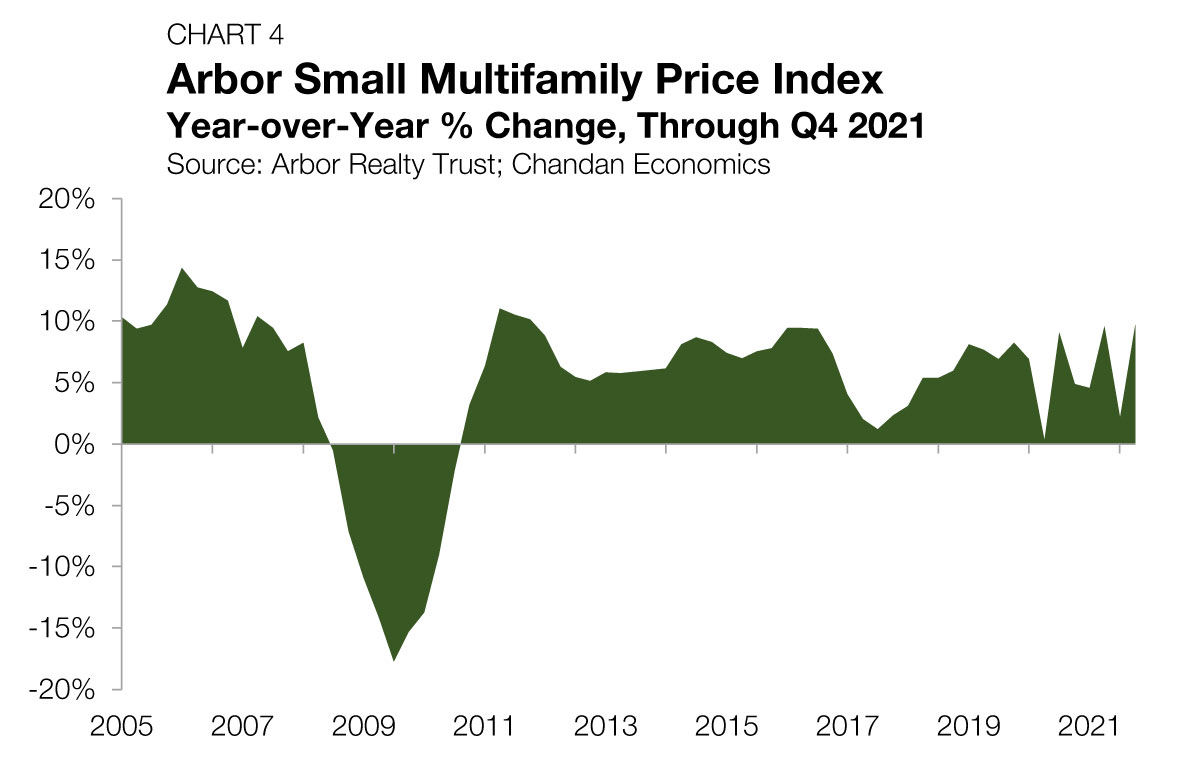
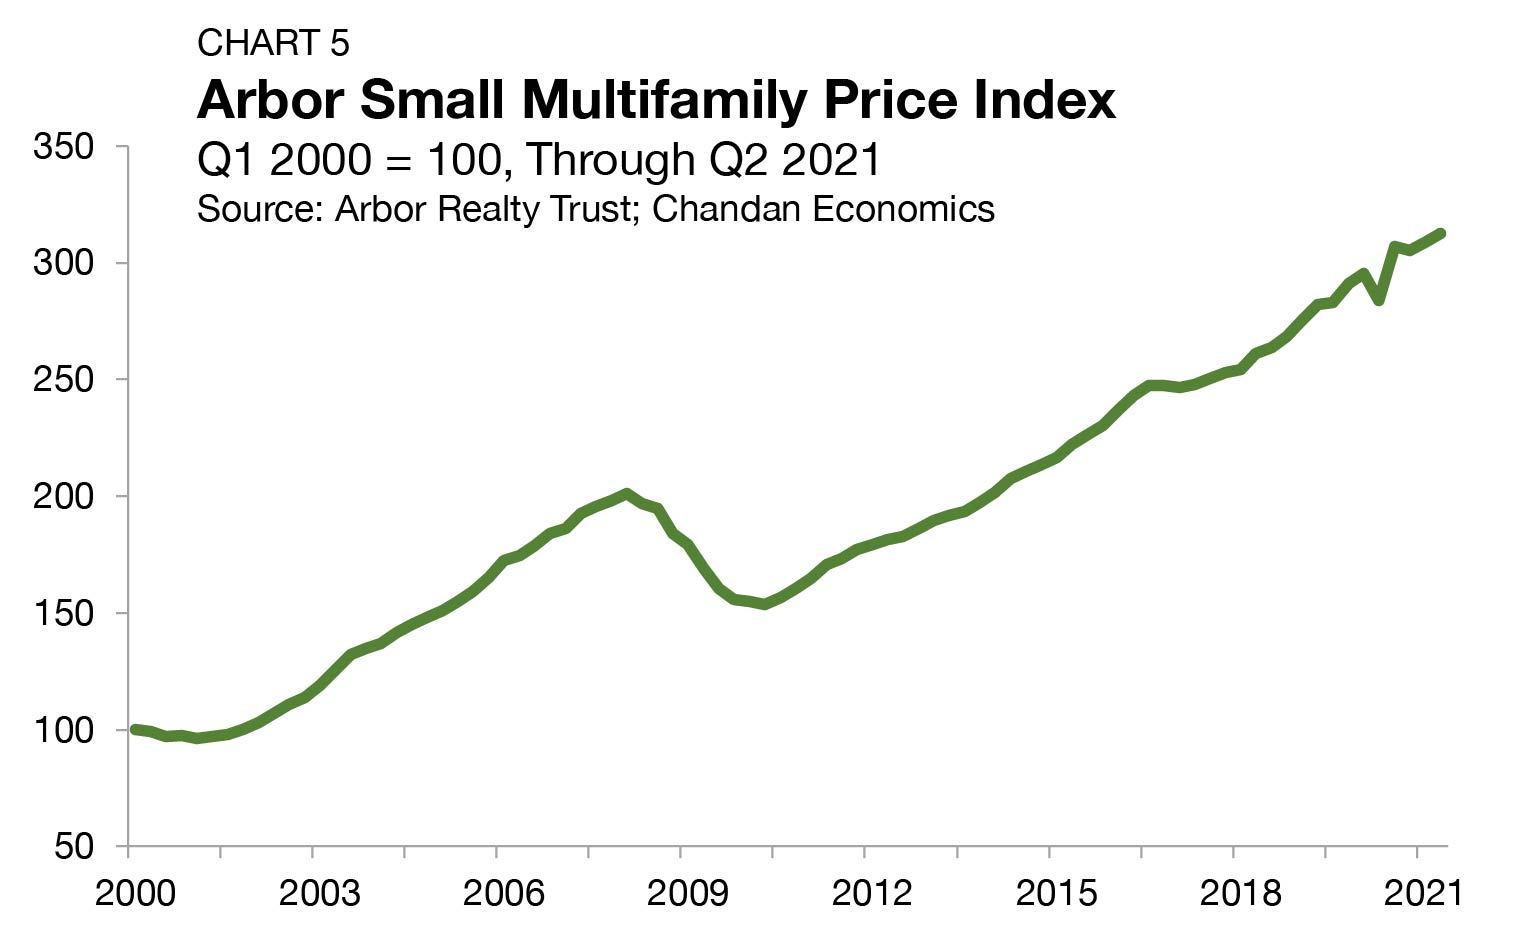
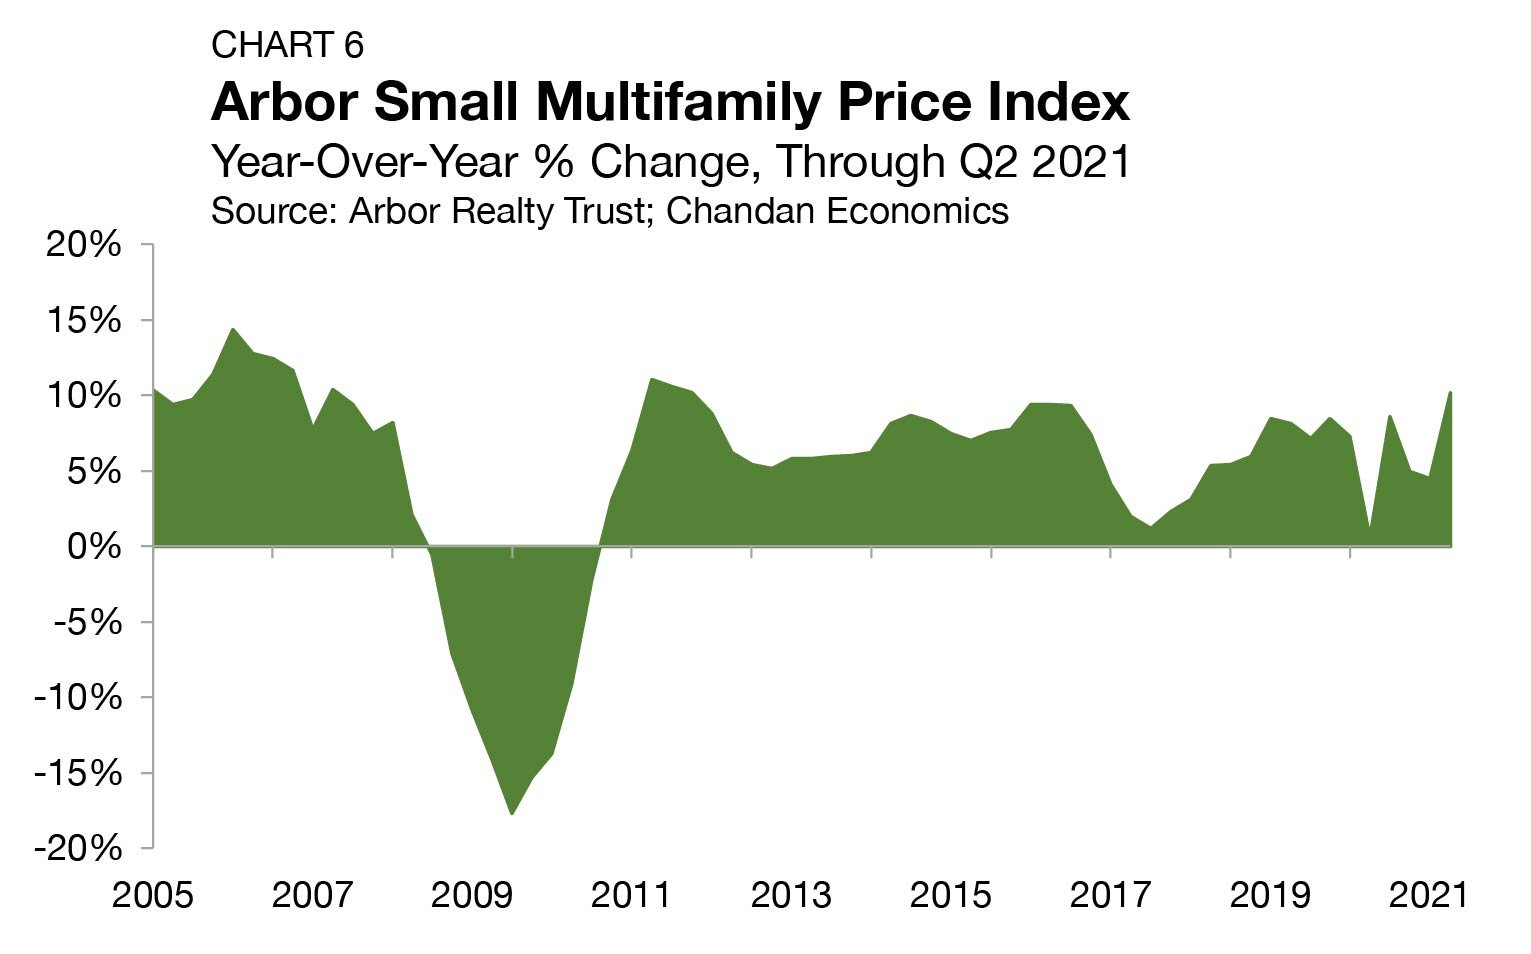
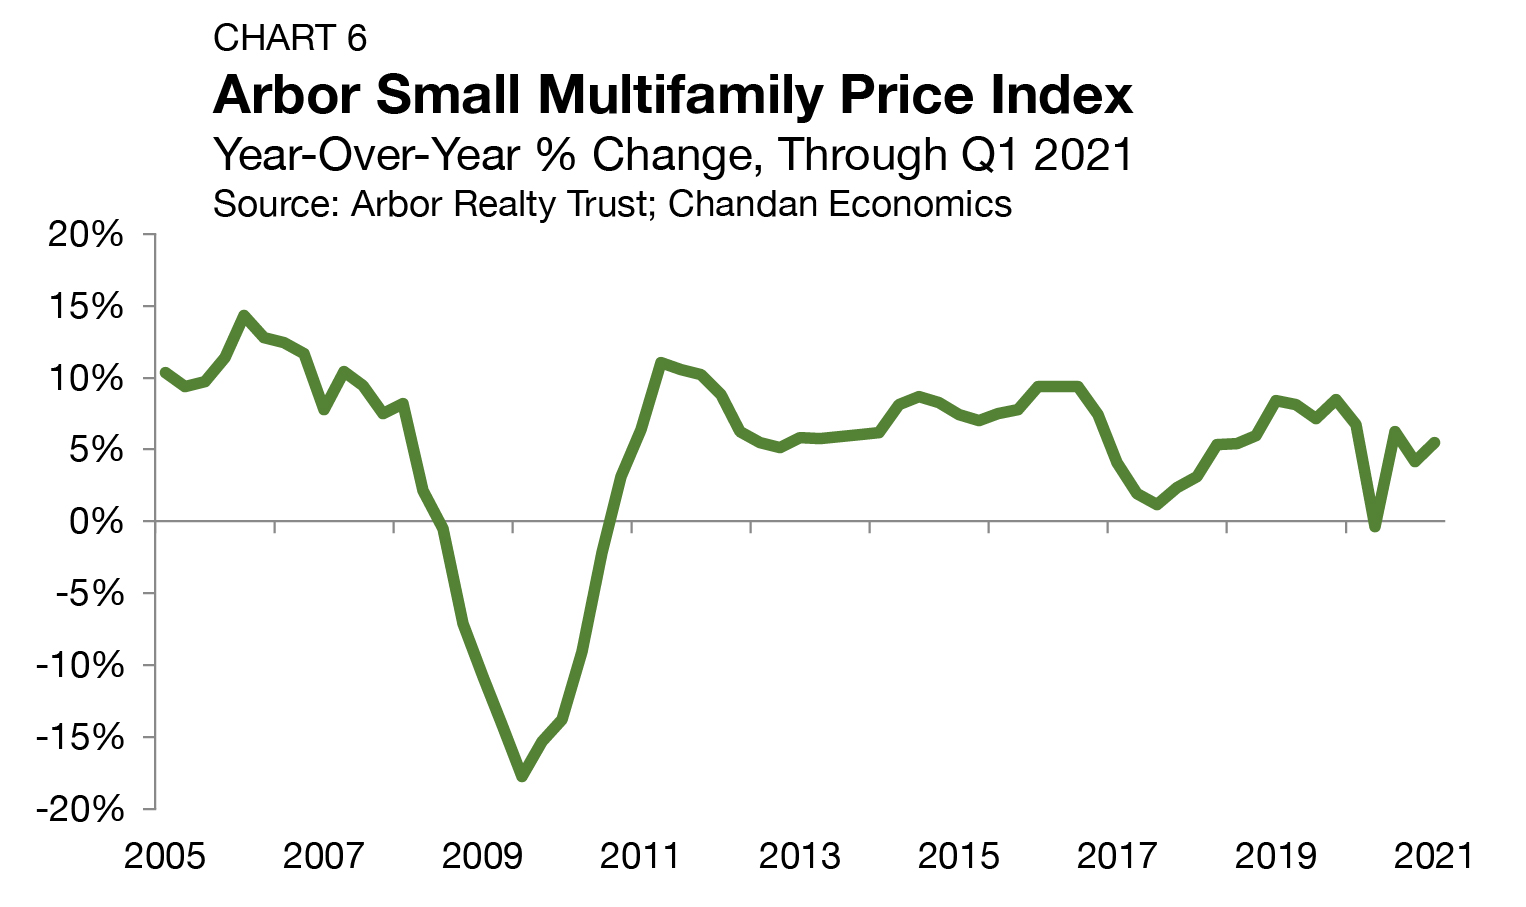
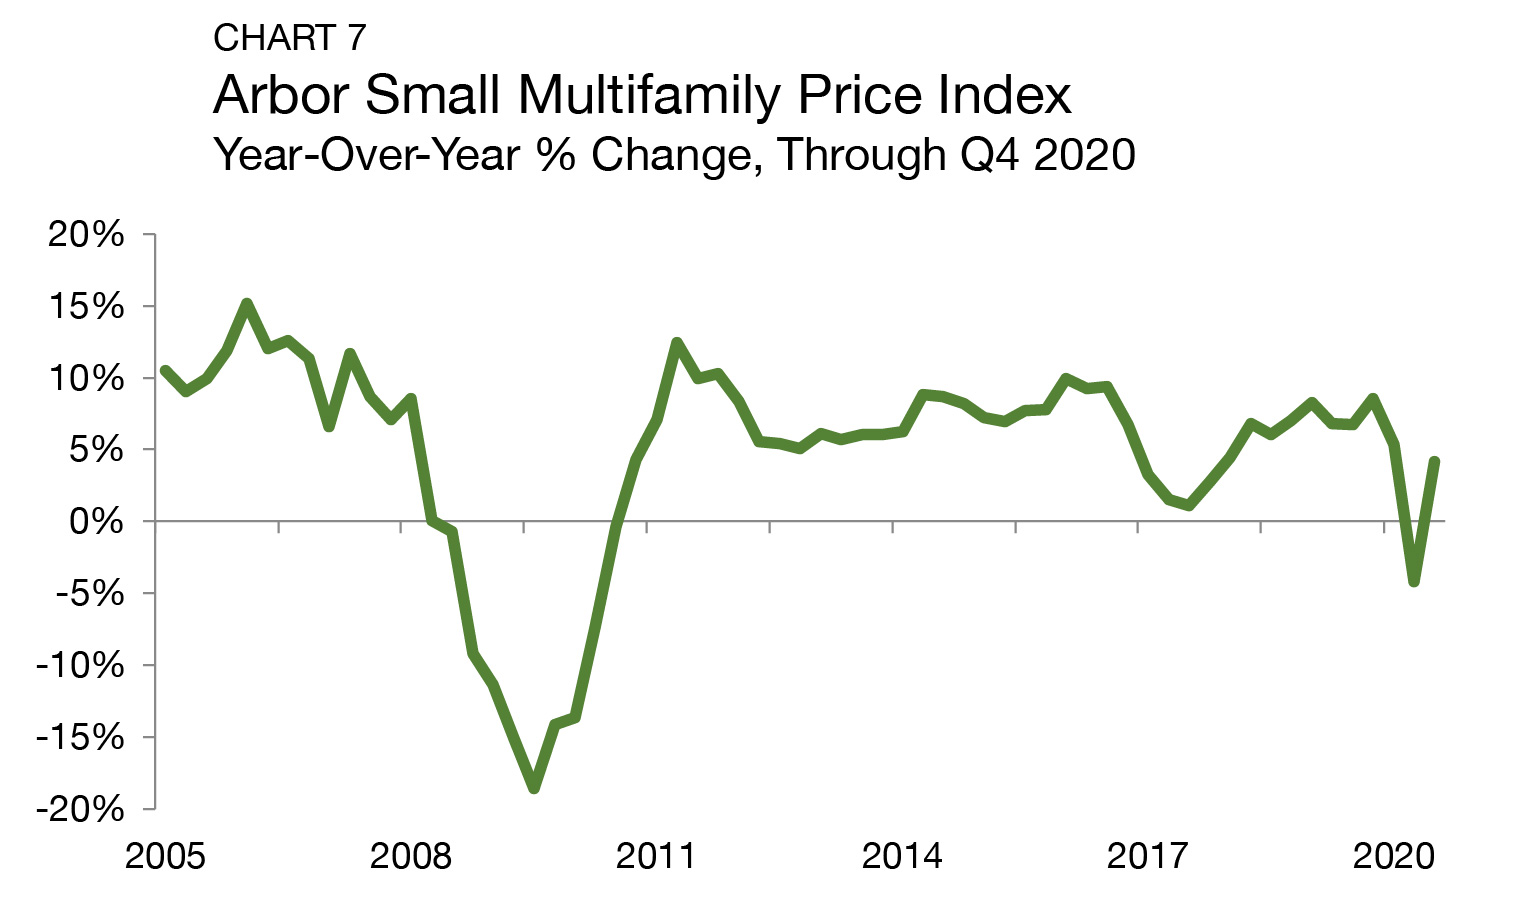
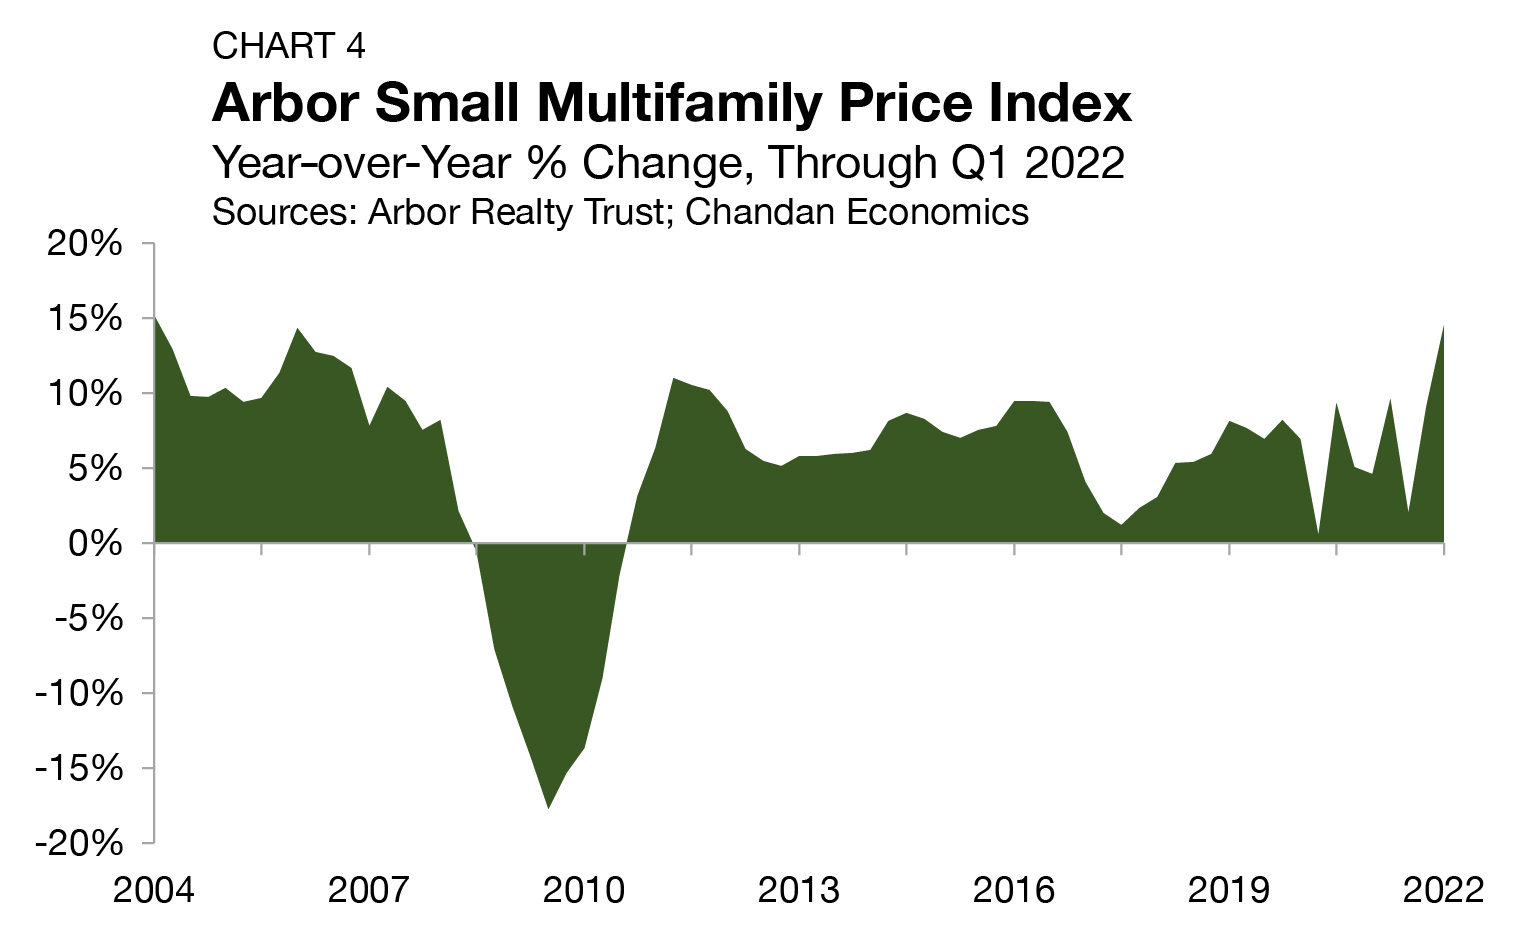
- Asset valuations rose 14.5% year-over-year, the fastest rate since 2004.
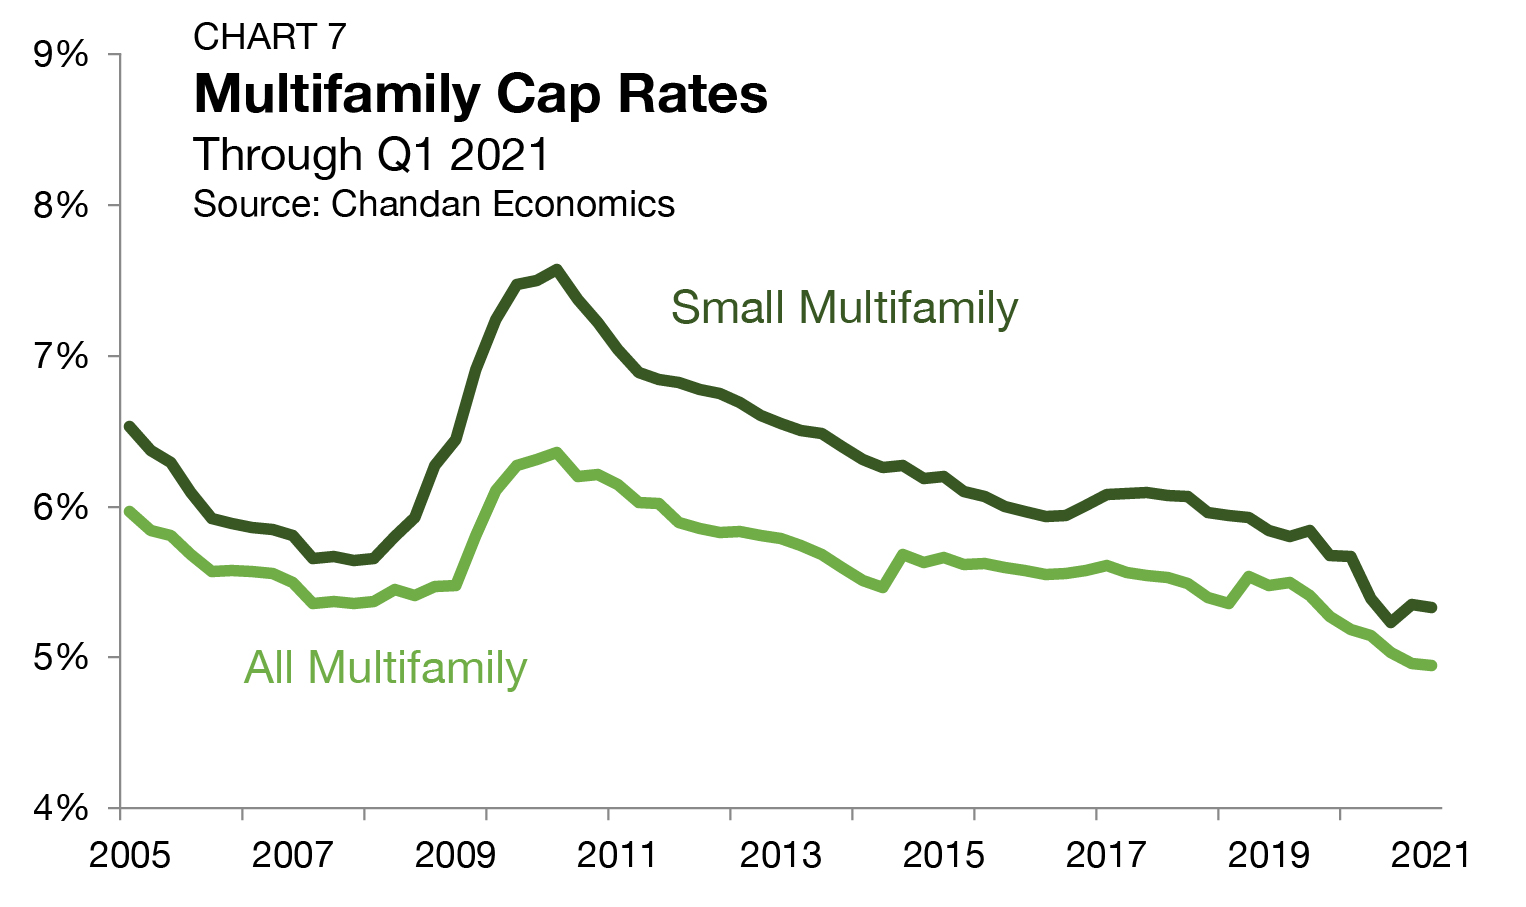
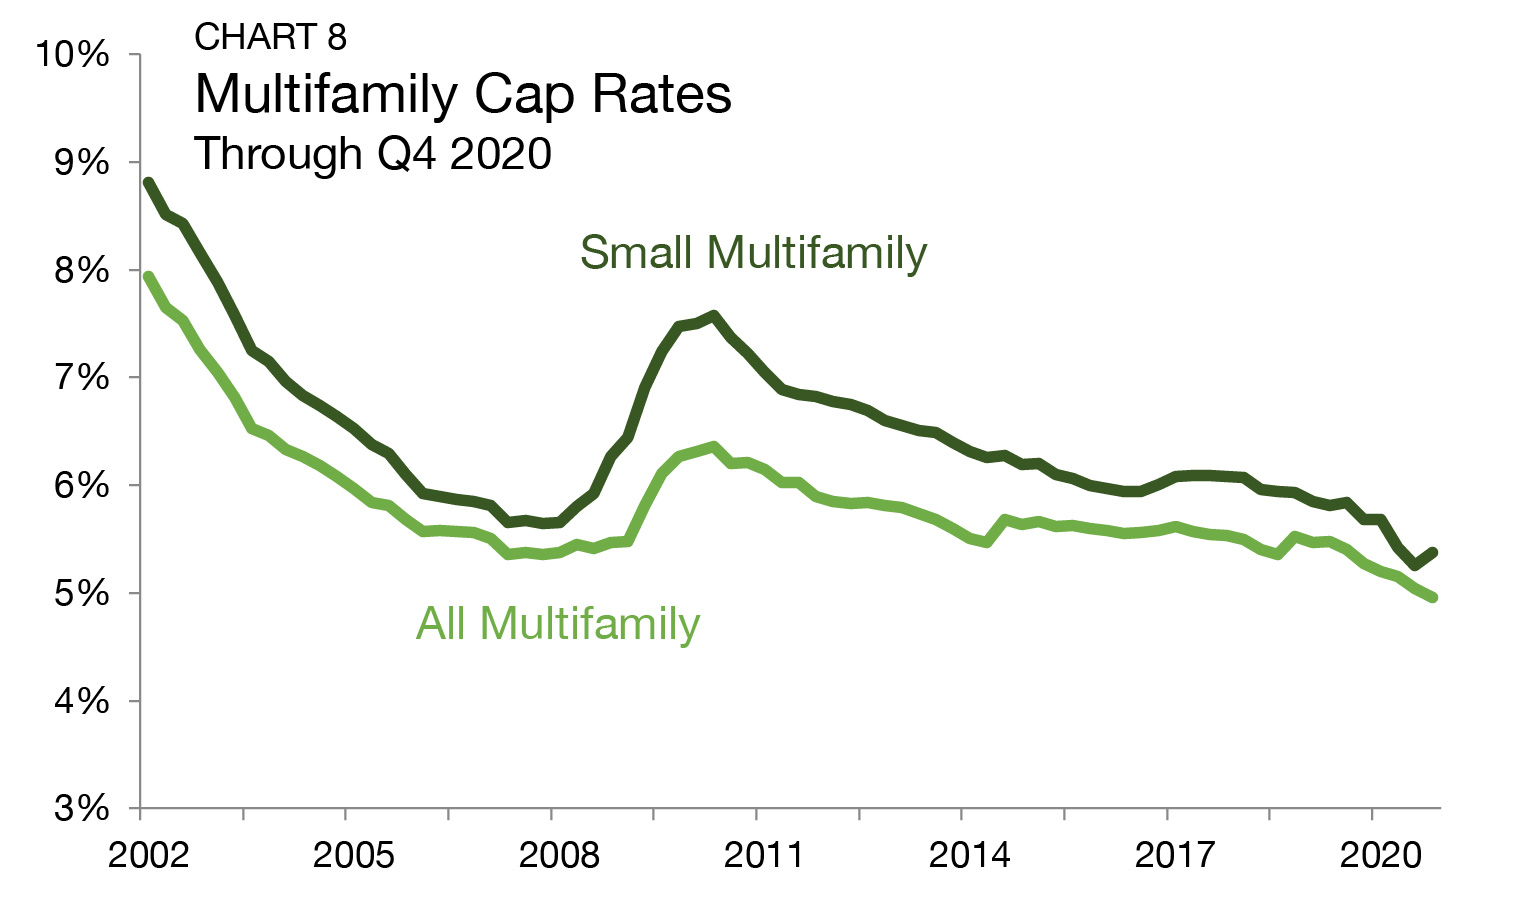
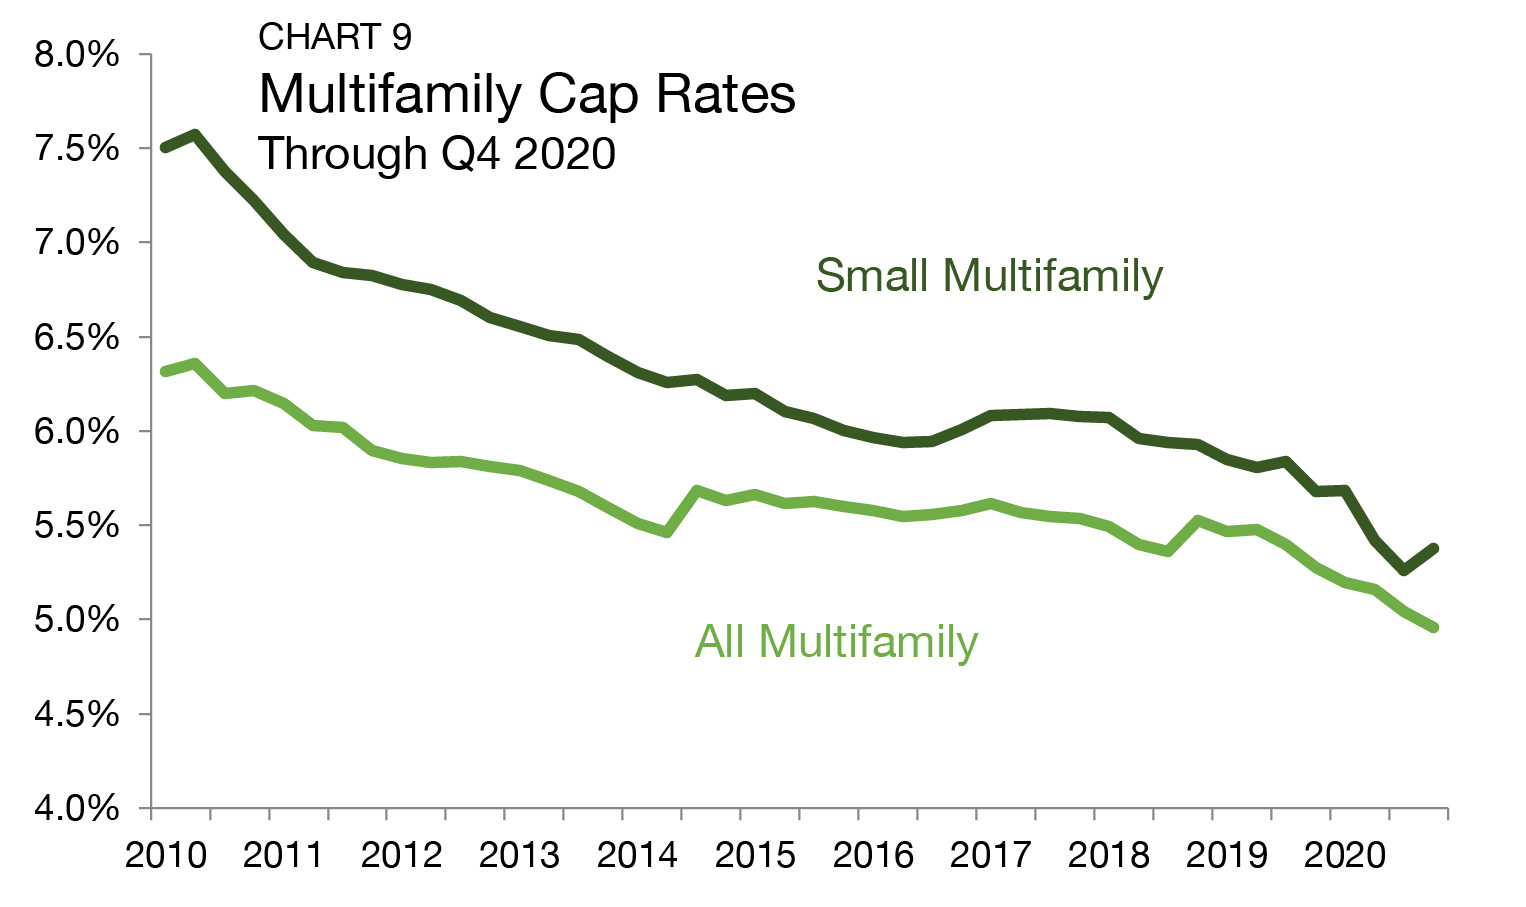
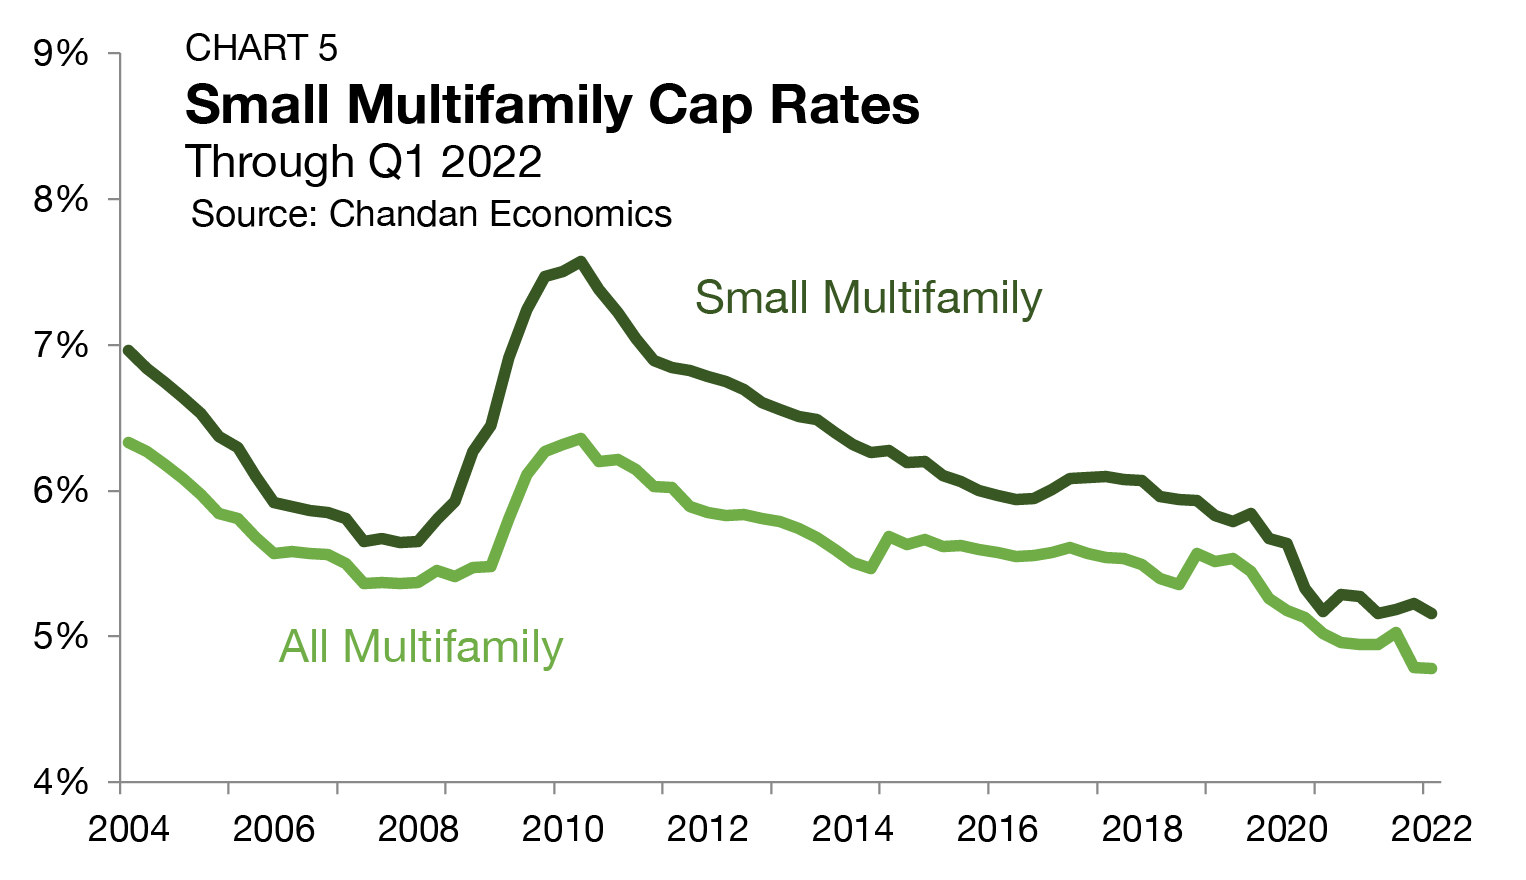
- Cap rates held steady near 5.2% for the fourth consecutive quarter.
State of the Market
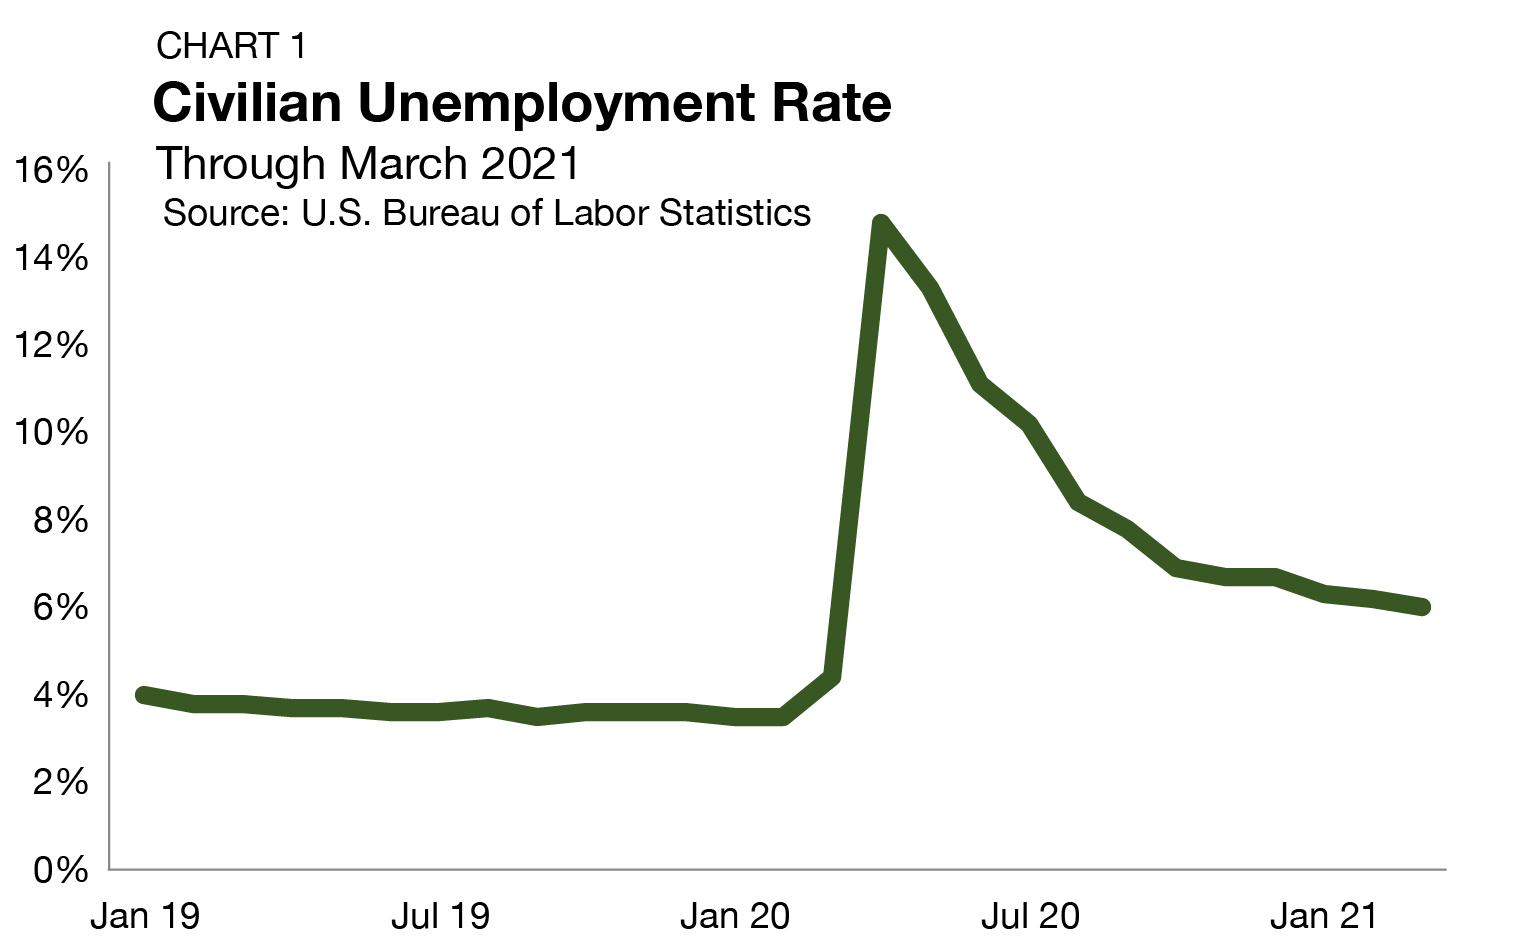
The economy shrank at a 1.4% seasonally adjusted annualized rate in the first quarter of 2022, according to the U.S. Bureau of Economic Analysis. The contraction comes amid elevated energy costs and growing recessionary concerns. Even so, the level of panic after the first-quarter release remains low as personal consumption expenditures (+2.7%) and private investment spending (+2.3%) — the demand driving pillars of the economy — maintained encouraging levels of growth.
Inflation remains a significant concern. According to the U.S. Bureau of Labor Statistics (BLS) Consumer Price Index, prices of goods and services increased 8.6% from one year ago through March — the highest mark since 1982. In response, the Federal Reserve has initiated its much-anticipated monetary policy tightening cycle. At its March 2022 policy meeting, the central bank raised its short-term policy rate by 25 basis points (bps). According to the CME Group’s FedWatch tool, markets are betting on the Fed raising interest rates at each of its meetings this year, with most participants believing that the federal funds rate will be at or above 2.5% entering 2023.1
Expectations of higher short-term rates coming soon are influencing long-term interest rates. According to Freddie Mac’s Primary Mortgage Survey®, 30-year fixed-rate mortgages recently eclipsed 5% for the first time since 2011. Additionally, the yield on 10-Year Treasuries, a closely watched metric that influences real estate financing and cap rates, are also rising, hitting 2.85% on April 18th — its highest level since 2018.
In the medium term, rising interest rates may limit how much further multifamily cap rates can compress, though current market conditions should insulate the sector from upward cap rate pressure over the short term. However, some market participants still see room for further cap rate compression. According to First American’s Potential Cap Rate Model, trading multifamily cap rates are 0.7% higher than their model suggests they should be.
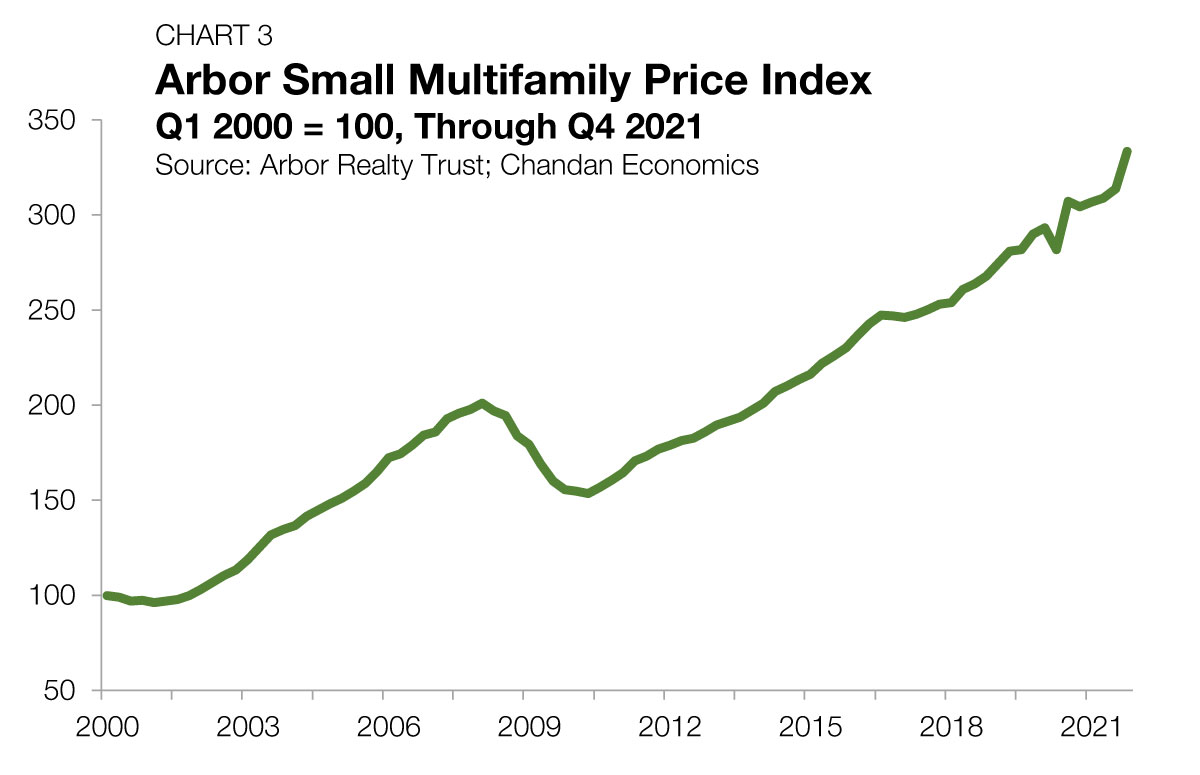
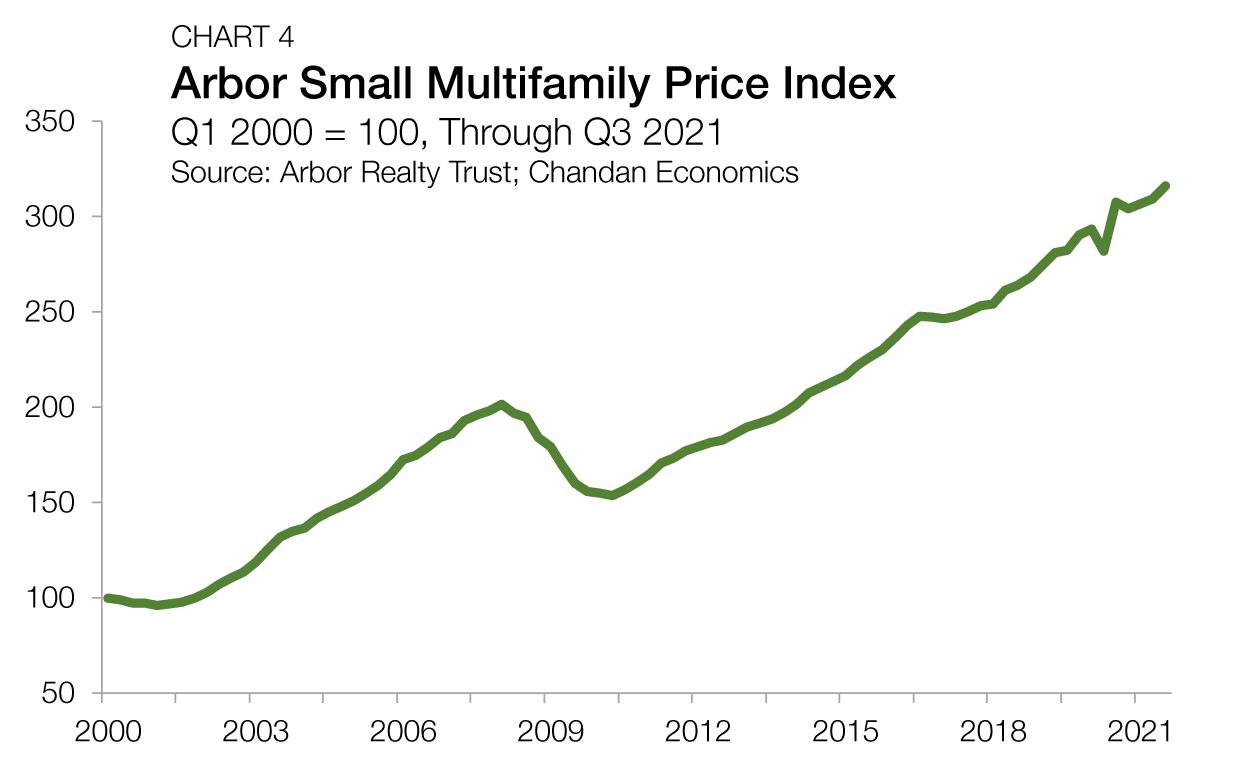
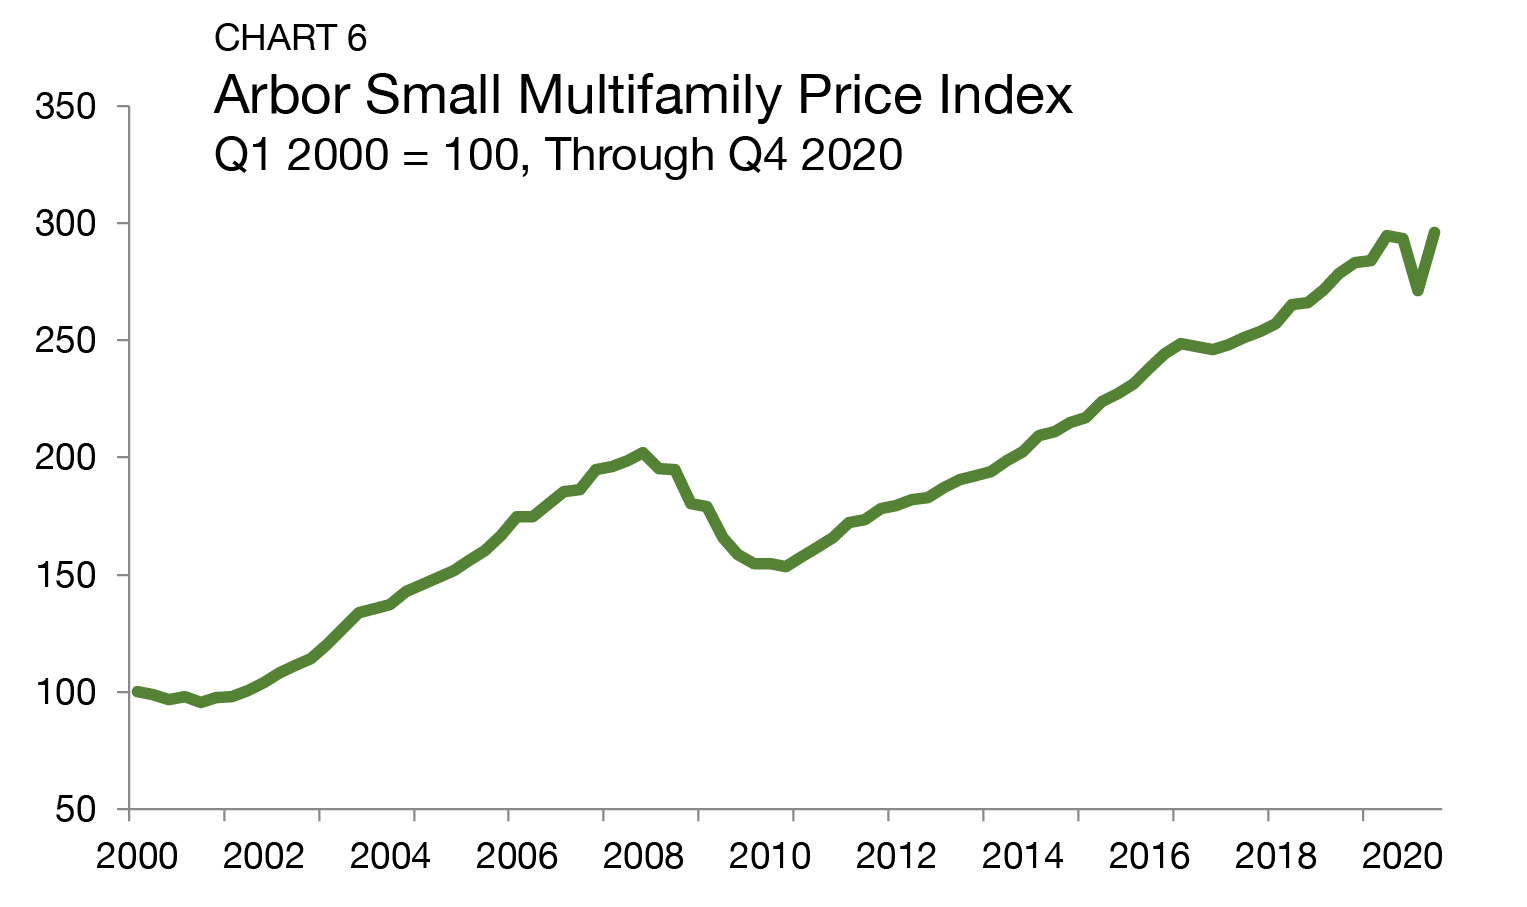
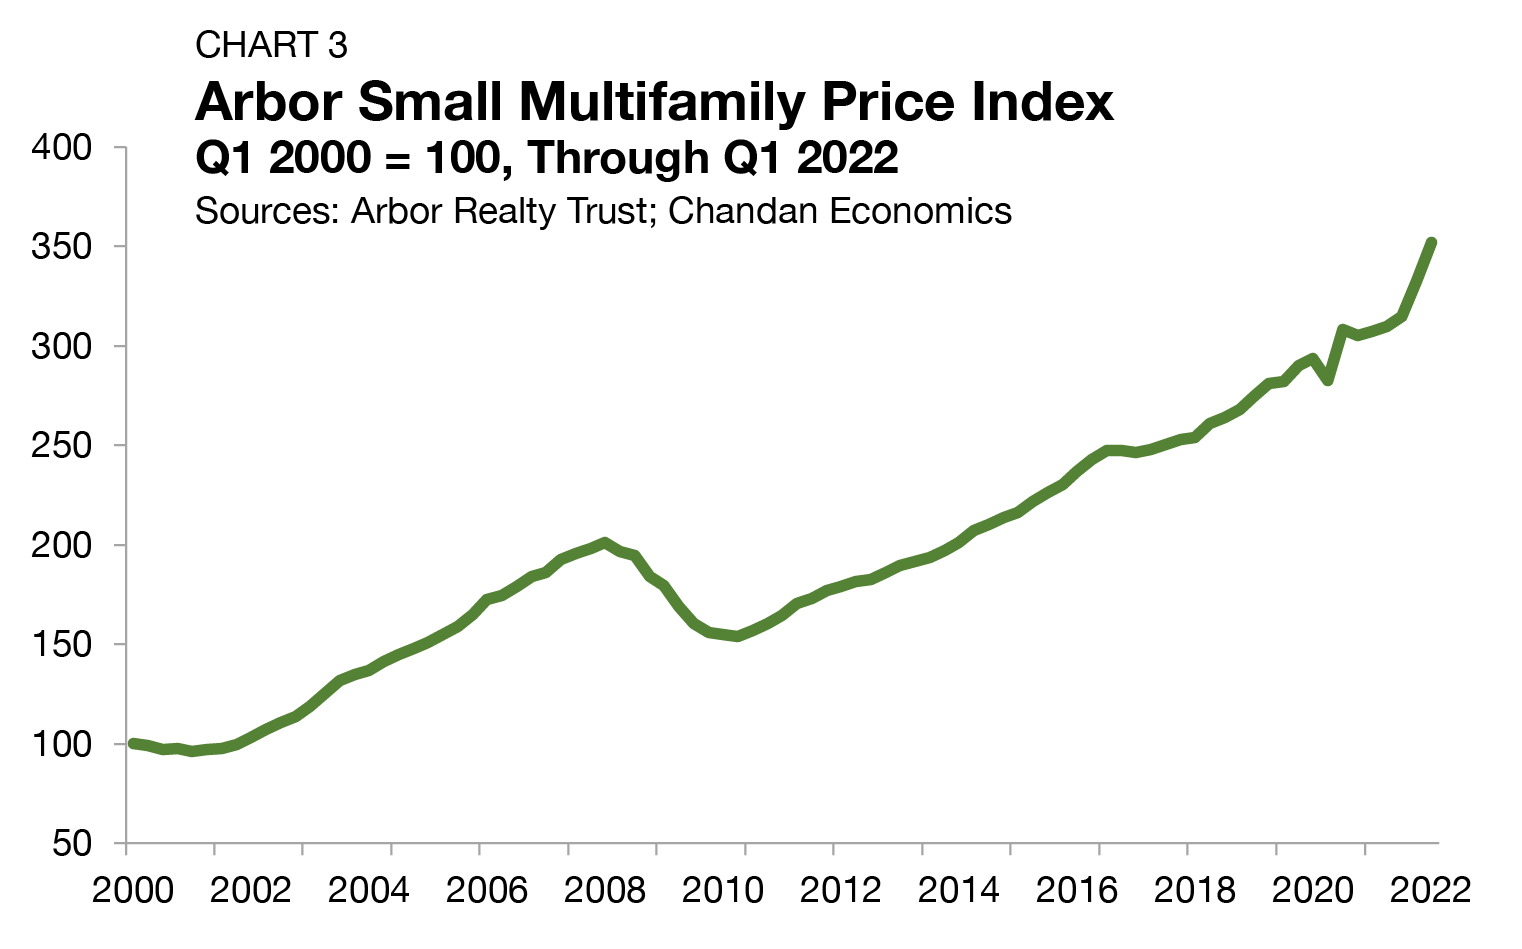
Within the small multifamily sub-sector, resiliency during the pandemic and robust growth over the past year has fueled optimism and buyer demand for small multifamily assets. According to a recent analysis by Chandan Economics and RentRedi, on-time rental payments in small multifamily units averaged 81.1% in the first quarter of 2022 — the highest sustained level since before the pandemic. Asset valuations are reaping the benefits of higher property-level cashflows, achieved through rising rents. In the first quarter of 2022, annual small multifamily price growth reached its highest level in nearly two decades. Although macroeconomic risks remain, confidence amongst equity buyers and debt lenders continues to support healthy levels of liquidity as we enter Spring 2022.
Lending Volume
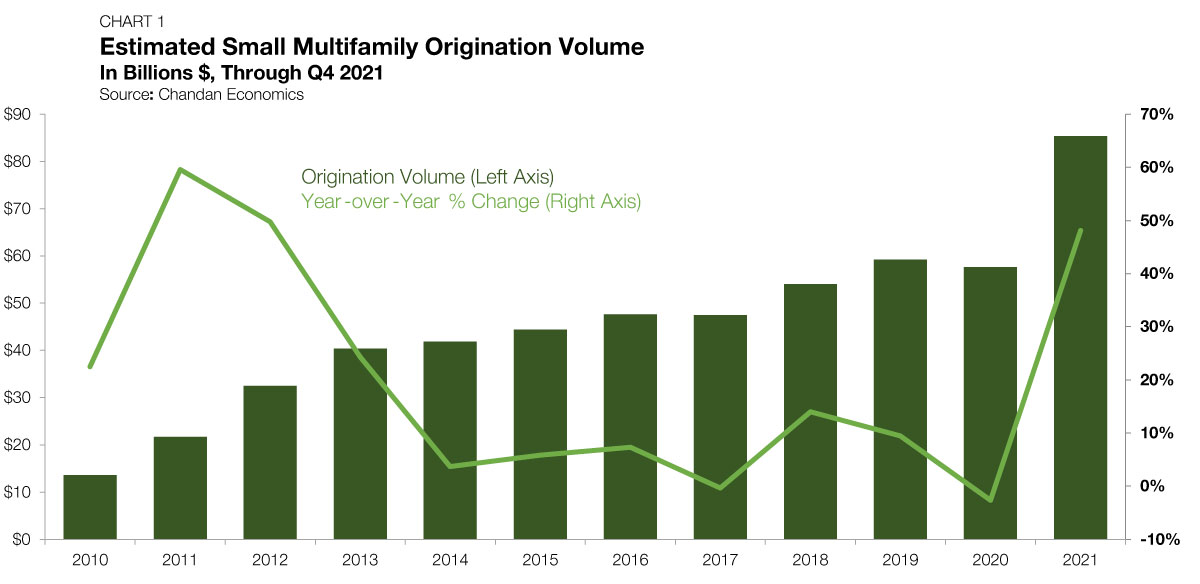
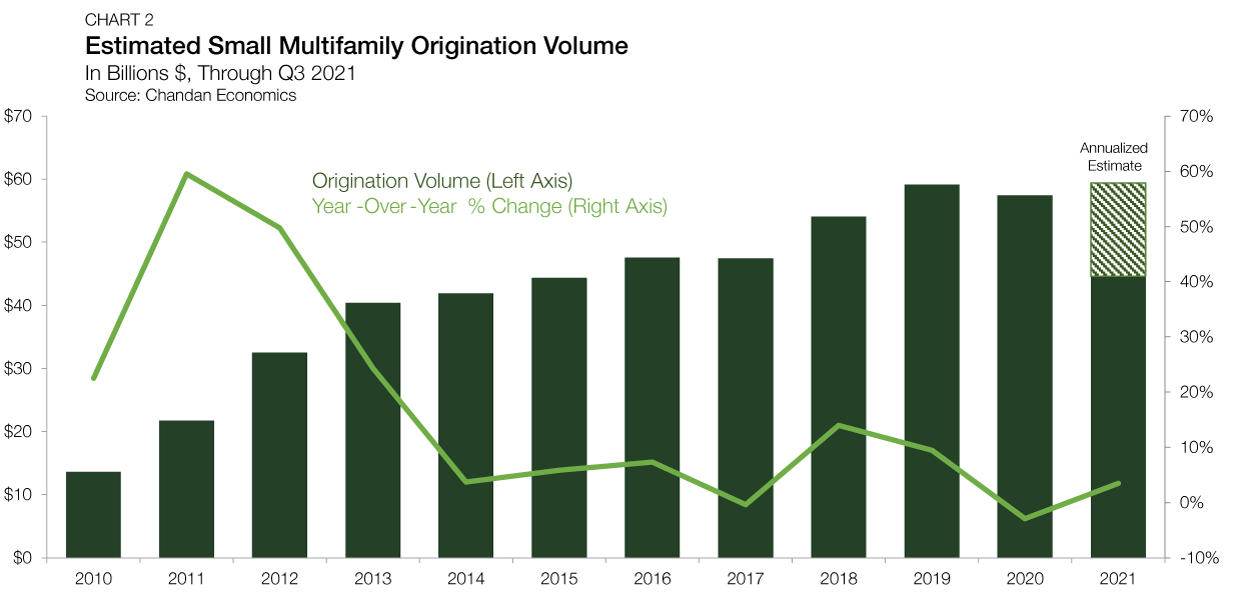
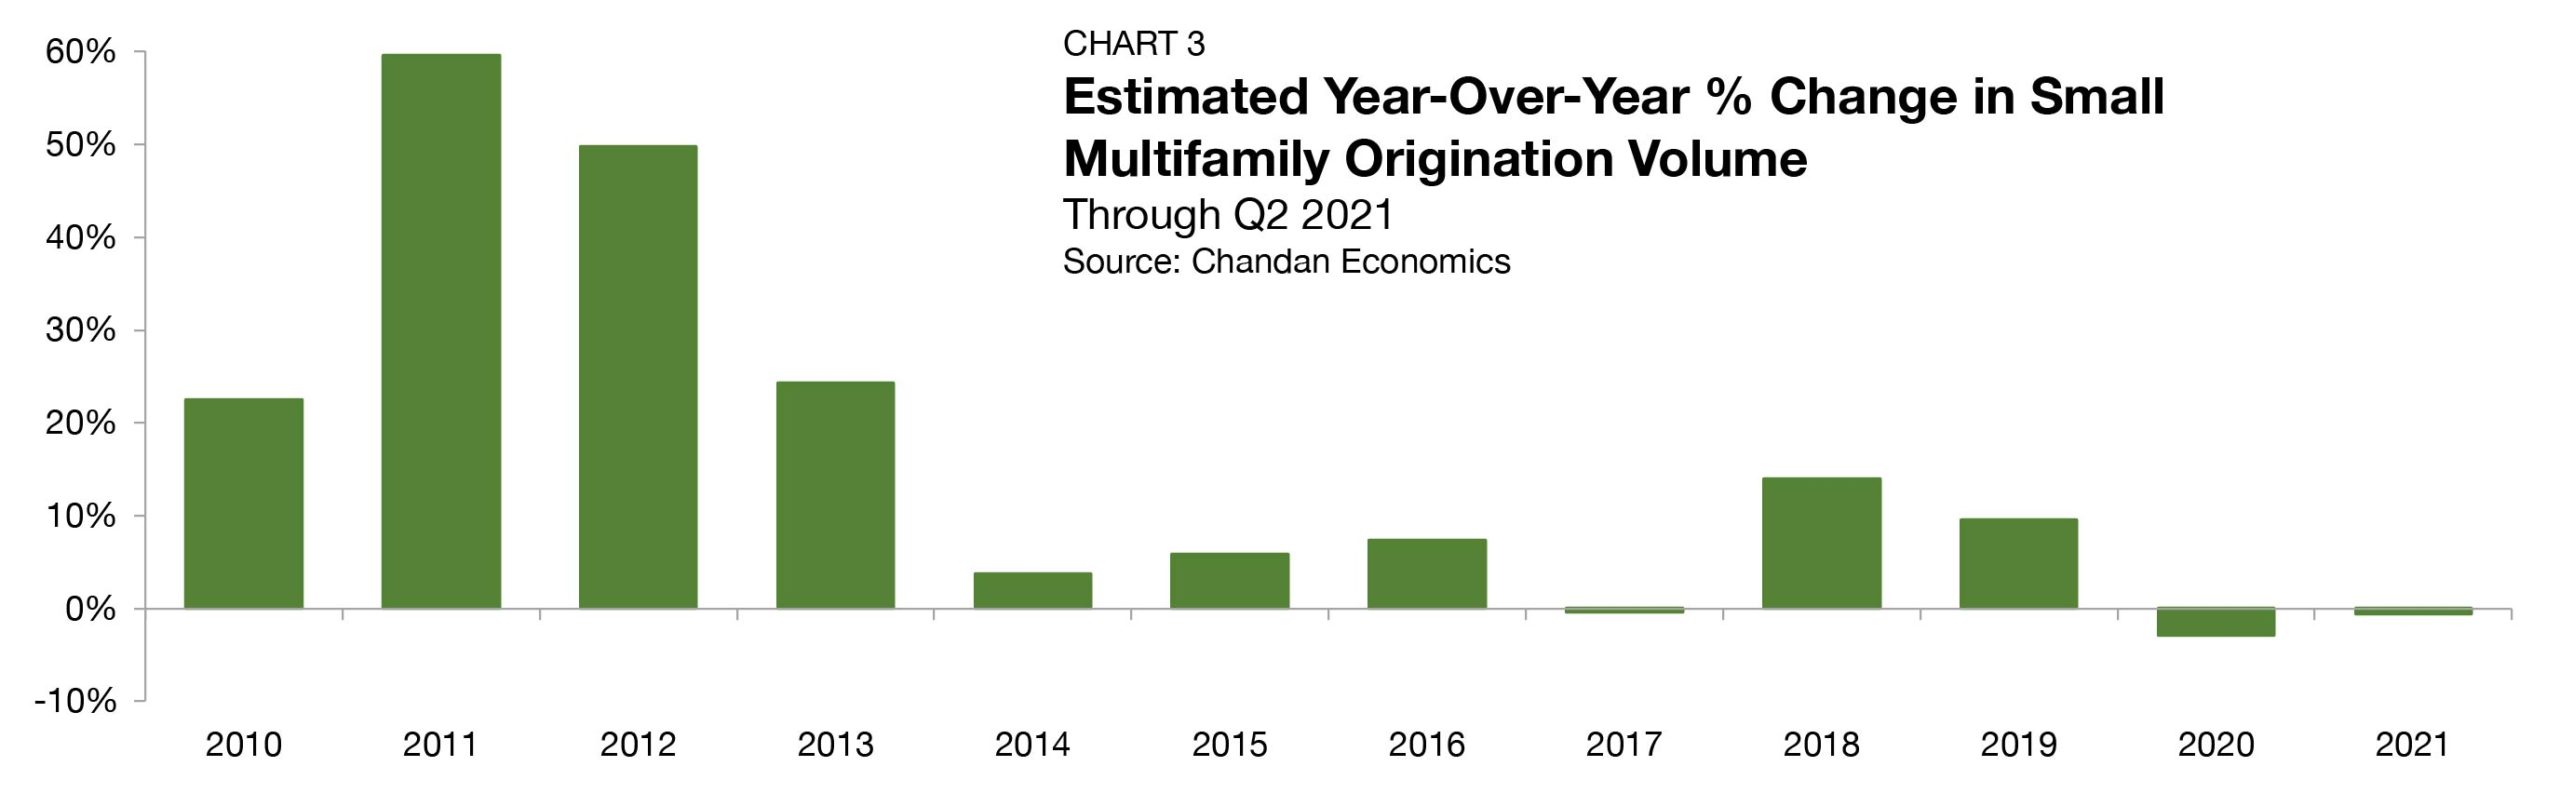
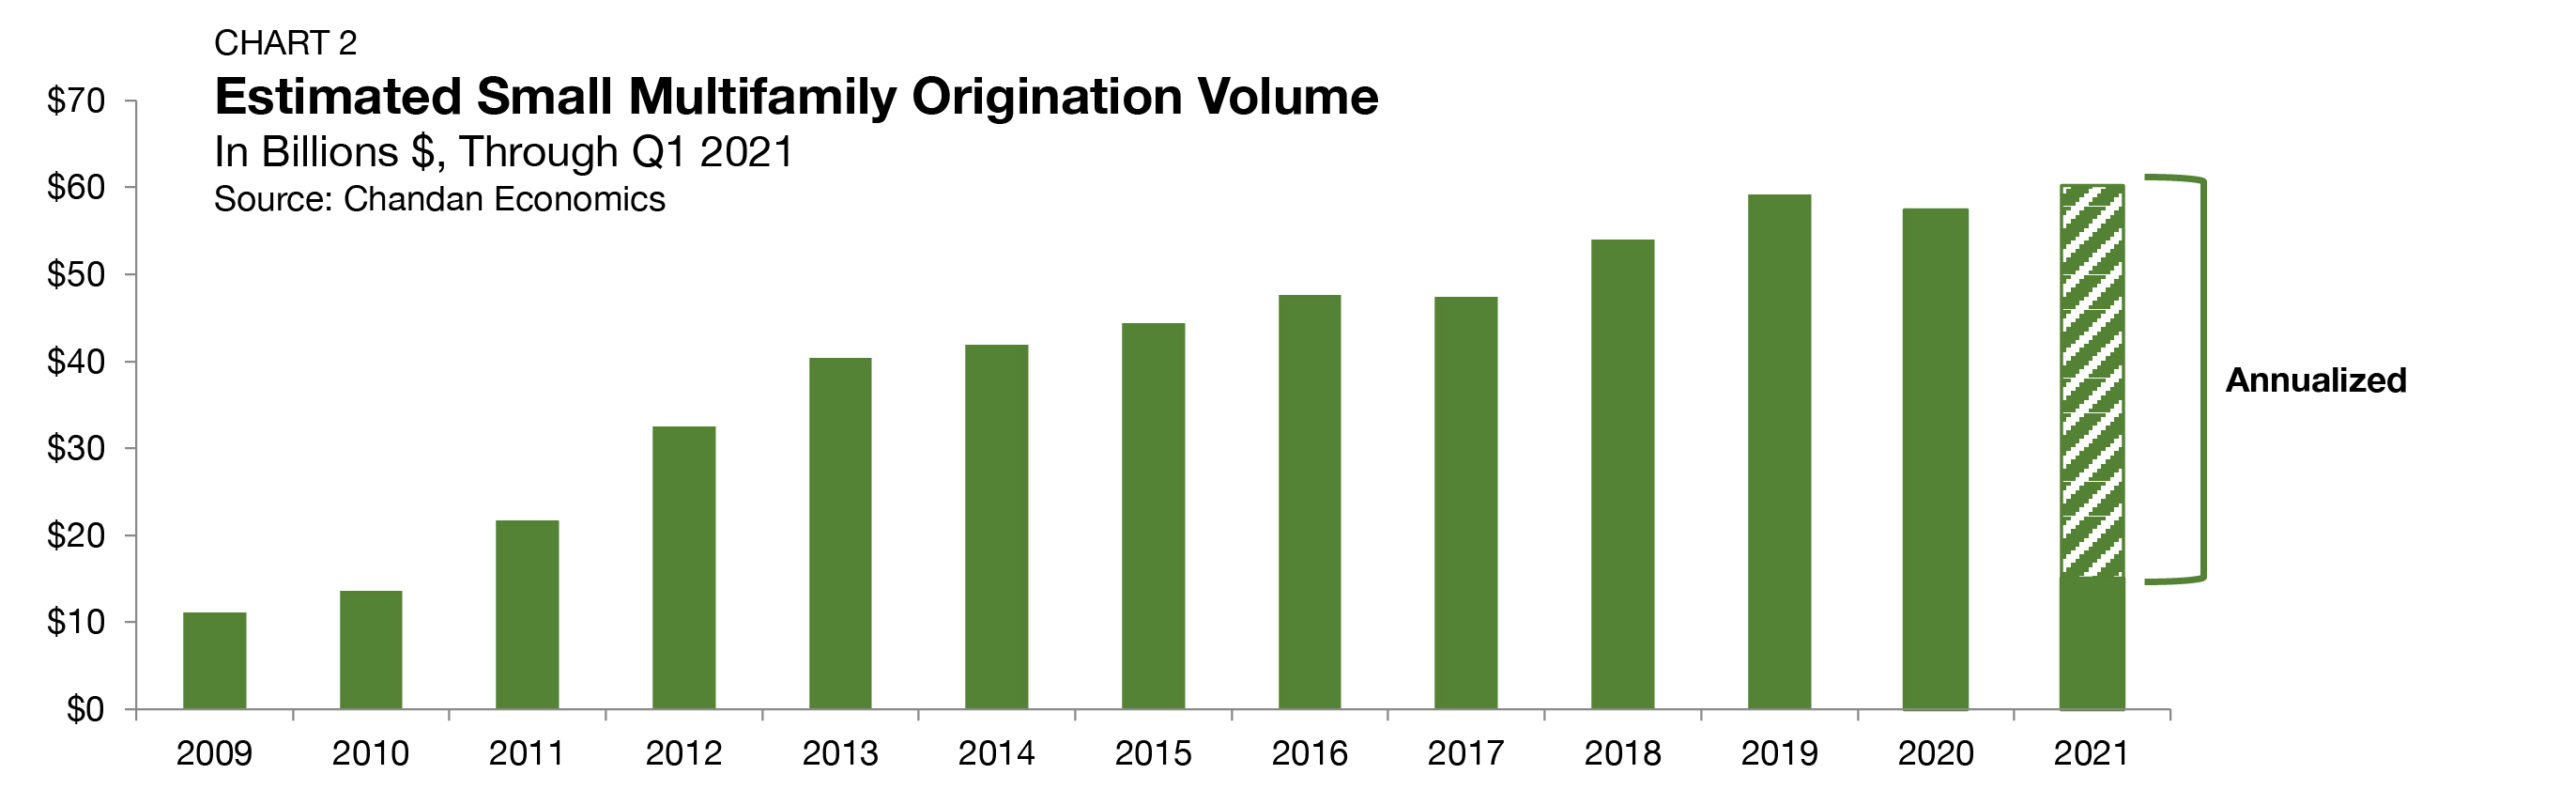
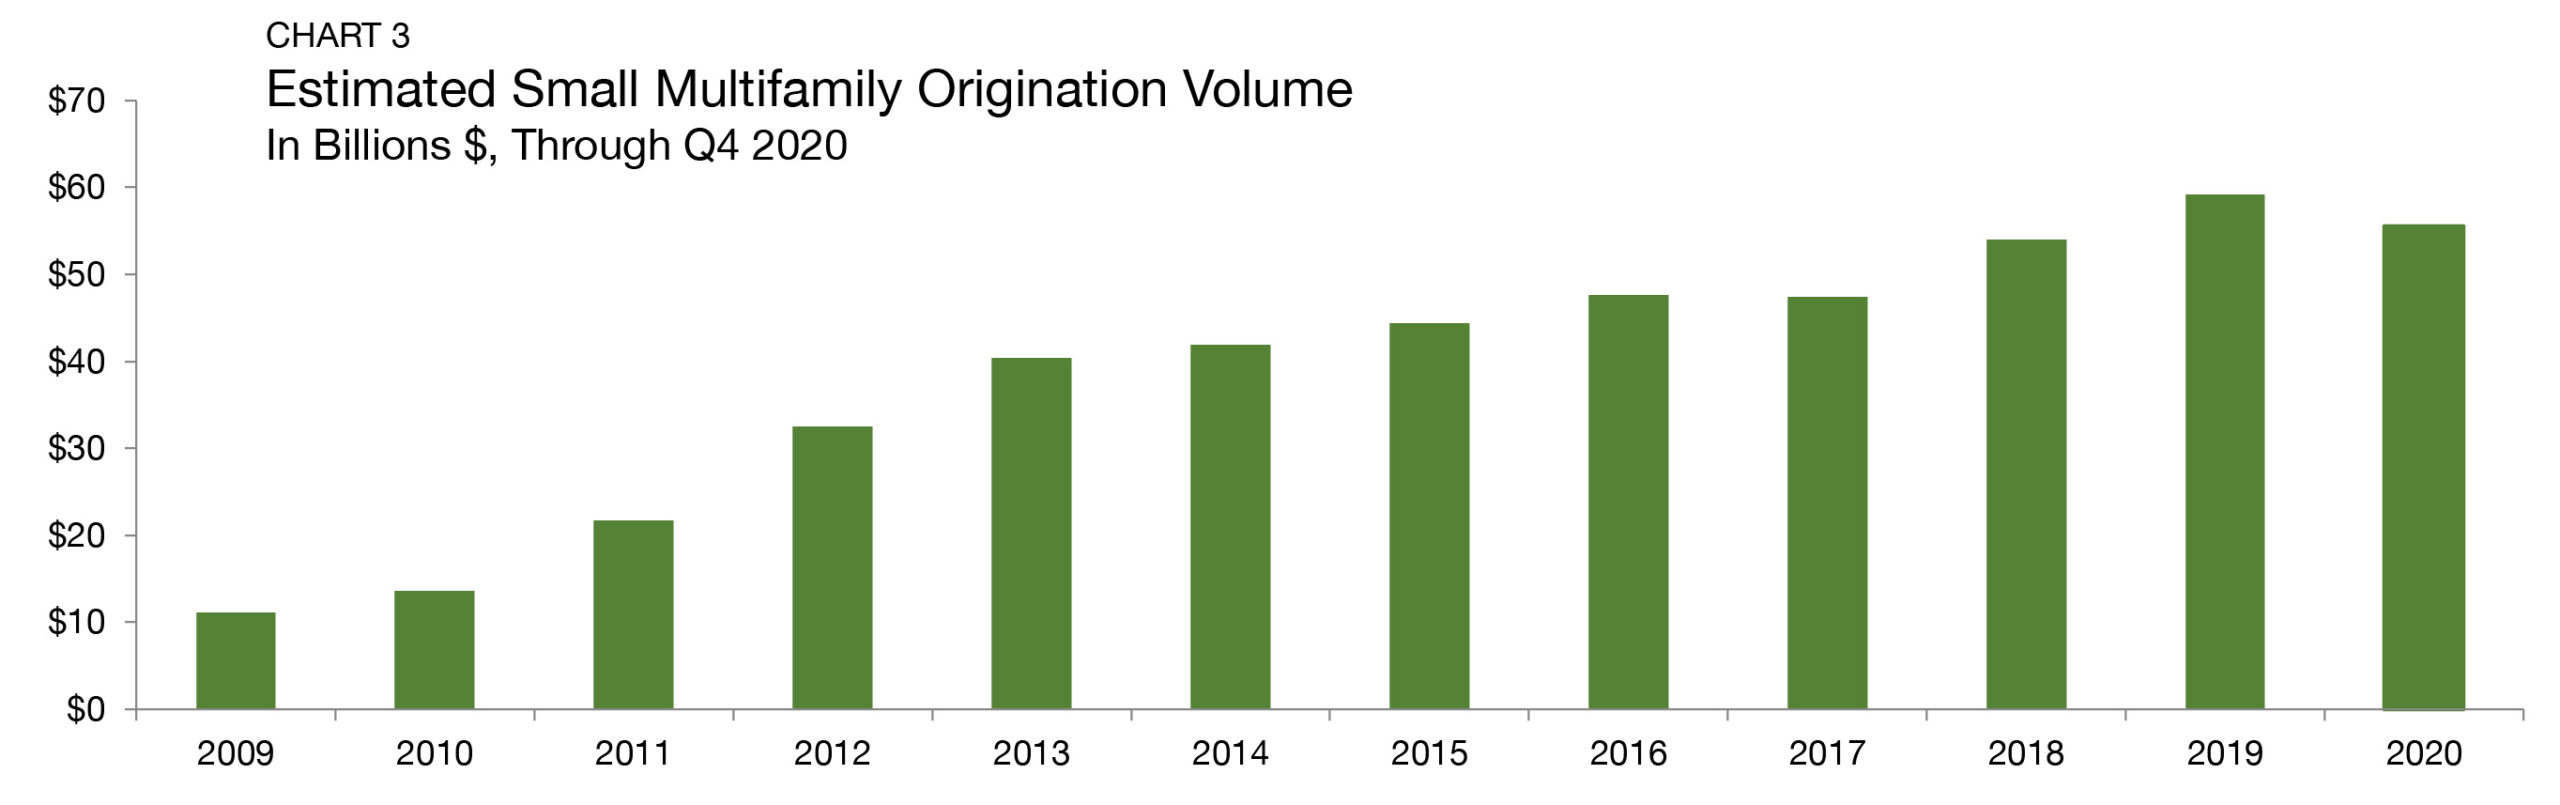
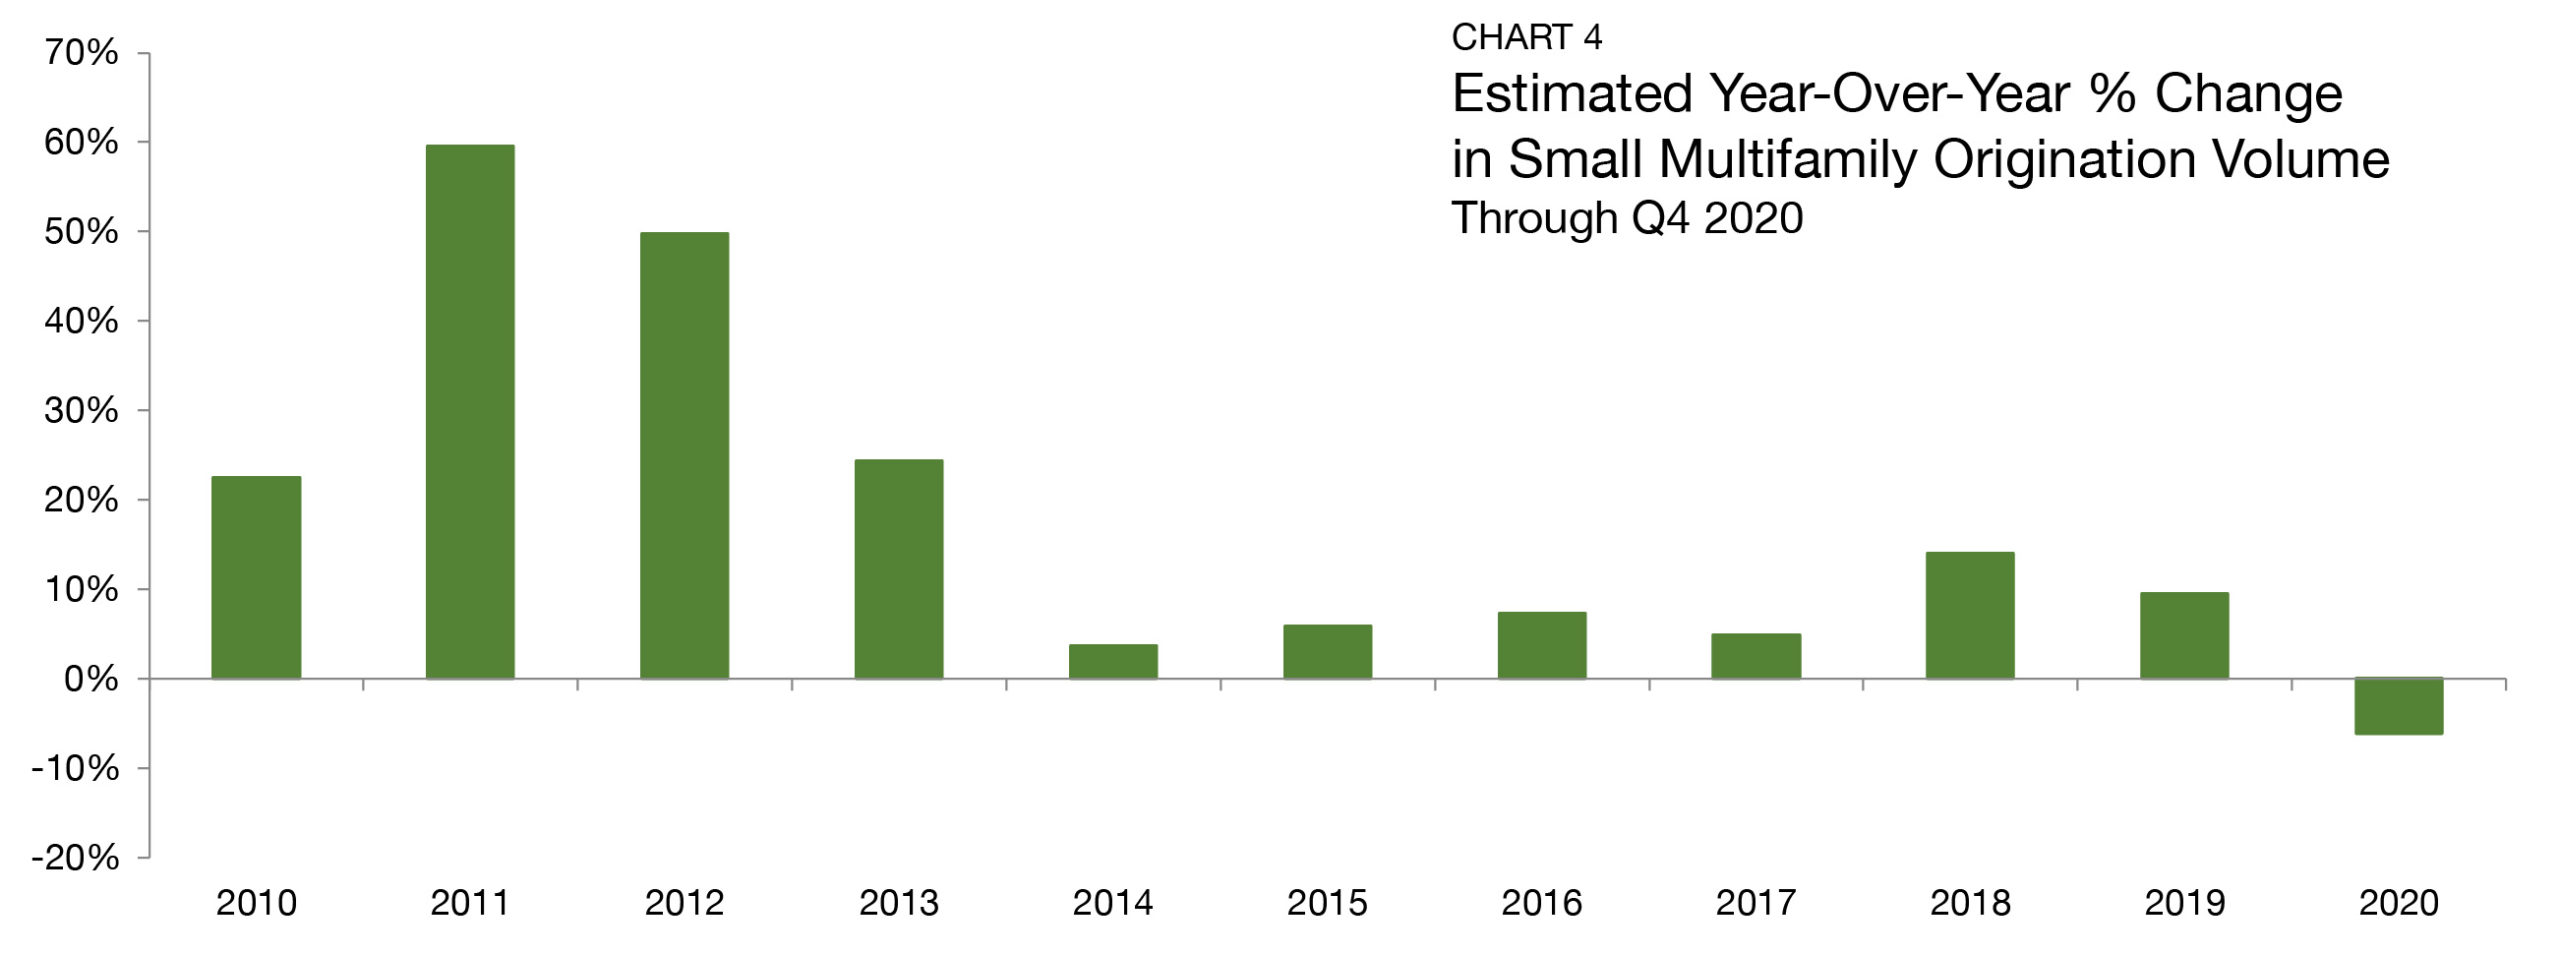
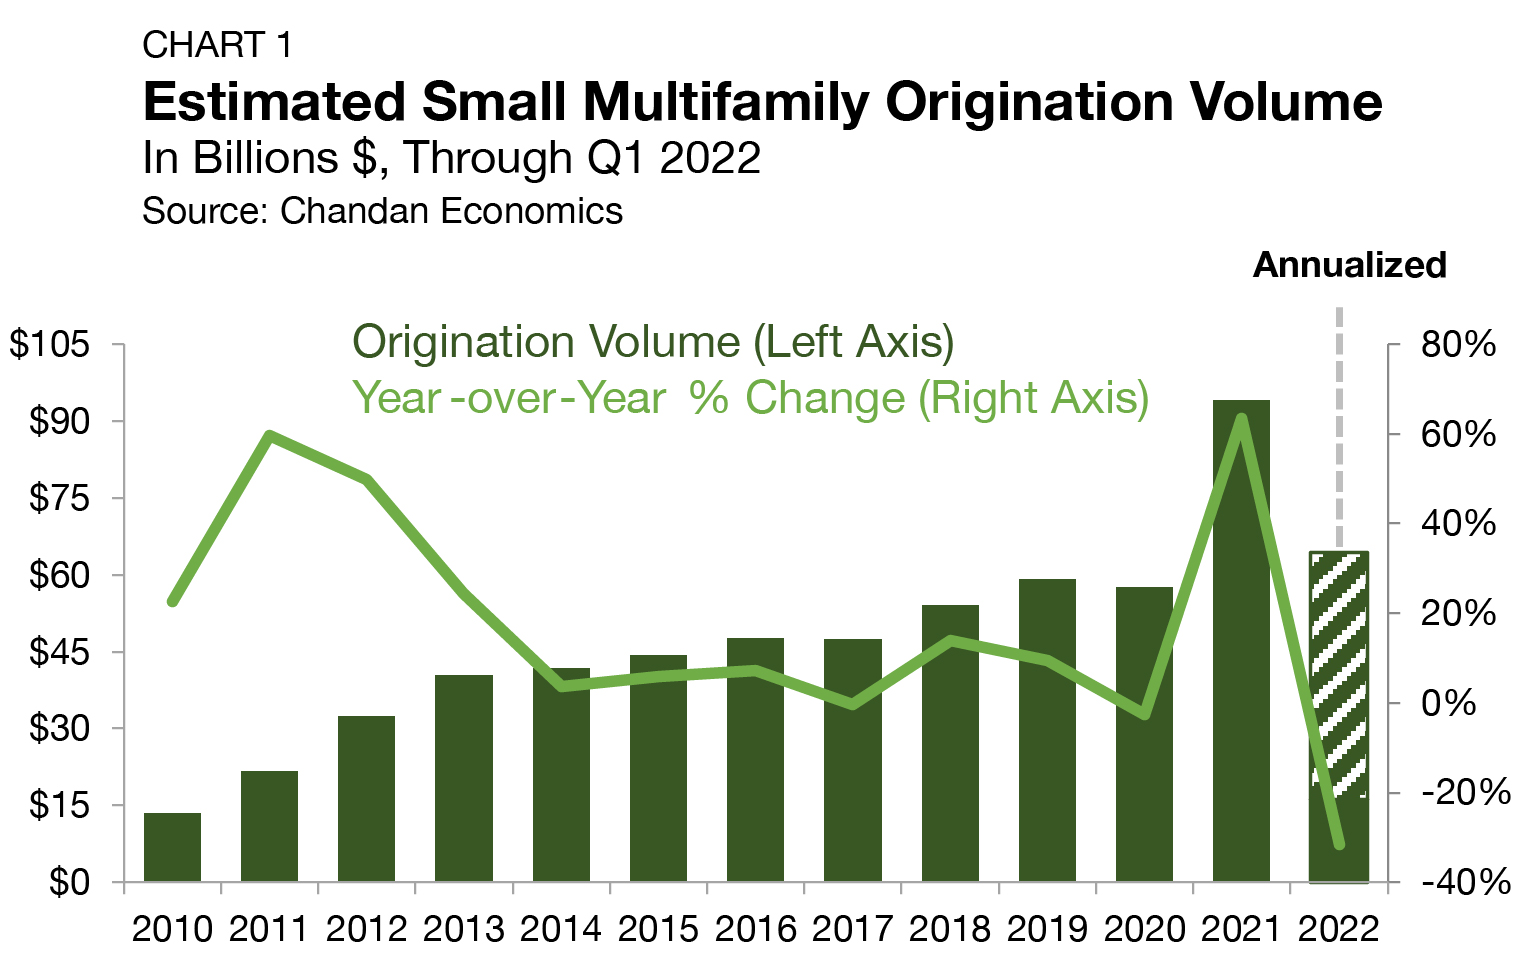
The year-end 2021 estimate of new multifamily lending volume on loans with original balances between $1 million and $7.5 million2 — including loans for apartment building sales and refinancing — surged to $94.1 billion (Chart 1). The estimate is a substantial increase from previous 2021 estimates, reflecting a sizable increase in originations near the end of the year. The 2021 originations total represents an annual increase of $35.6 billion (up 63.3%) from the year prior. Through the first quarter of 2022, small multifamily originations are on pace to reach $64.4 billion this year — a decline from last year’s record high but a total that would still represent the second-most active year on record. The current annualized originations estimate for 2022 would represent a 31.6% annual decline, though it would remain 8.8% above the pre-pandemic high of $59.2 billion set in 2019.
Three primary factors led to 2021 becoming the most active year for small multifamily originations on record. The first was the return of arms-length buyers as confidence in the macroeconomic recovery strengthened. The second was an influx of new multifamily investors drawn to the asset class because of its strong performance track record and attractiveness as an all-weather investment. Lastly, there was growing anticipation that the Federal Reserve would begin raising interest rates in early 2022, creating a sense of urgency for existing borrowers to secure financing – either for refinancing their mortgages or acquisitions.
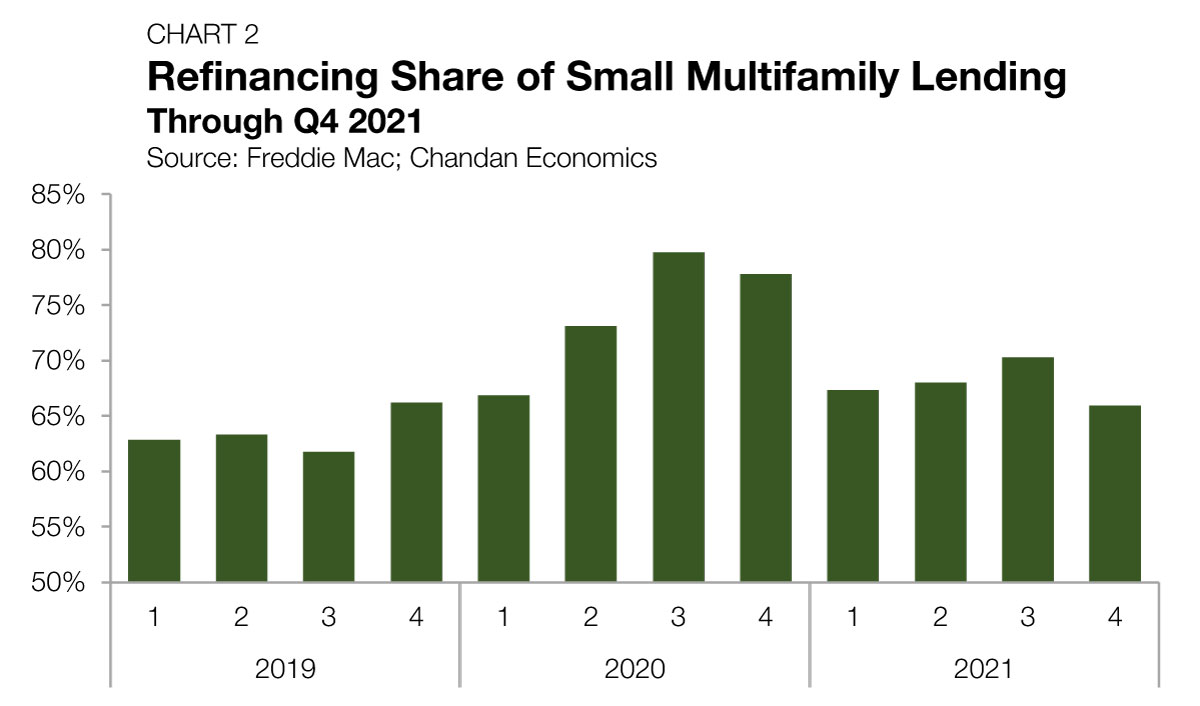
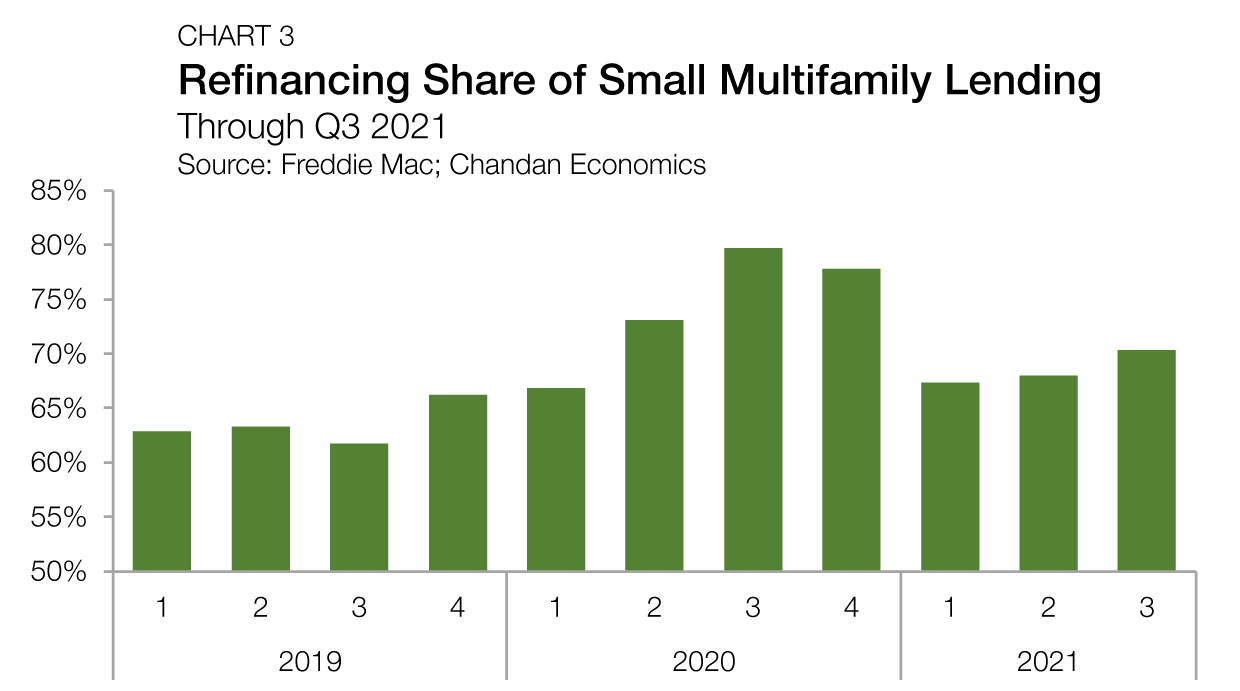
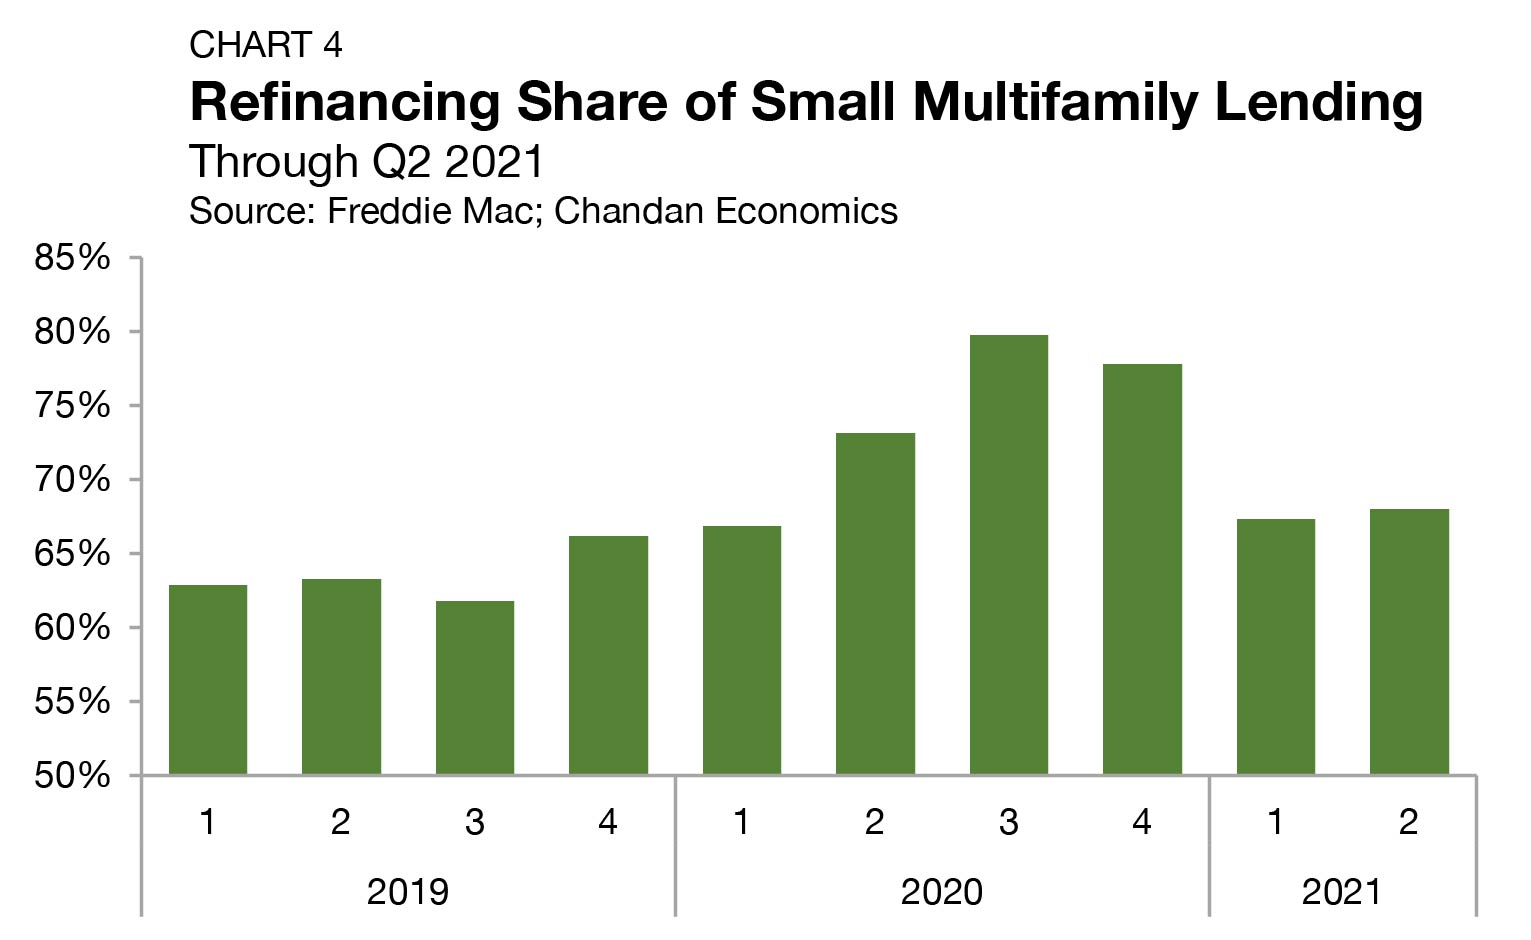
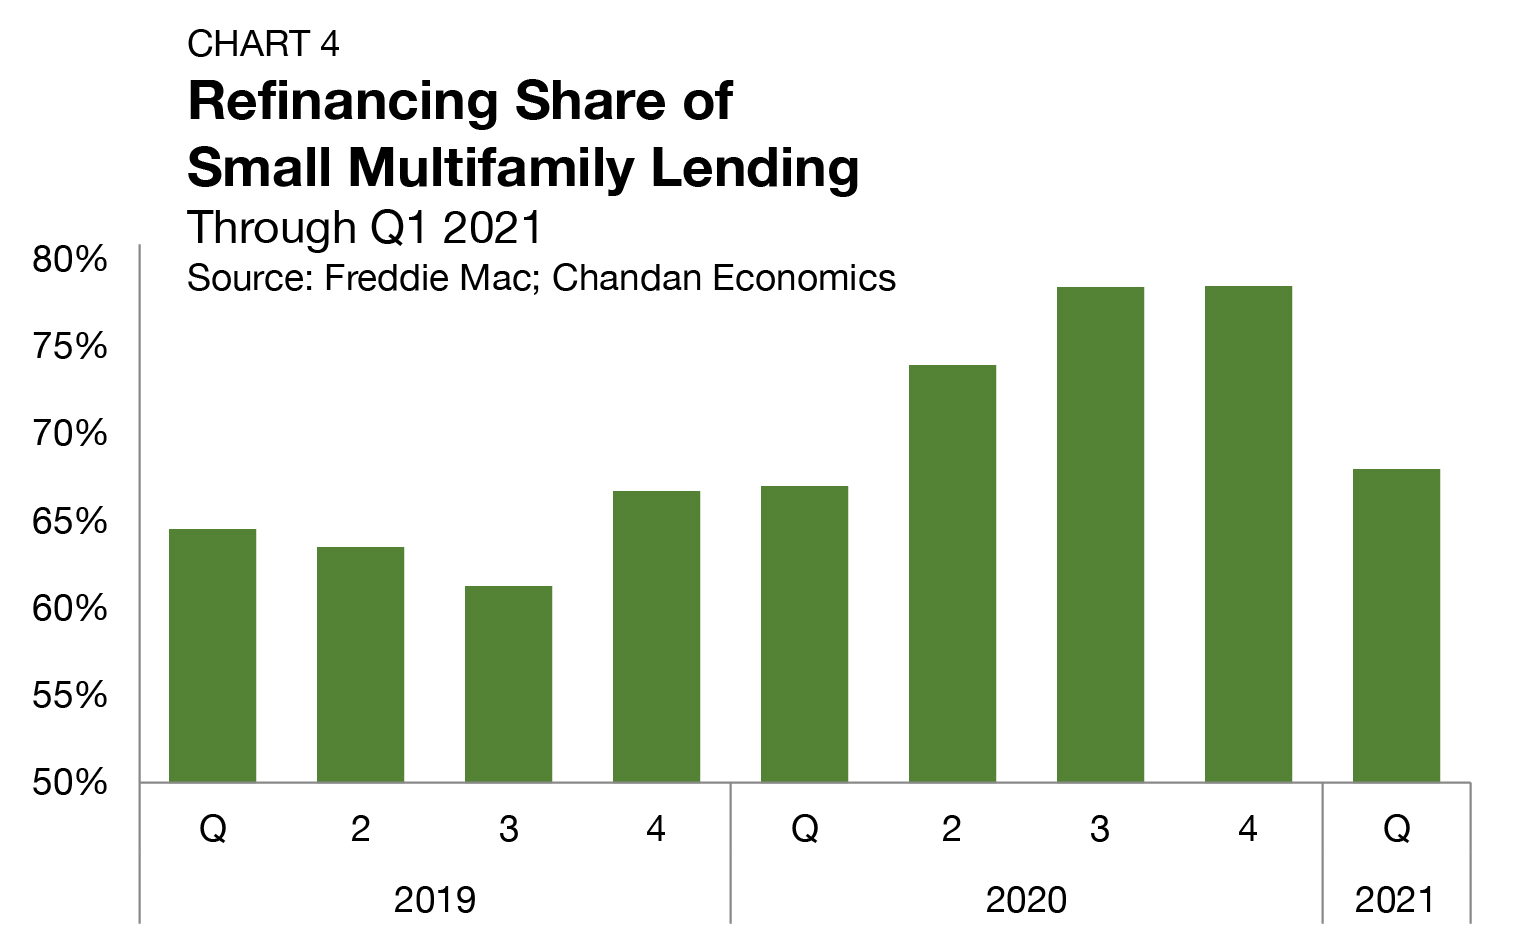
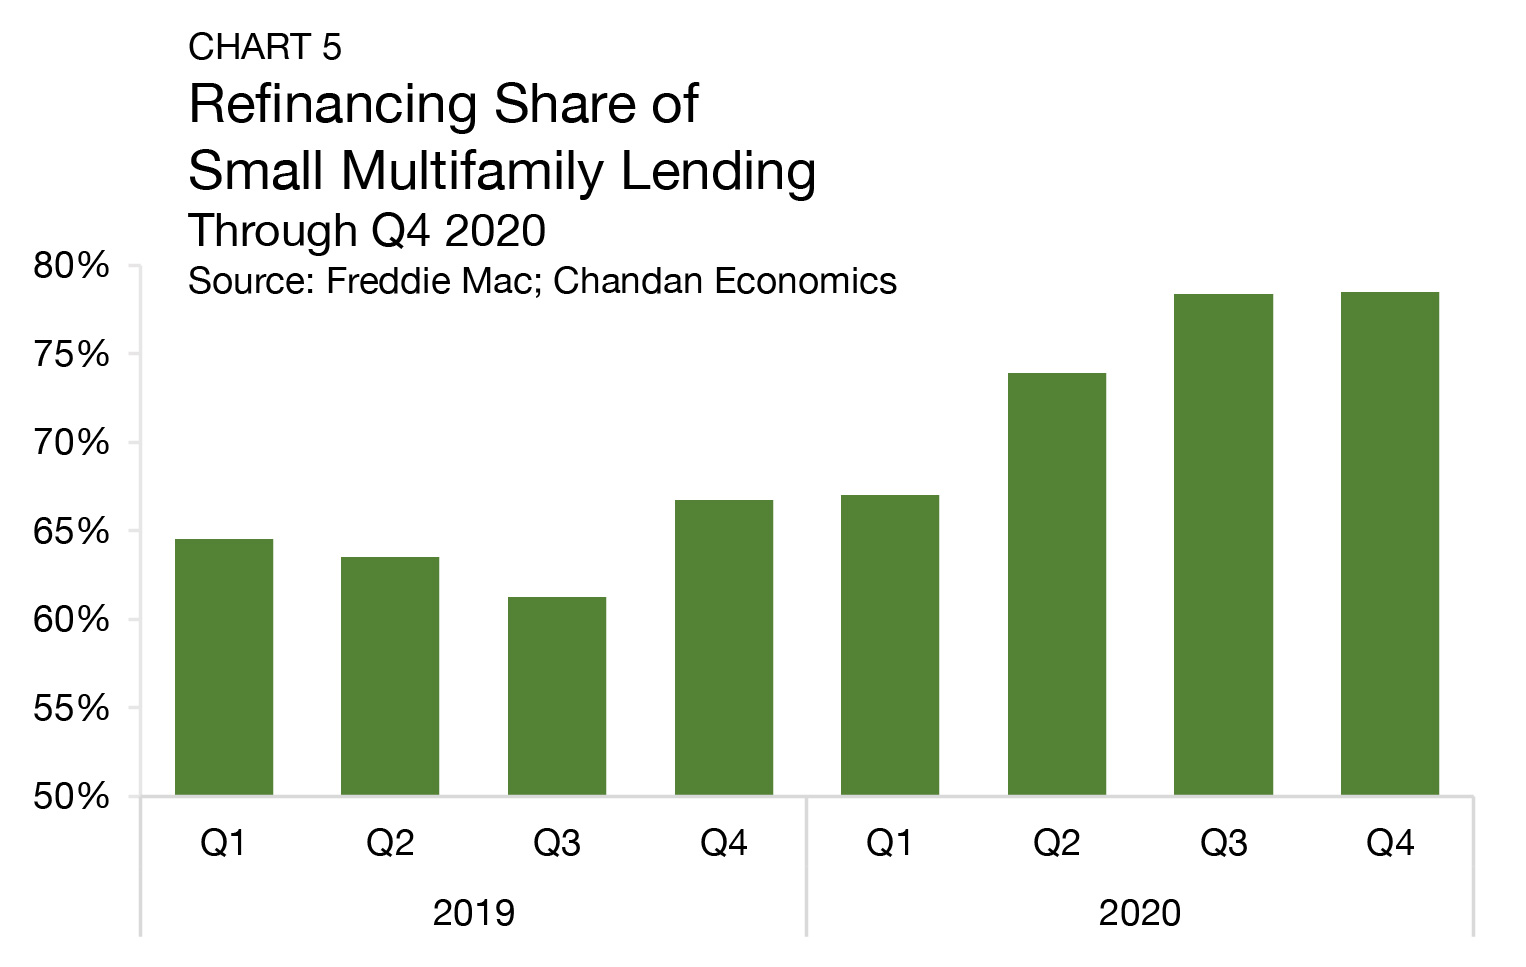
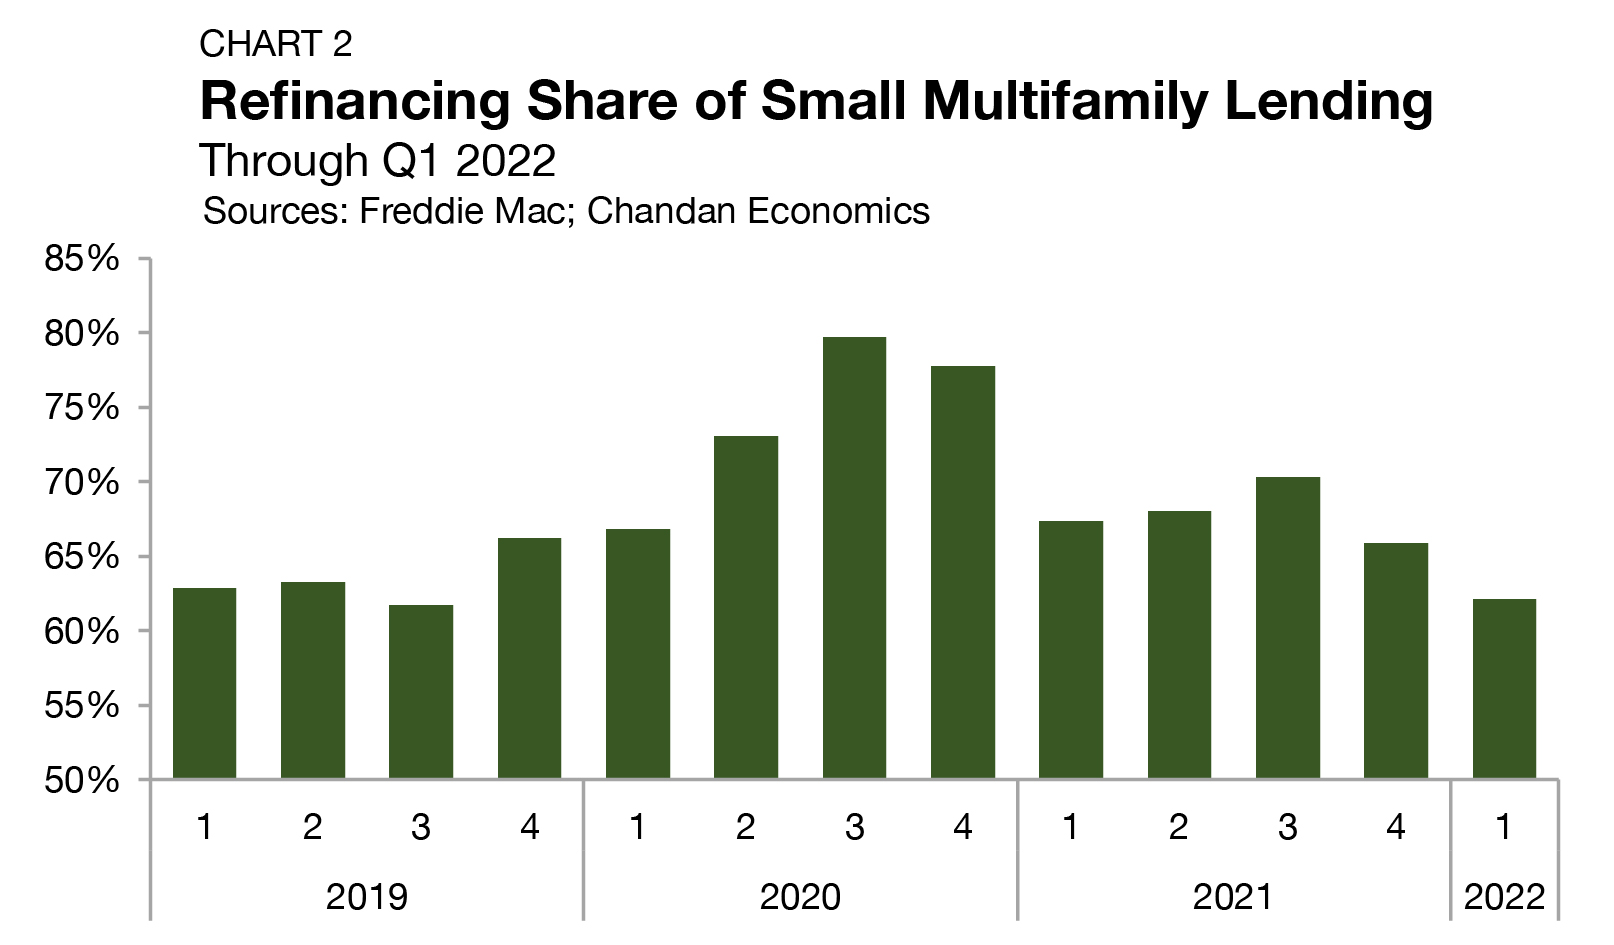
With multifamily transaction activity surging through the end of last year and interest rates on the rise, the balance of small multifamily originations used for the purpose of refinancing versus acquisitions has come back in line with pre-pandemic levels. The refinancing share of small multifamily lending fell to 62.1% in the first quarter of 2022 — its lowest level since the third quarter of 2019 (Chart 2). The refinancing share of originations grew considerably through 2020, reaching a high of 79.7% of new small multifamily debt as lenders kept up production while pandemic-triggered uncertainty limited transactions between buyers and sellers.
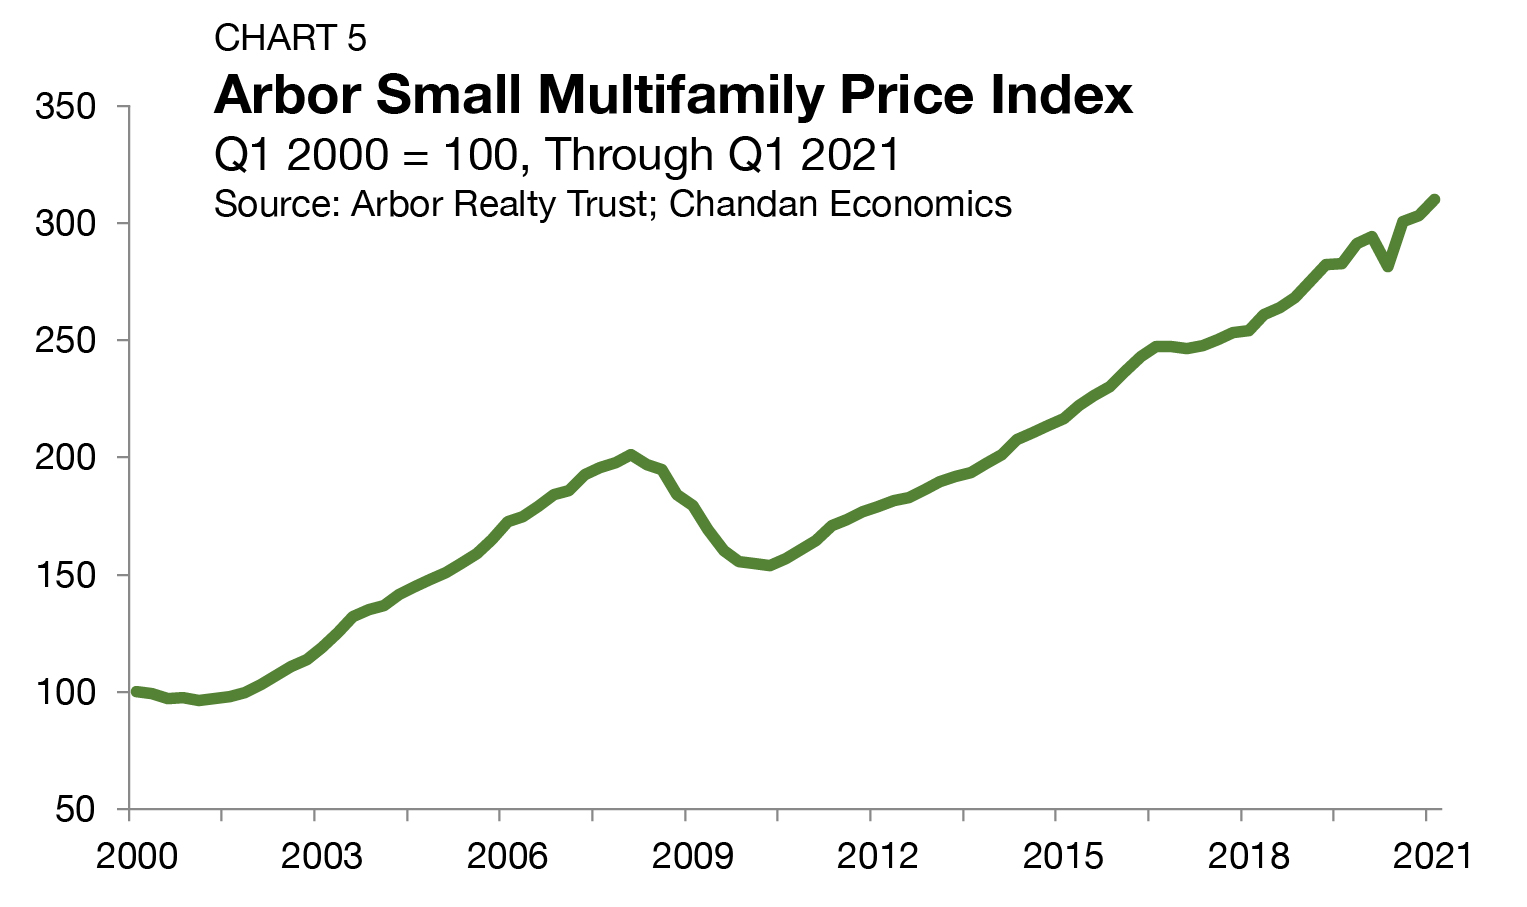
Arbor Small Multifamily Price Index
Cap Rates & Spreads
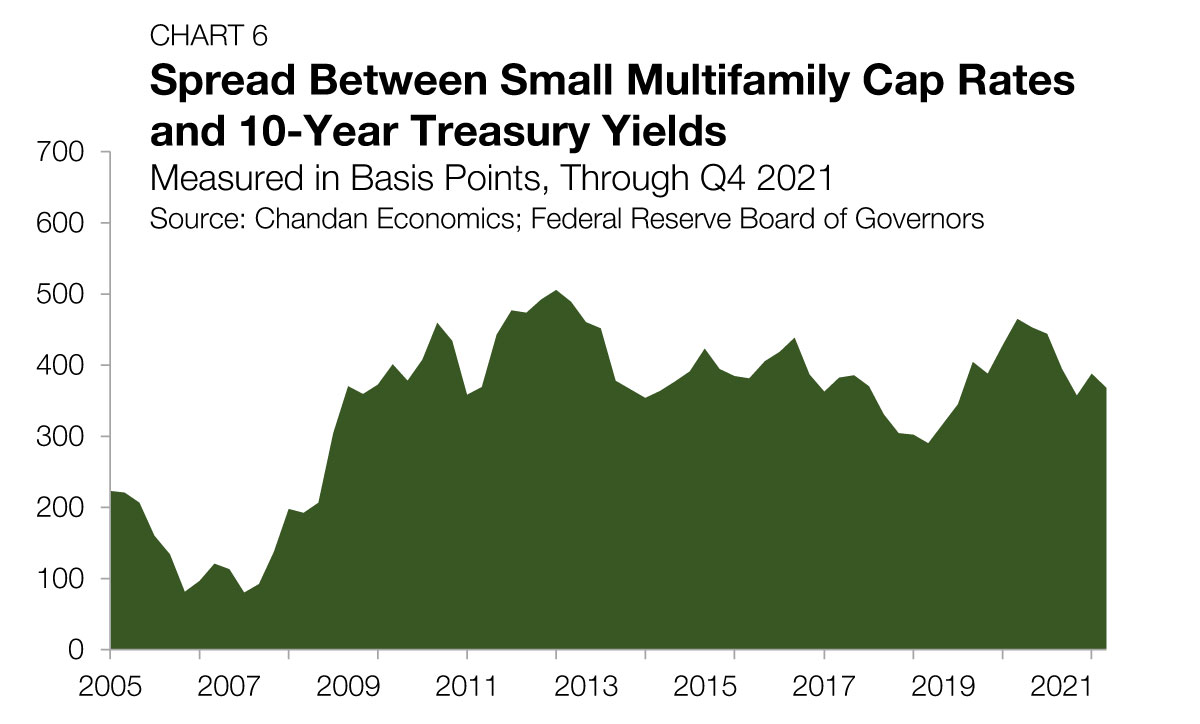
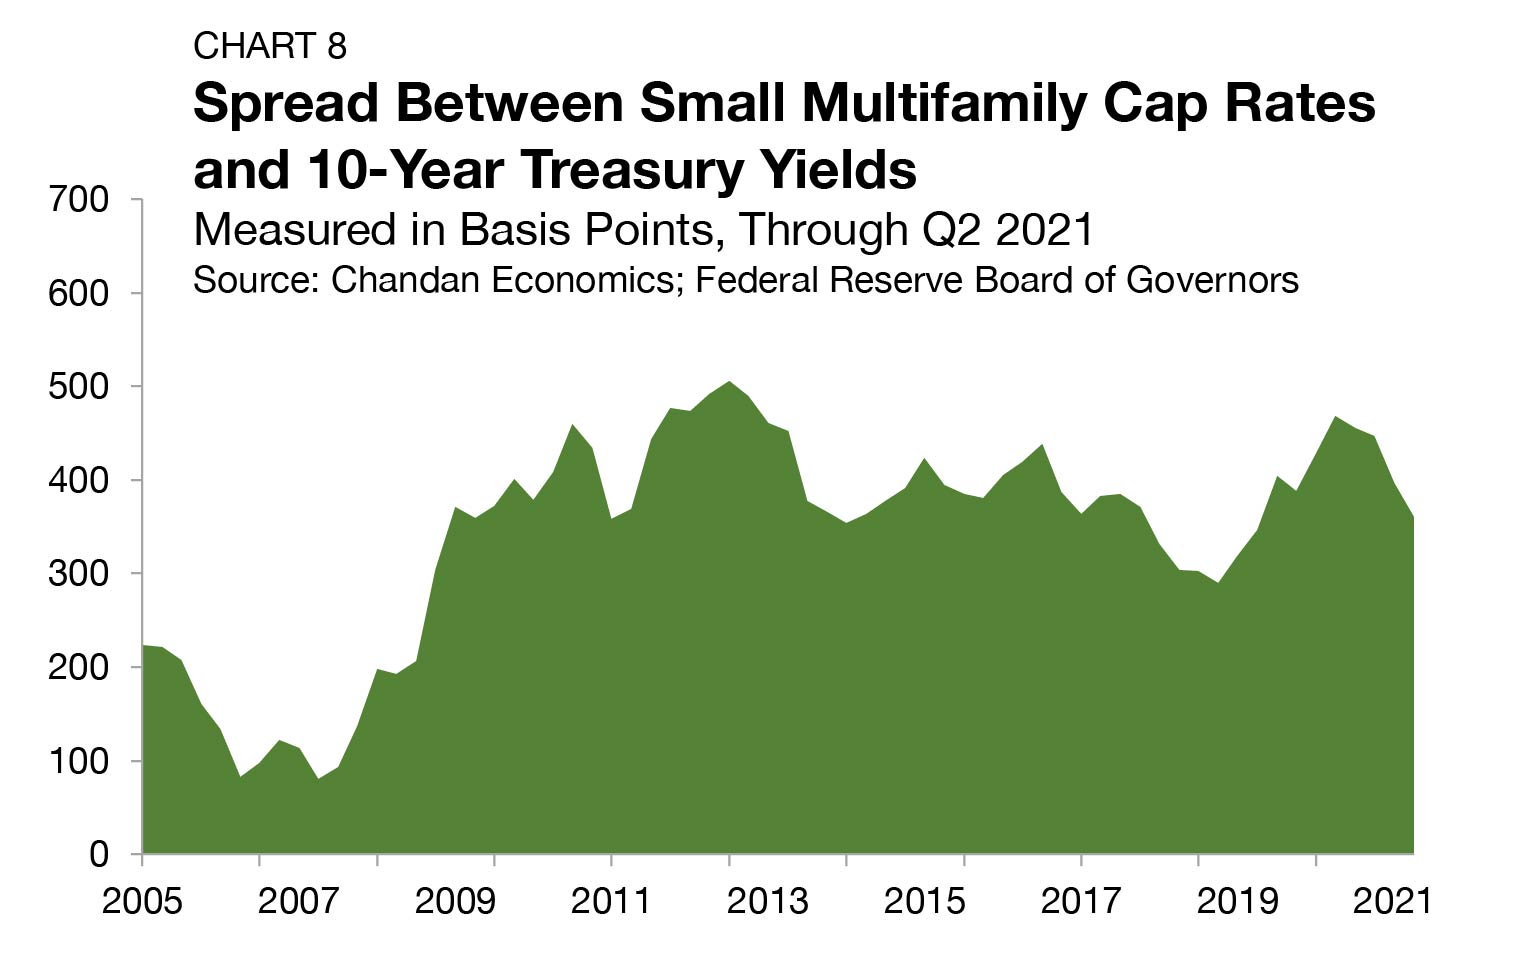
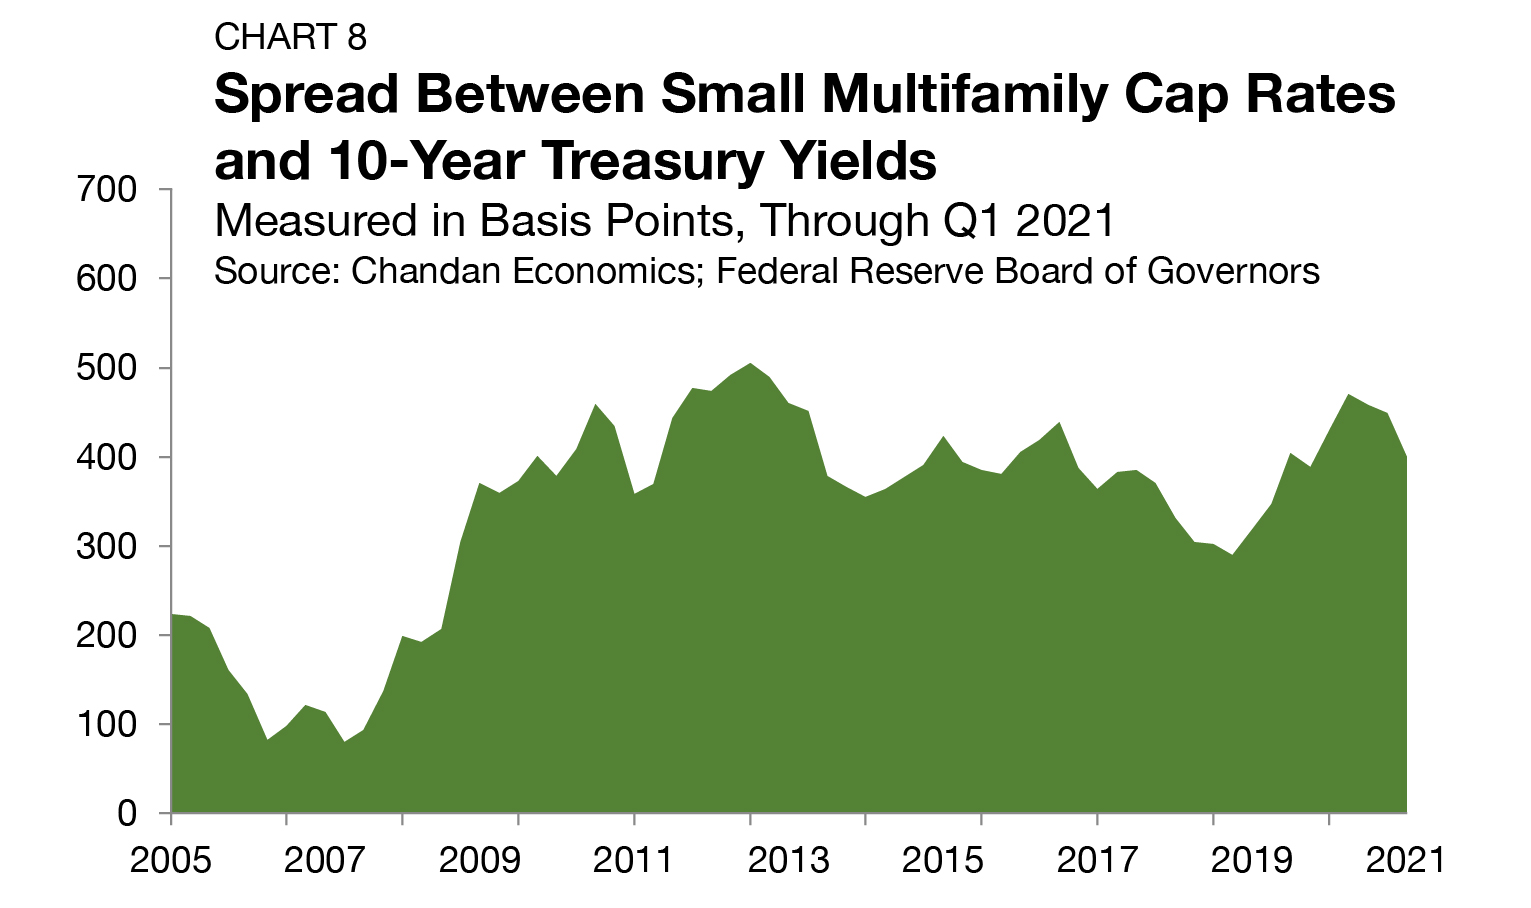
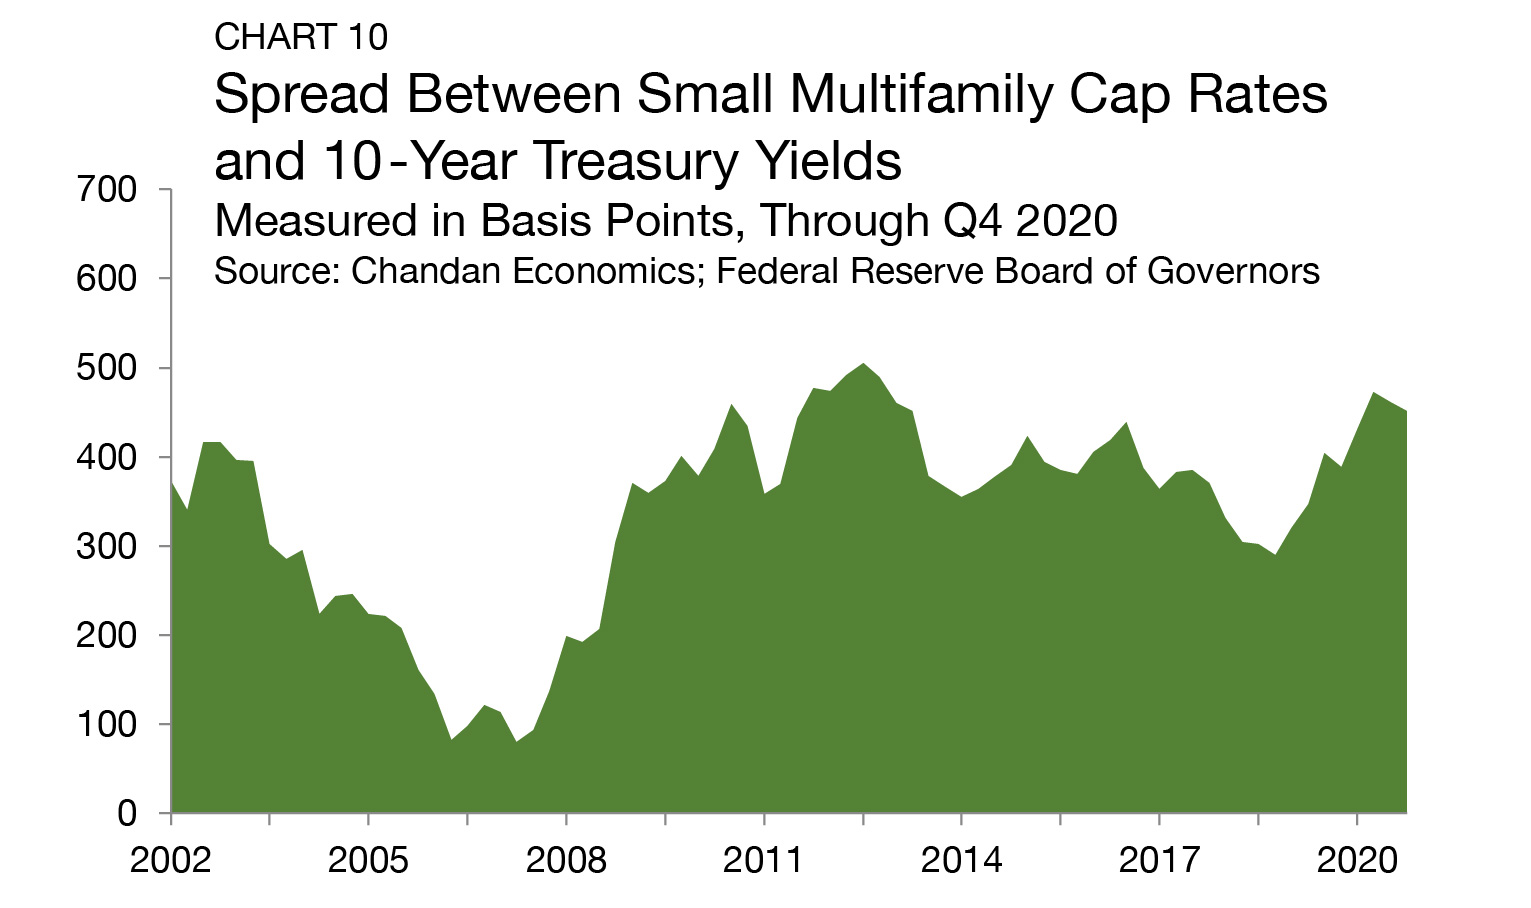
The small multifamily risk premium, a measure of additional compensation that investors require to account for higher levels of risk, is best measured by comparing cap rates to the yield on the 10-Year Treasury. The small multifamily risk premium averaged 321 bps in the first quarter of 2022, down from 370 bps the previous quarter (Chart 6).
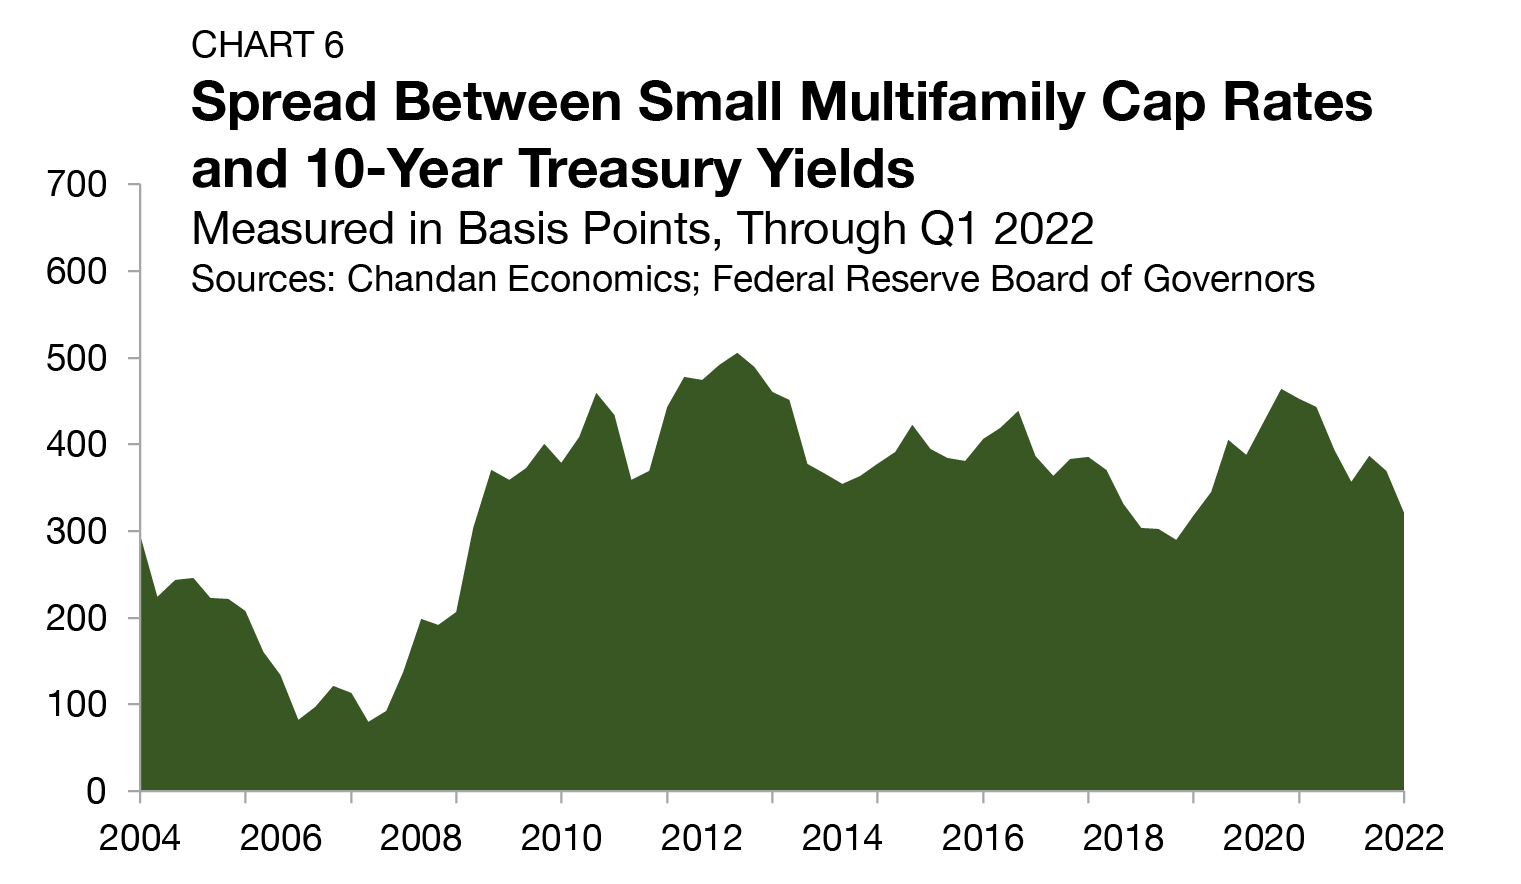
After reaching as high as 464 bps in the second quarter of 2020, risk premiums have normalized, declining in six of the past seven quarters. In 2019, small multifamily risk premiums ranged from 318 bps to 405 bps, indicating that current levels are in-line with pre-pandemic risk assessments.
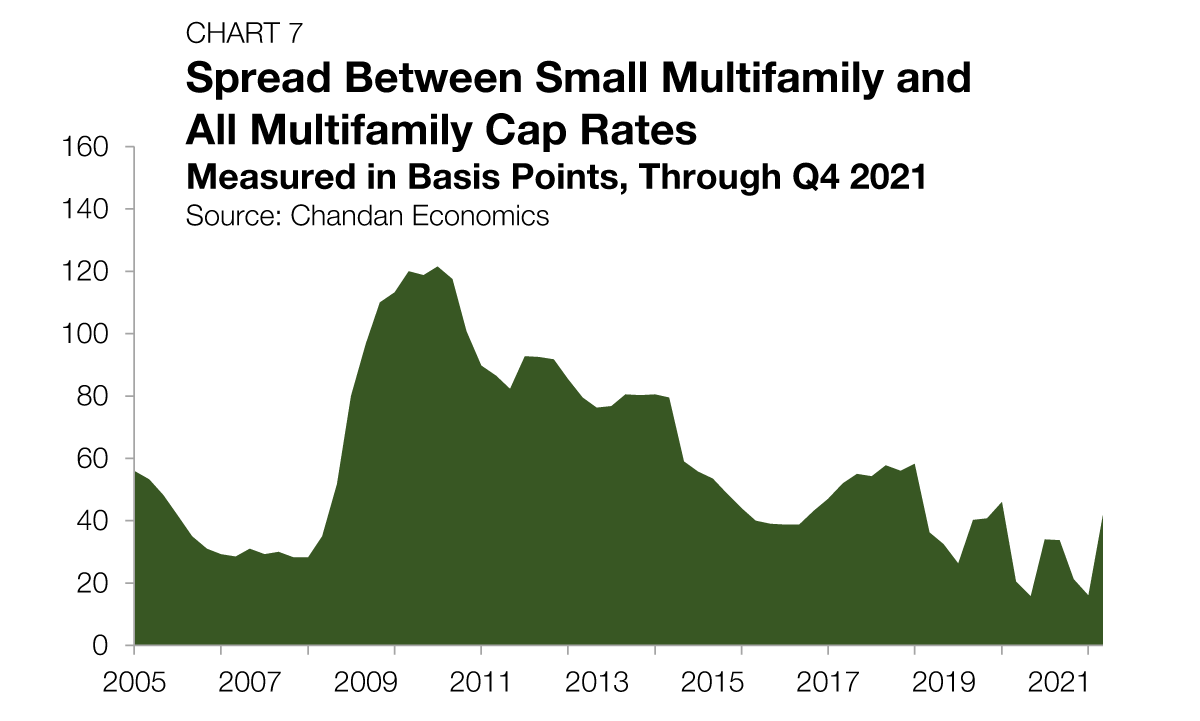
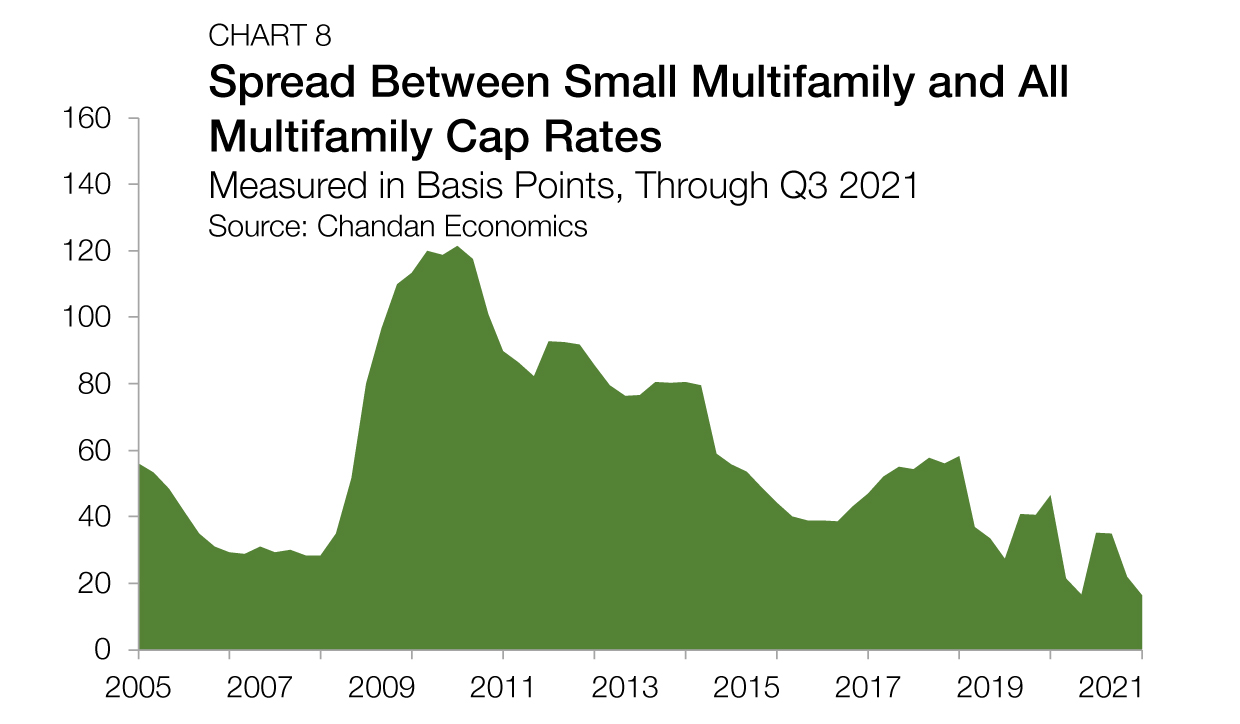
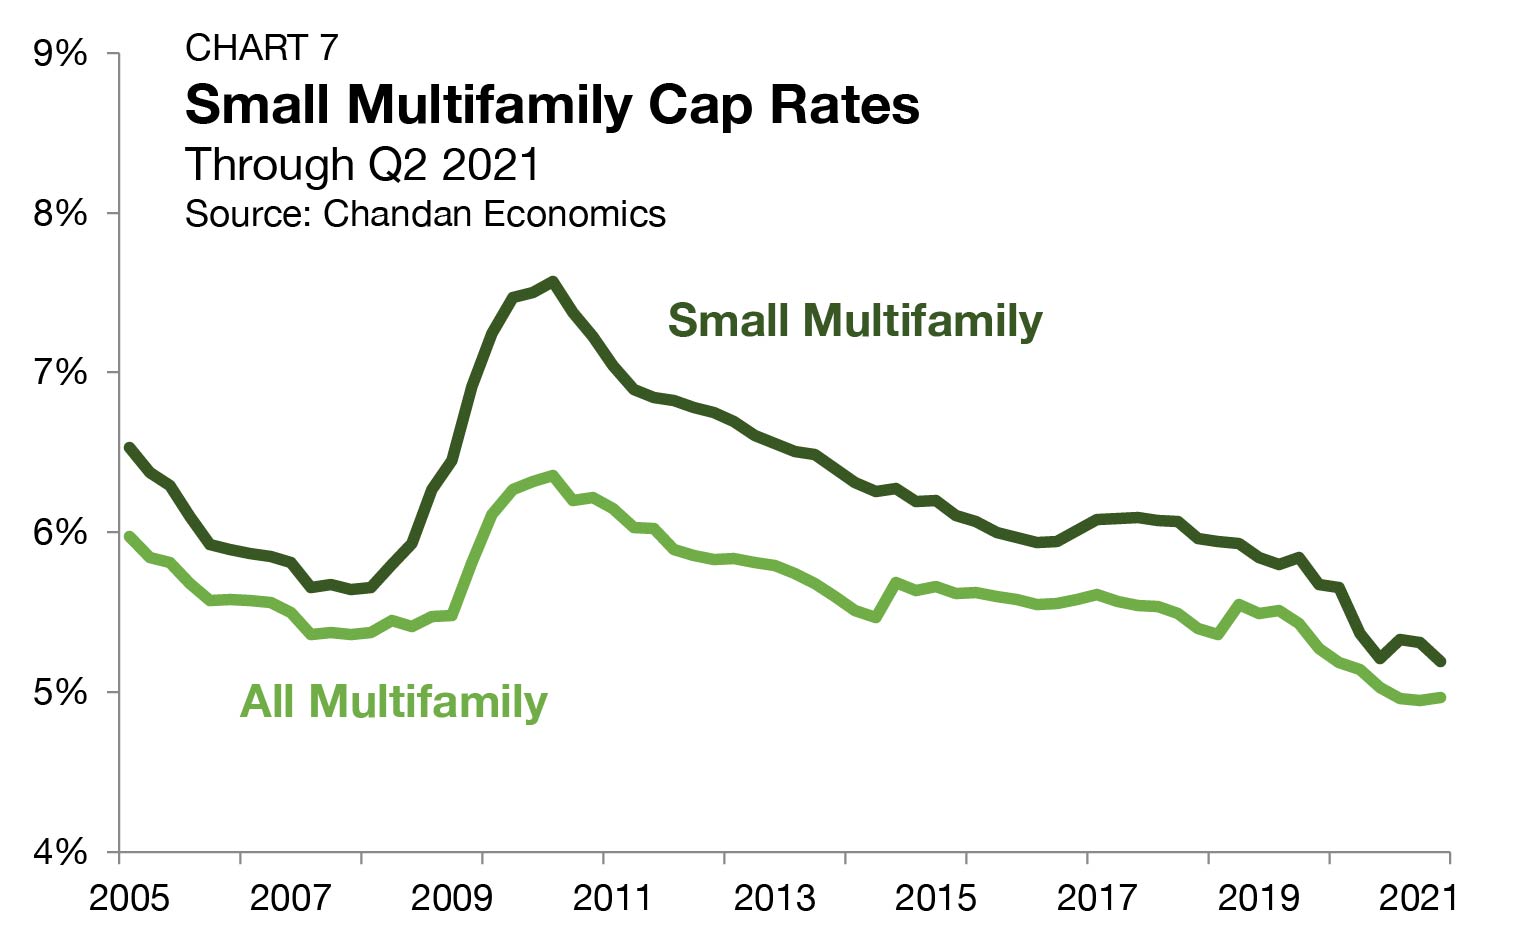
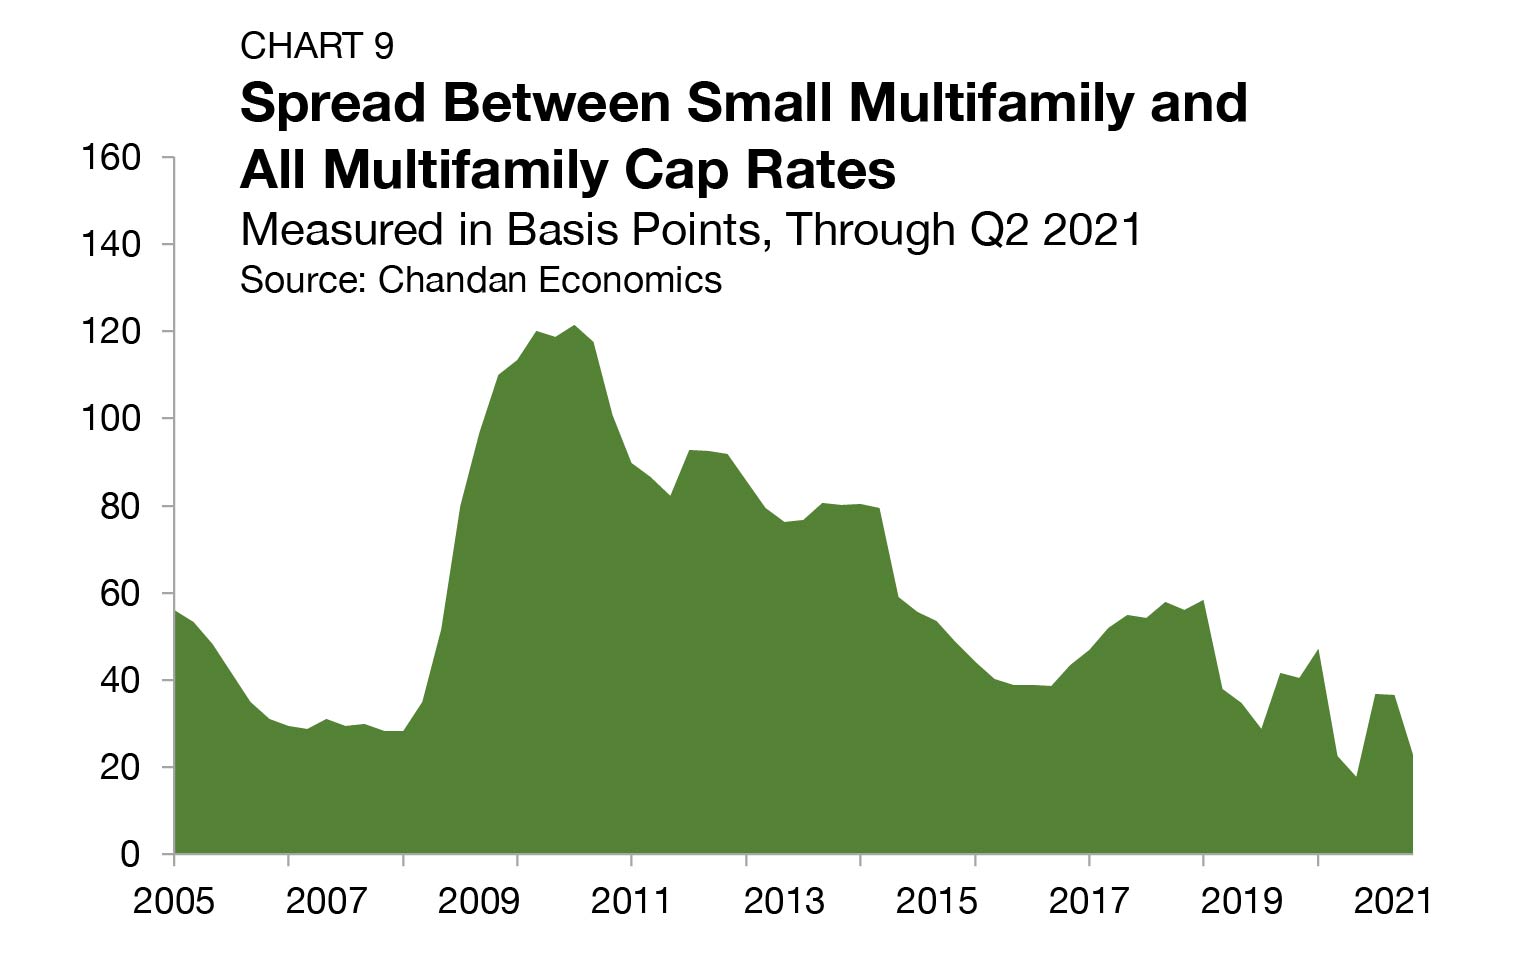
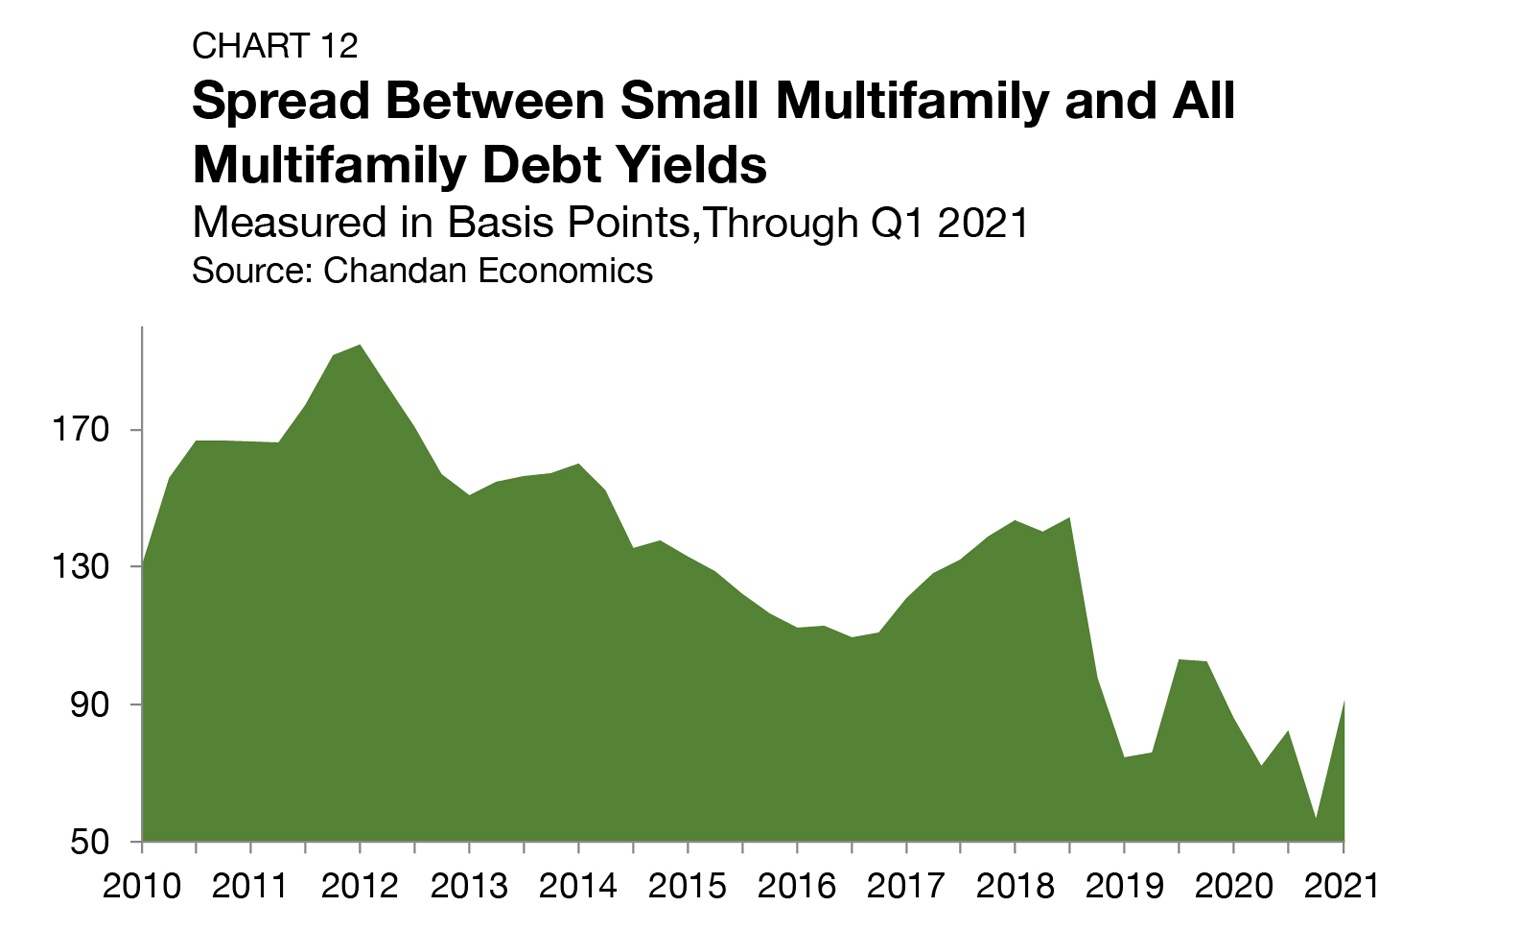
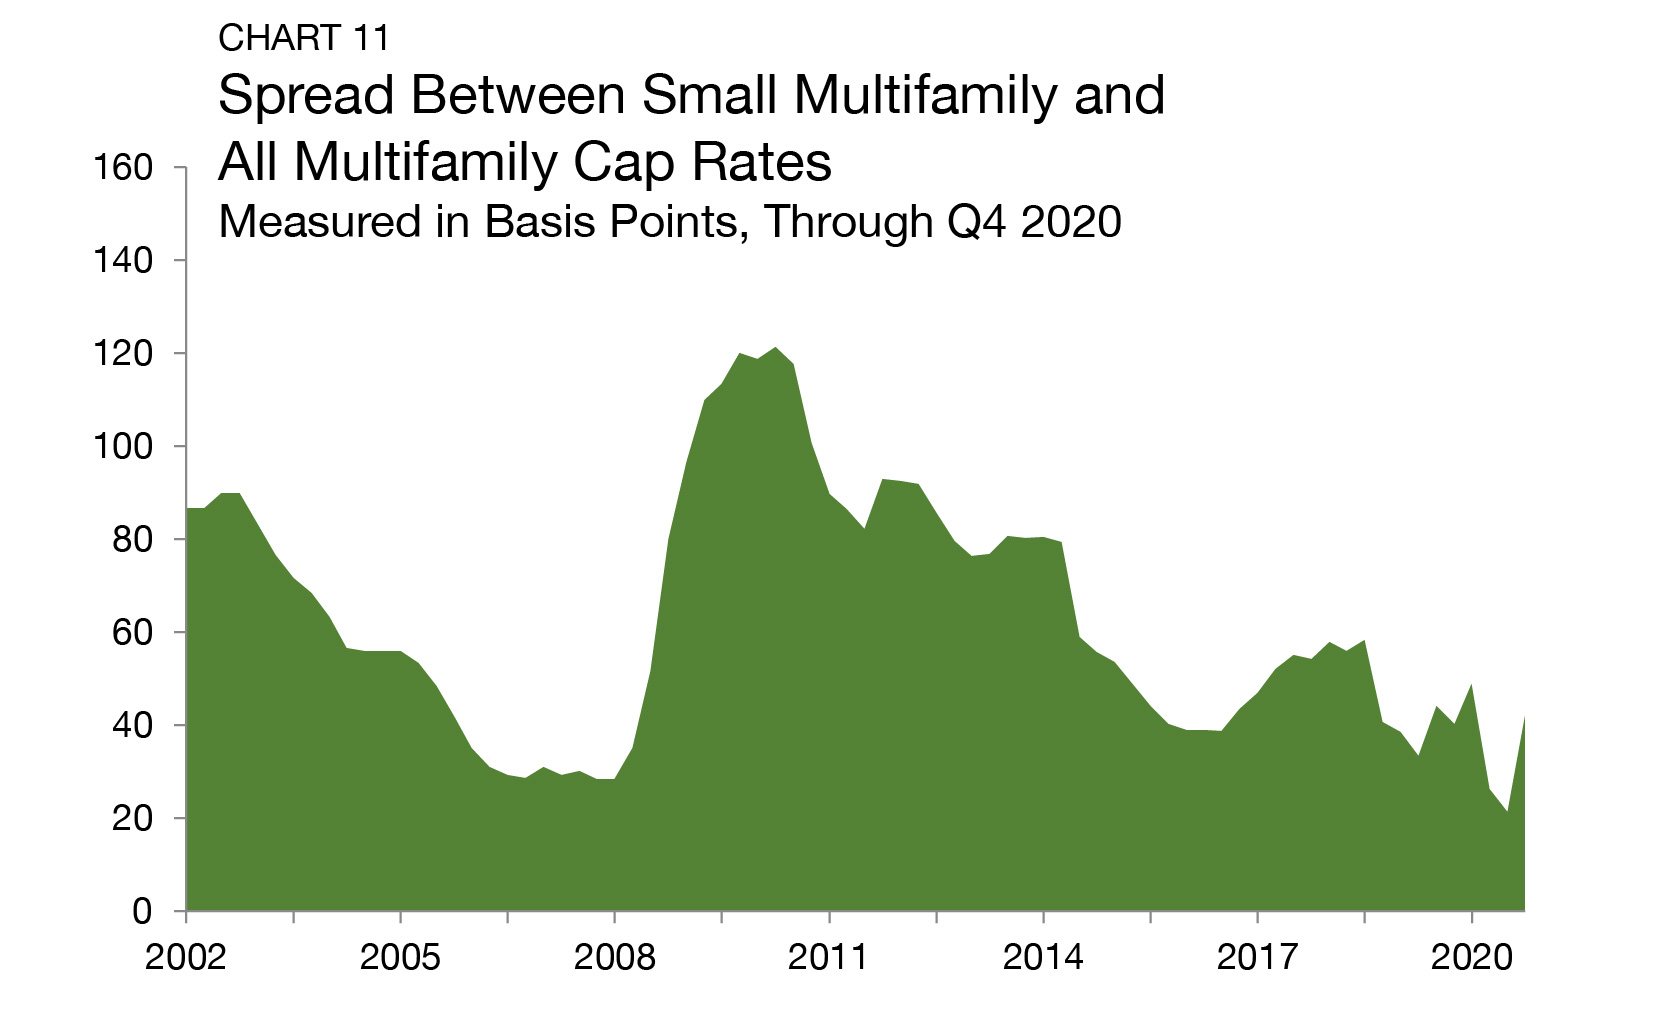
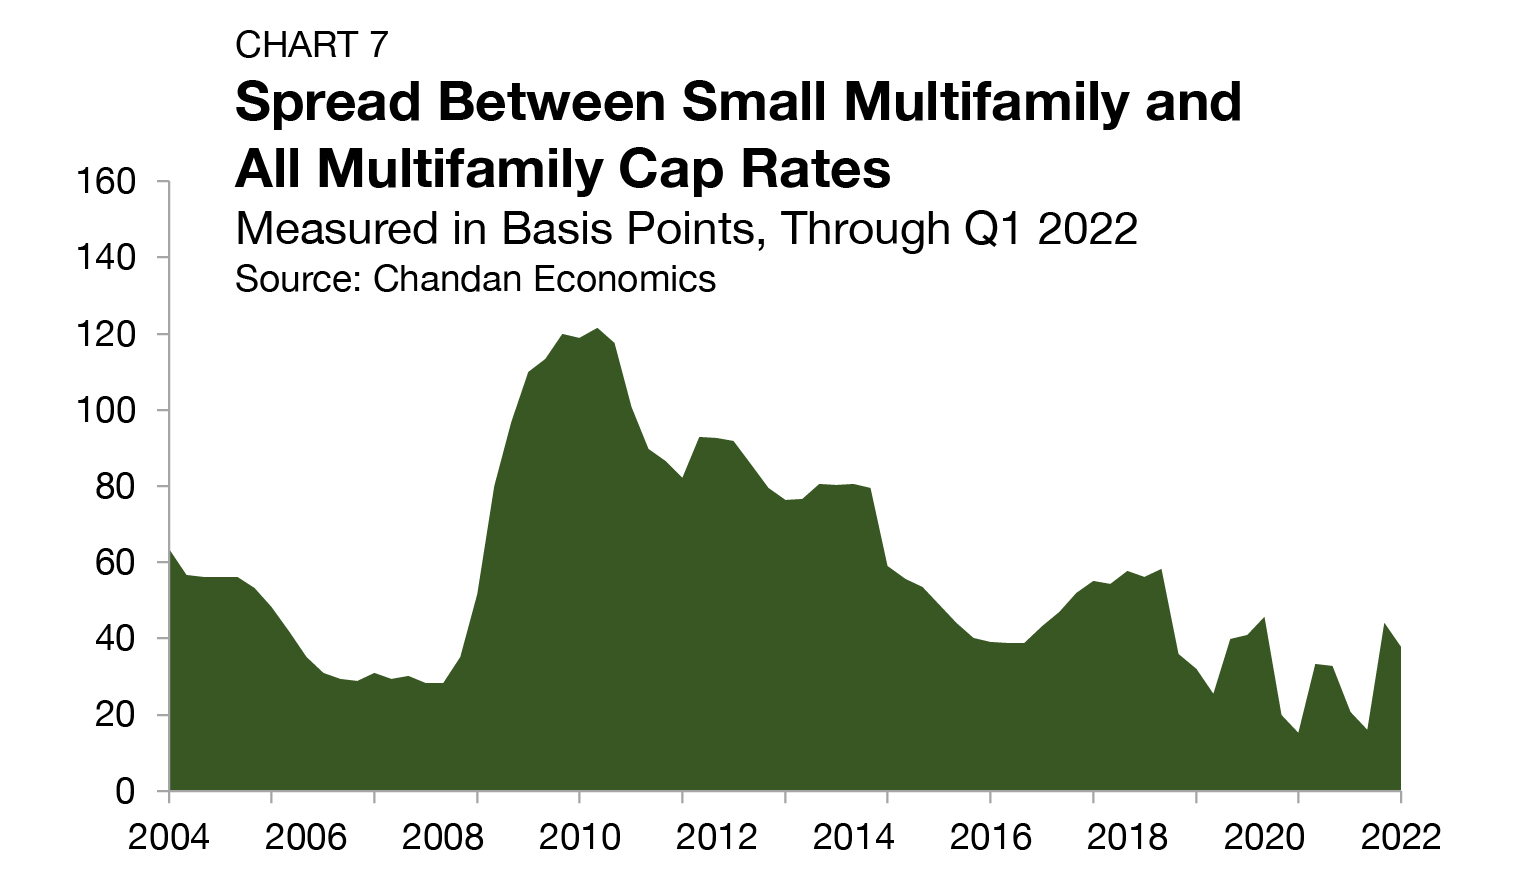
The cap rate spread between small multifamily assets and the rest of the multifamily sector, a measure of the risk unique to smaller properties, declined by 6 bps, settling at 38 bps (Chart 7).
Expense Ratios
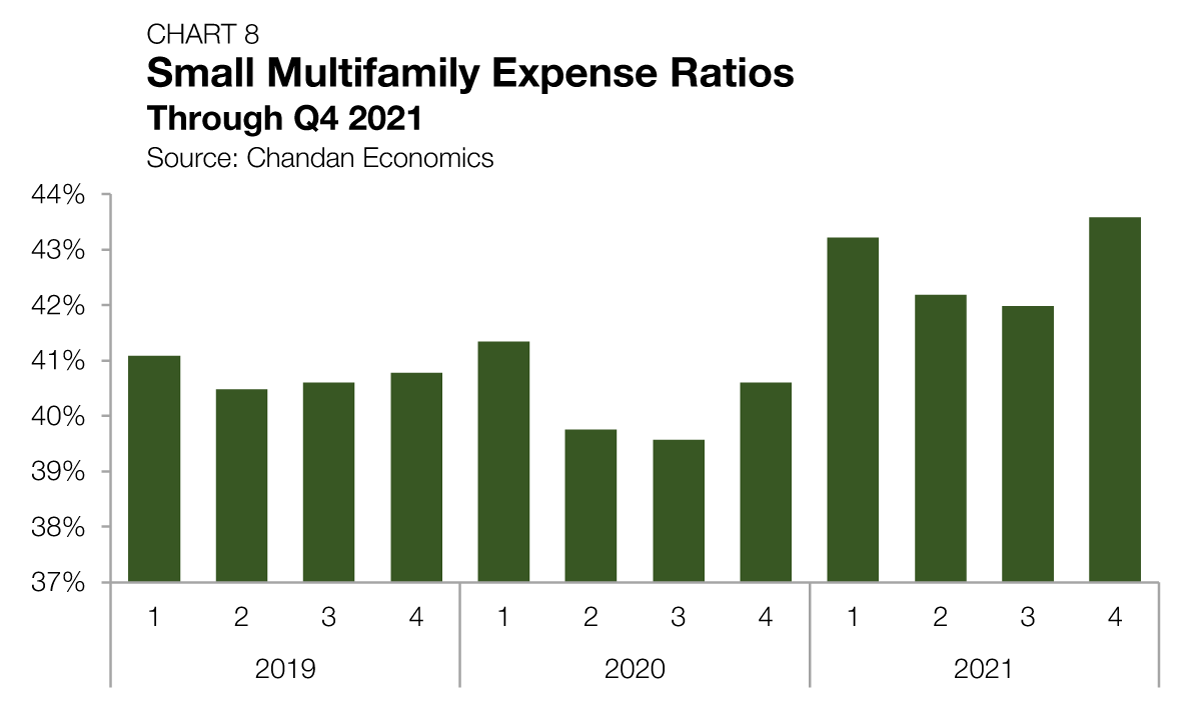
Expense ratios, measured as the relationship between underwritten property-level expenses to effective gross income, surged for small multifamily properties in 2021 — averaging 42.6% for the year and hitting a quarterly high of 43.5% in the fourth quarter (Chart 8). Rising expense ratios may signal that apartment operators have not been able to boost rents enough to offset rising expenses. According to an analysis by the National Apartment Association, renter delinquencies and rising operating expenses, namely insurance premiums, have squeezed net returns during the pandemic.
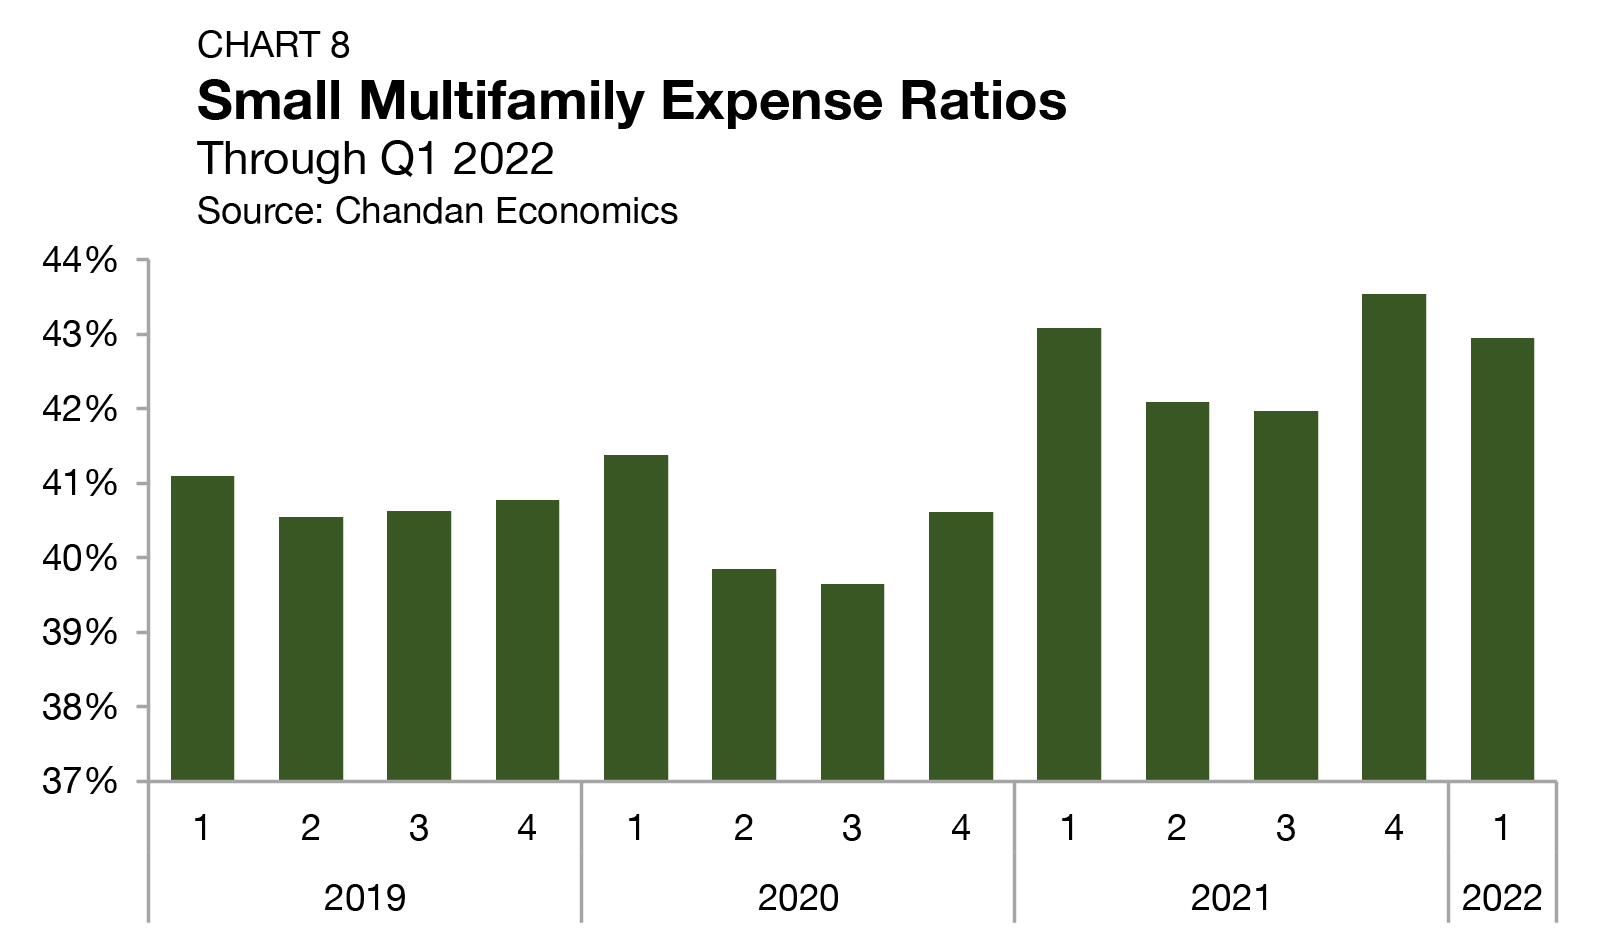
Moreover, a pandemic-era dip in rent collections has also impacted property-level cash flows. However, according to a Chandan Economics analysis of RentRedi data, on-time payments in small multifamily properties have recovered to their pre-pandemic levels. While expense ratios remained elevated at 43.0% through the first quarter of 2022, they are down by 59 bps from the previous quarter. Further, according to an analysis by CoreLogic, rent growth historically has lagged inflation — suggesting that rent growth should continue through 2022. As long as rent growth holds strong this year, there is a mechanism for expense ratios to fall back in-line with pre-pandemic levels.
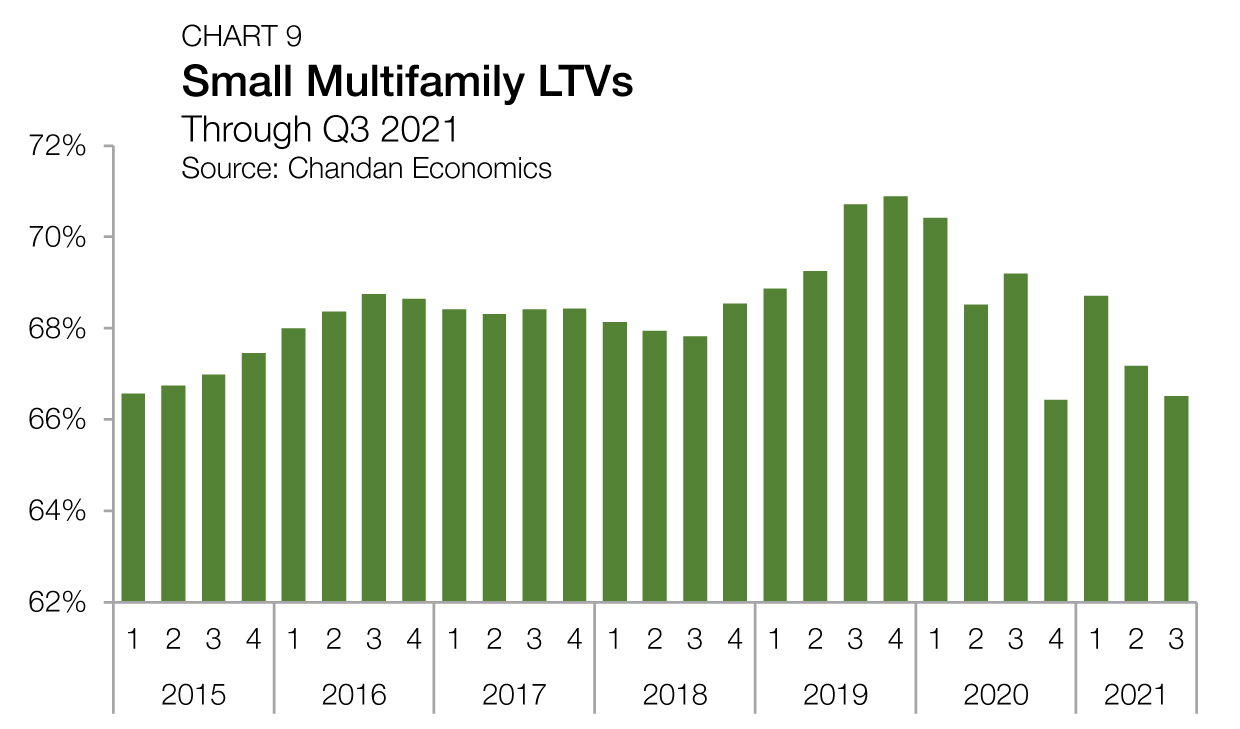
Leverage & Debt Yields
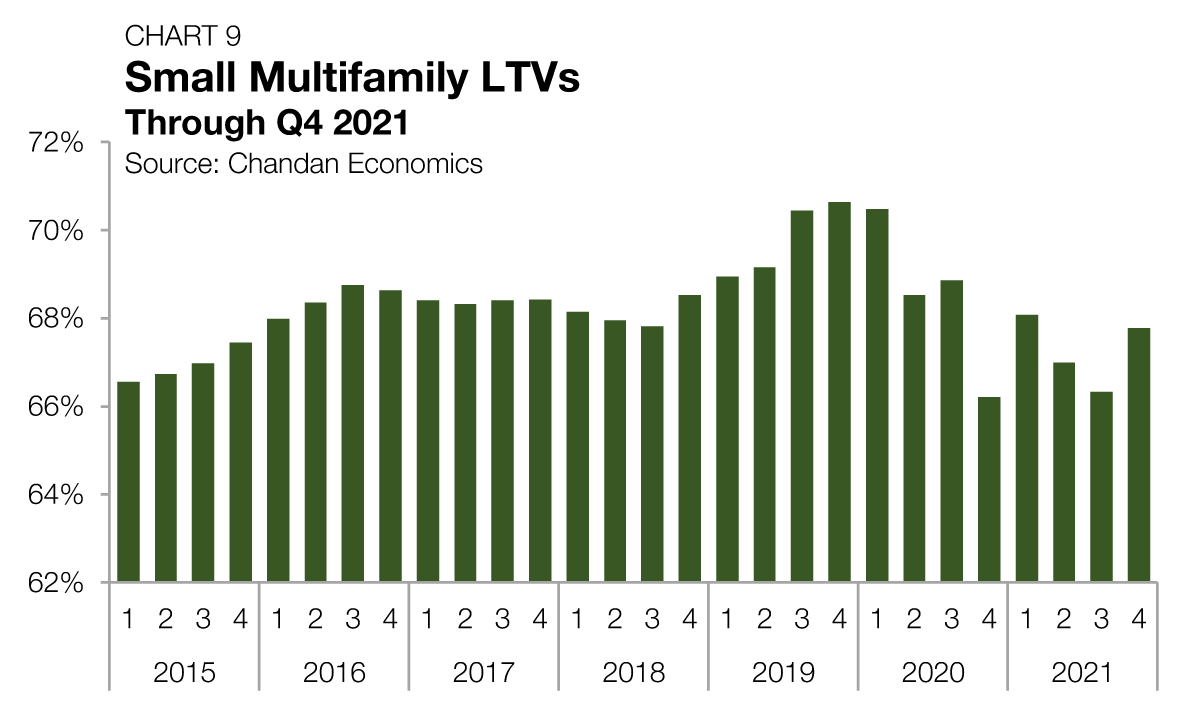
During the first year of the pandemic, loan-to-value ratios (LTVs) on newly originated small multifamily loans cratered— declining from 70.5% in first-quarter 2020 to a low of 66.0% by the fourth quarter of 2020. However, after leveling out in early 2021, small multifamily LTVs have started to make progress towards recovery. Through the first quarter of 2022, small multifamily LTVs averaged 67.8% — its highest level since the second quarter of 2020.

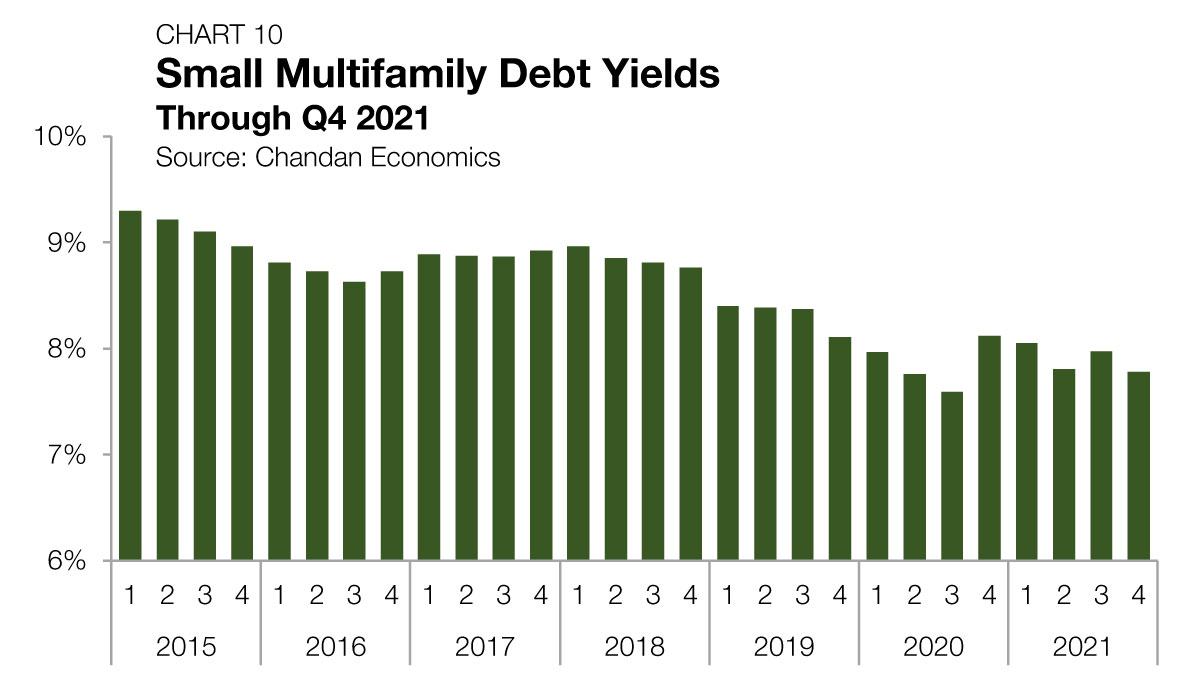
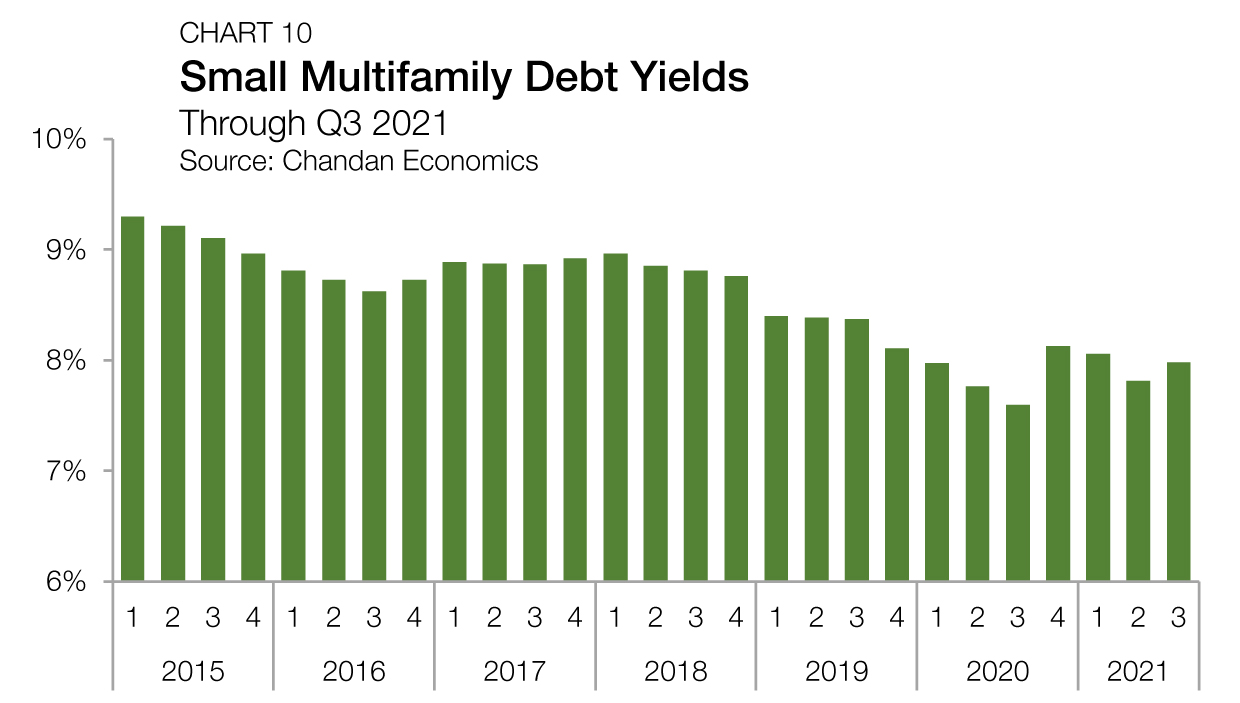
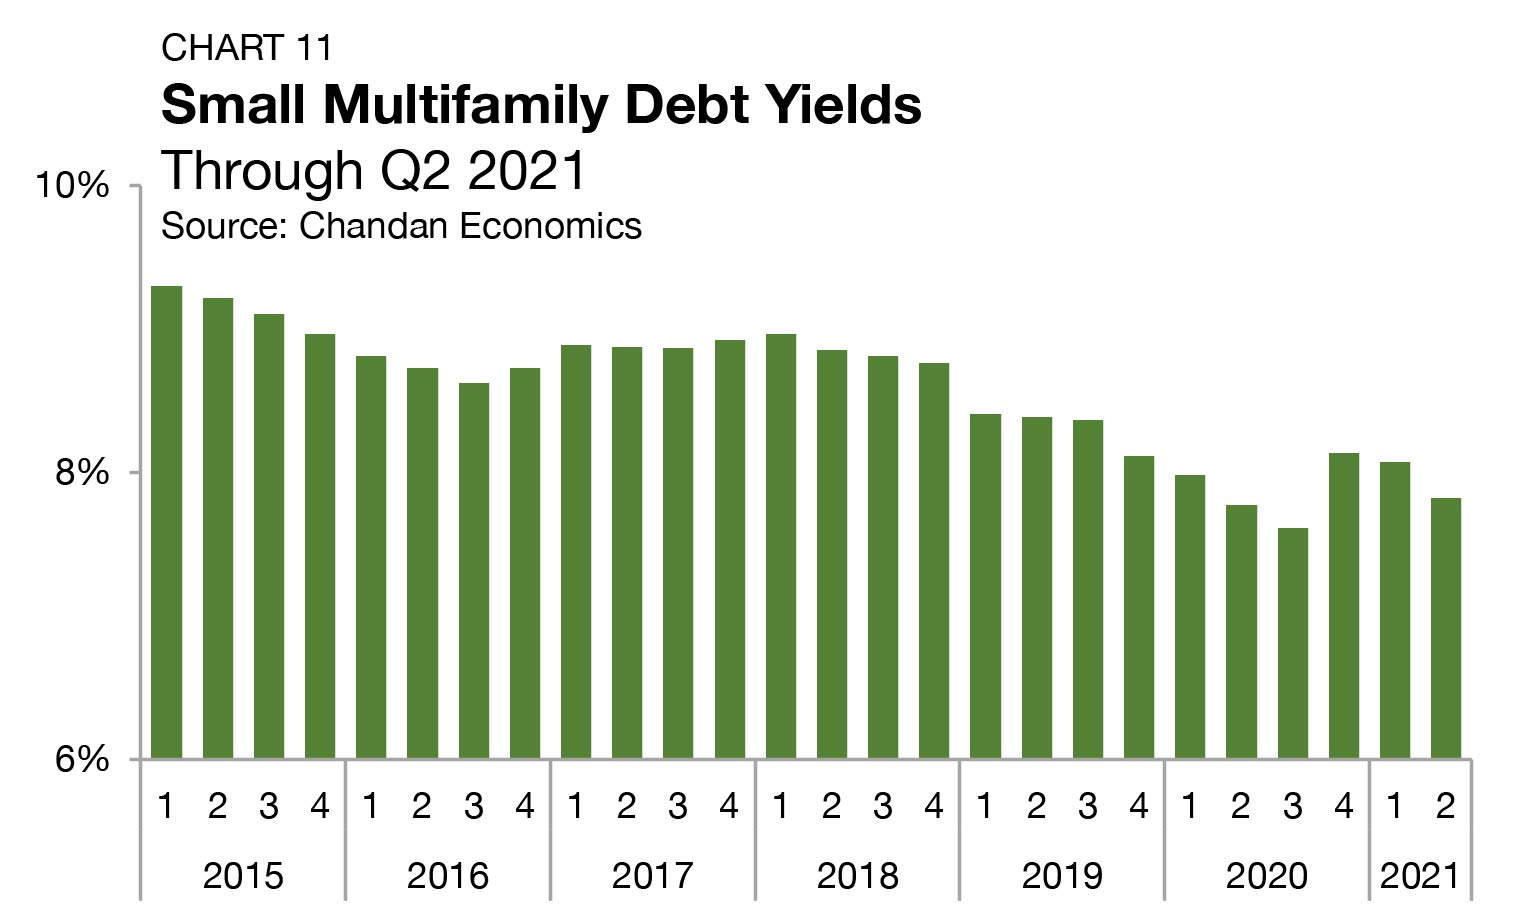
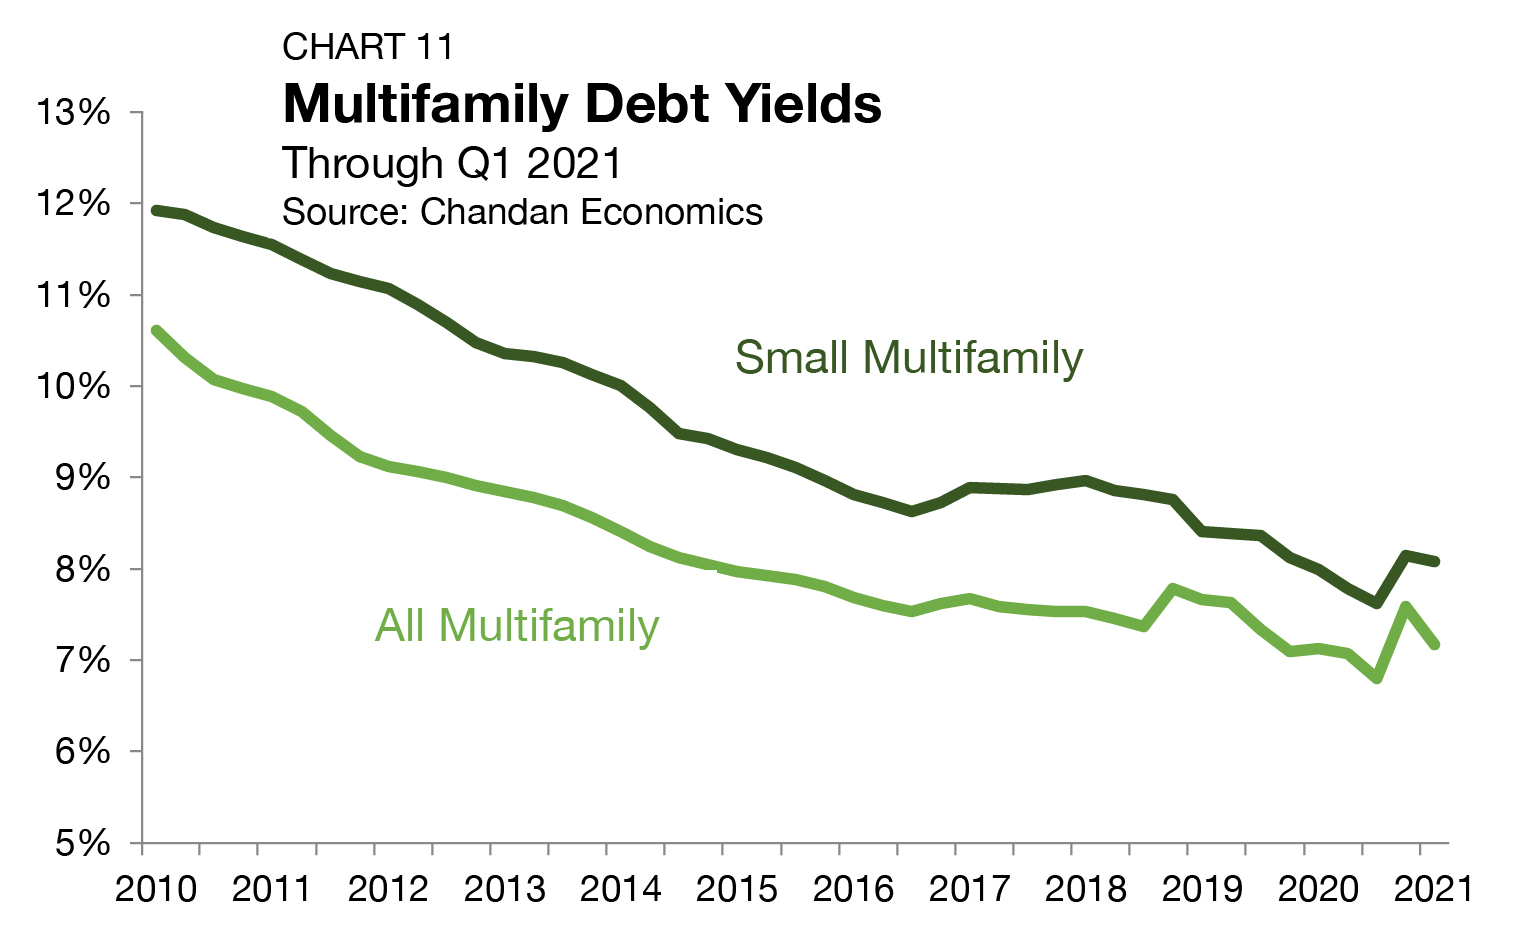
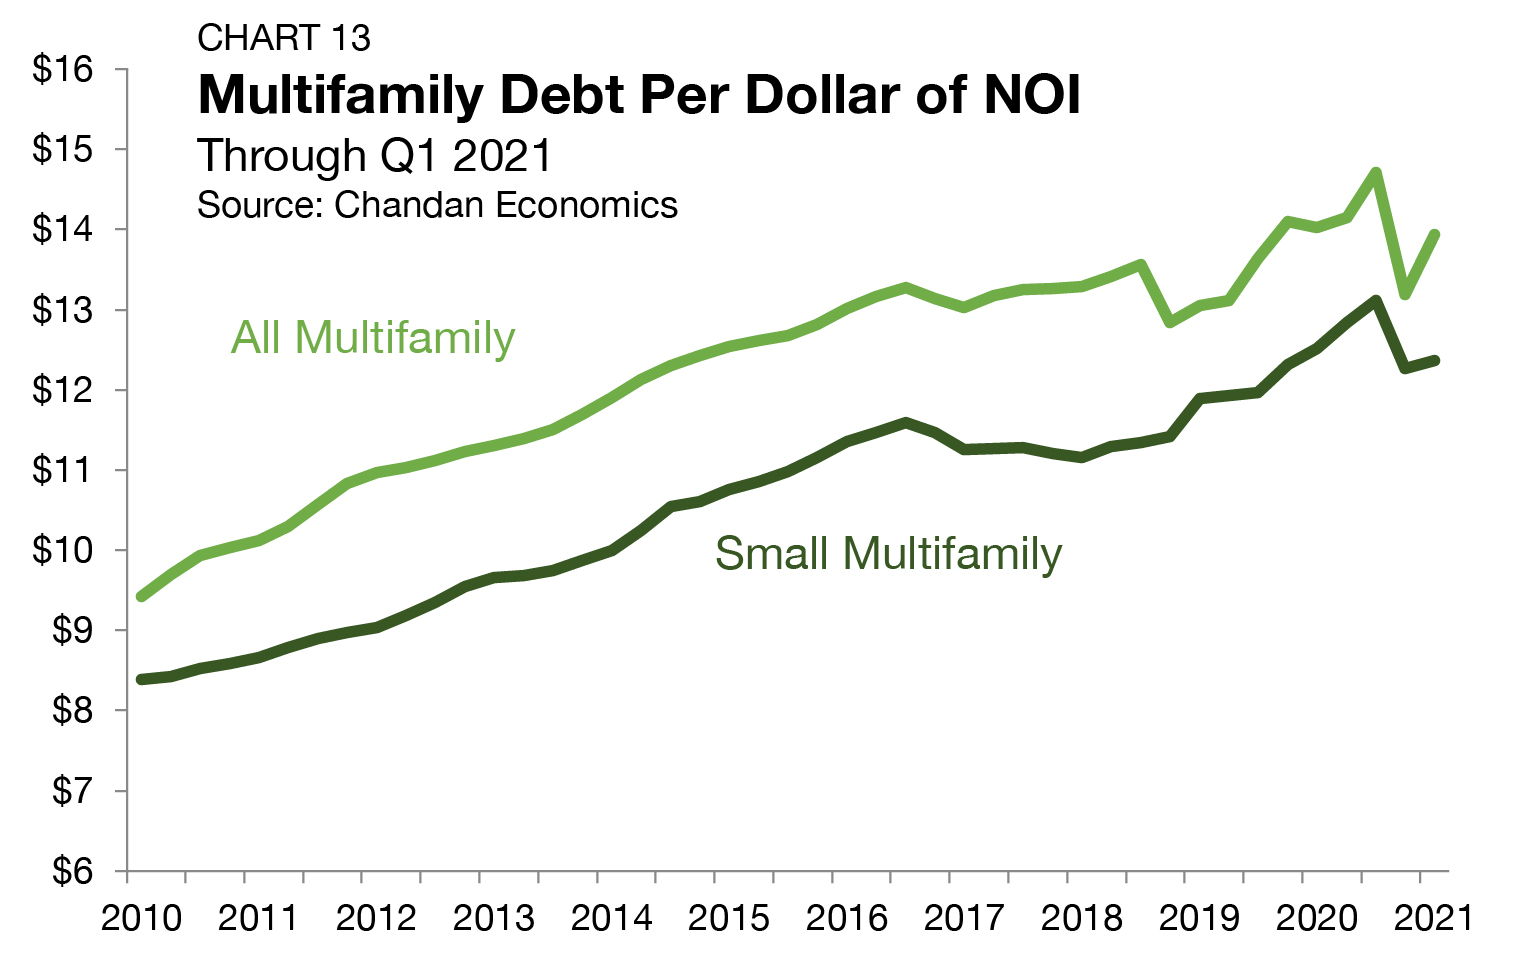
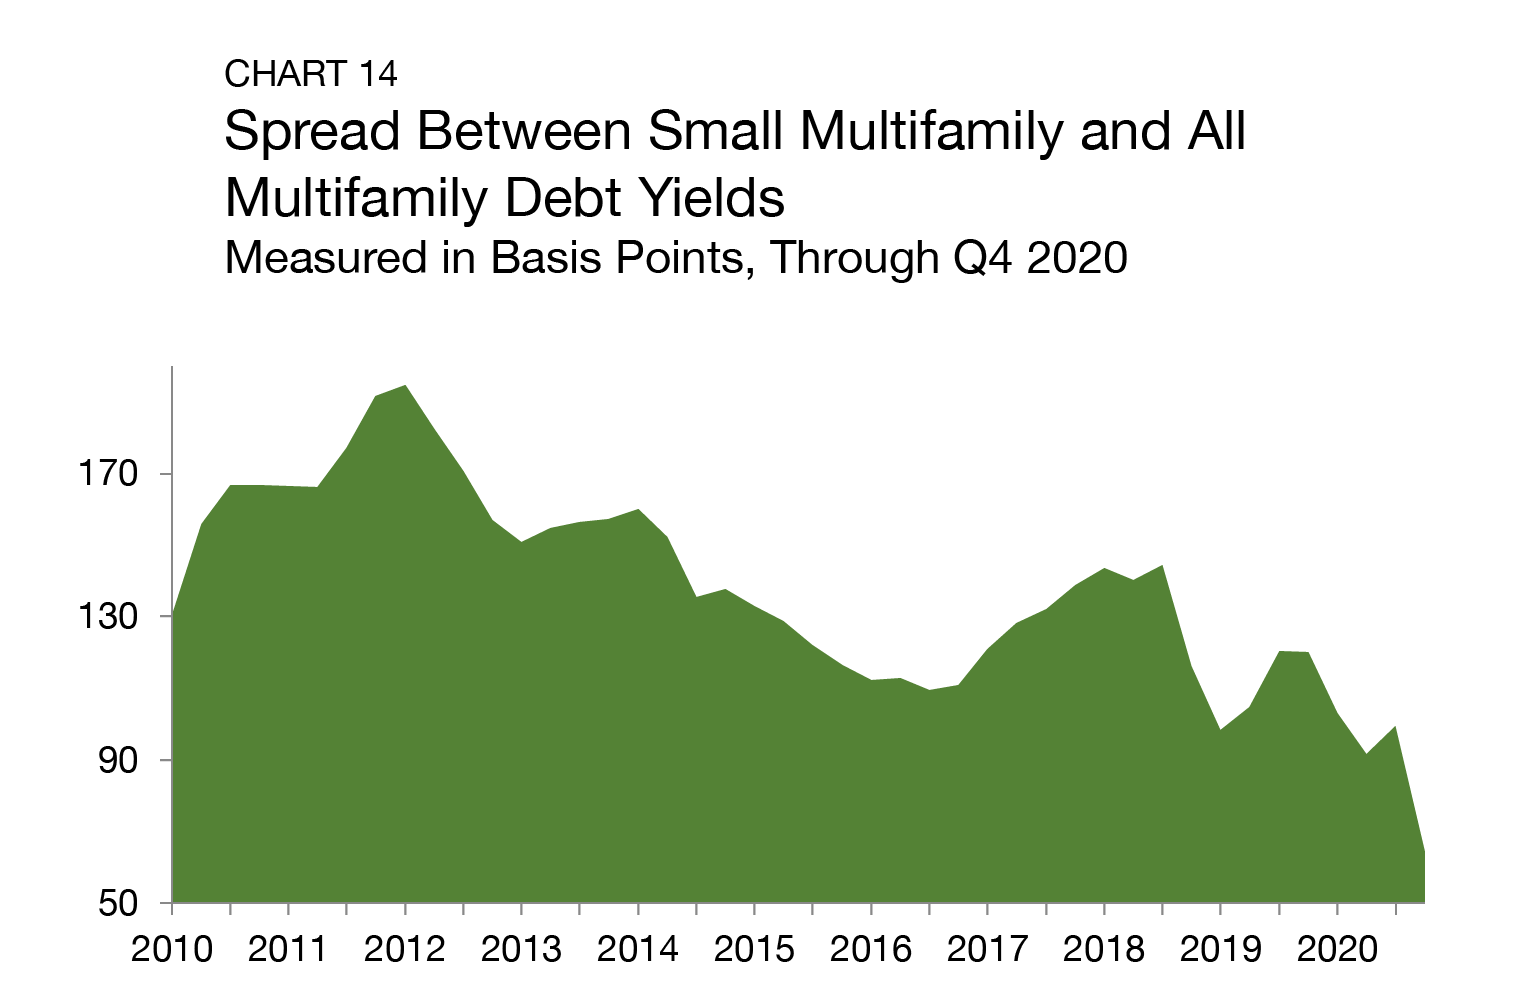
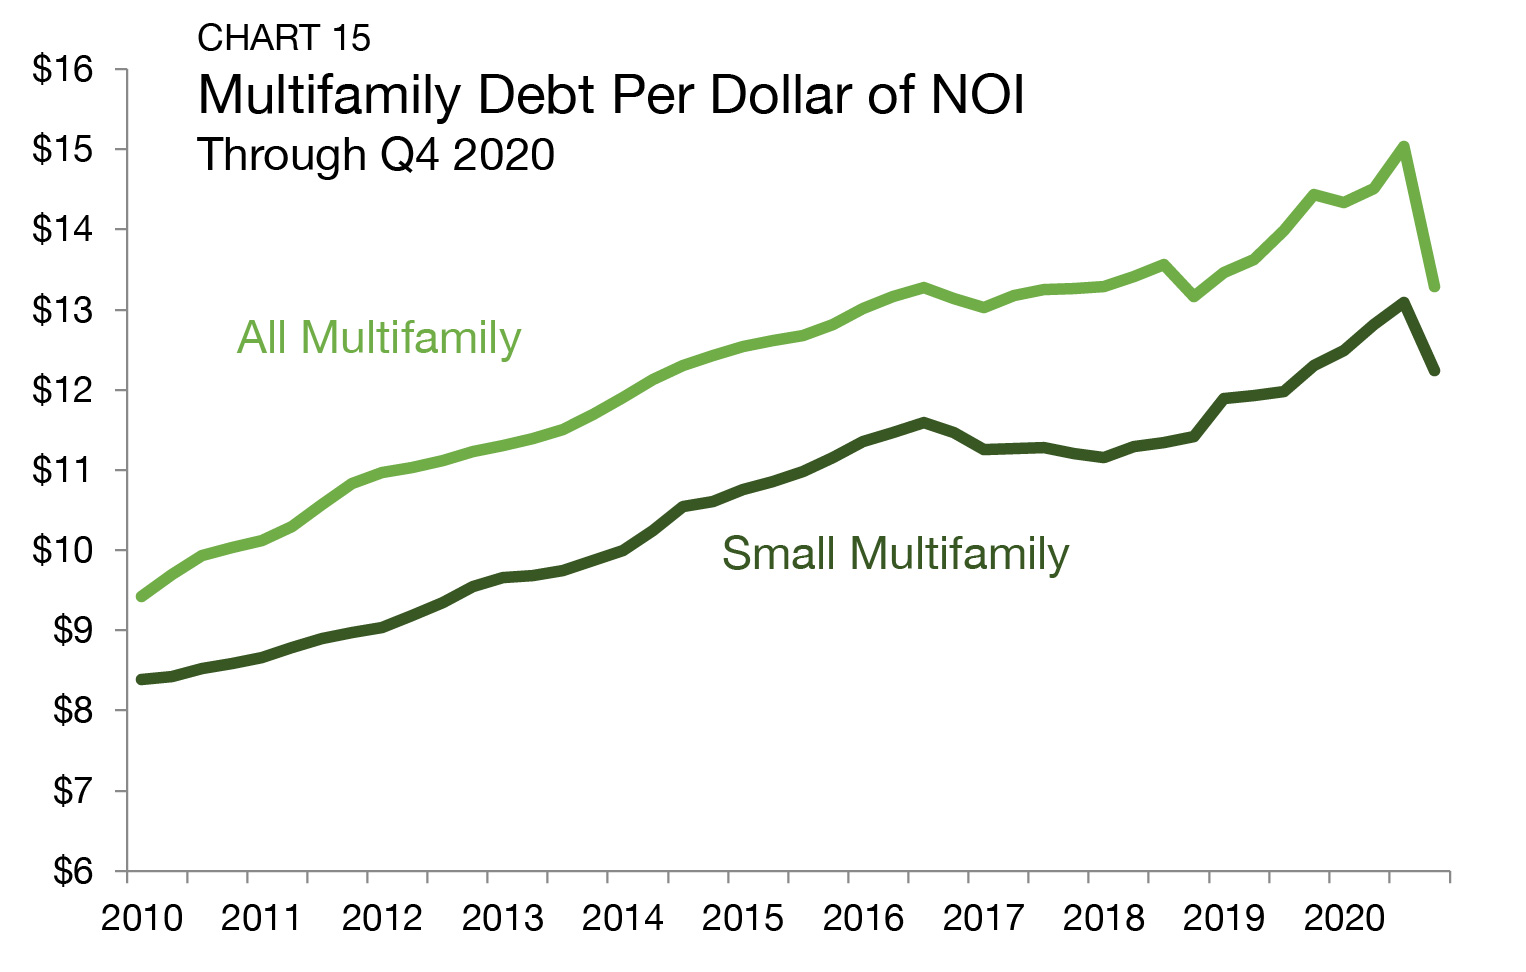
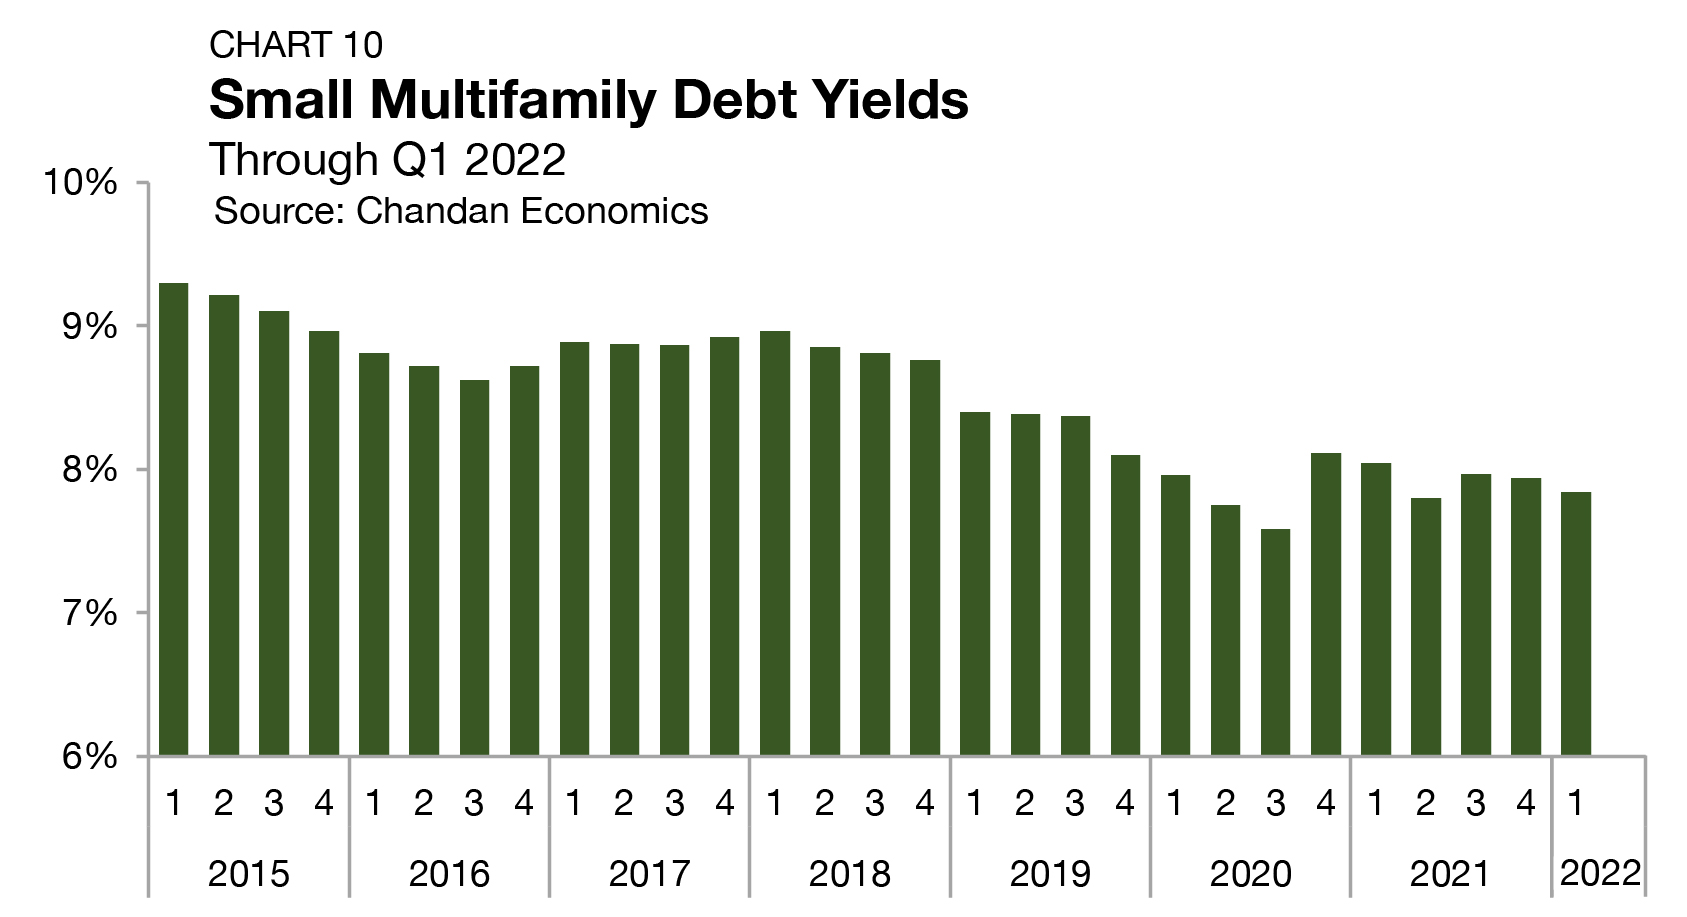
Debt yields for small multifamily loans fell by 10 bps to 7.9% in the first quarter of 2022 — just 26 bps above its all-time low (Chart 10). The inverse of debt yields, the debt per dollar of NOI, rose for small multifamily loans in the first quarter. Small multifamily borrowers secured an average of $12.75 in new debt for every $1 of property NOI, up 15 cents from the previous quarter.
Outlook
For more small multifamily research and insights, visit arbor.com/articles
Disclaimer All content is provided herein “as is” and neither Arbor Realty Trust, Inc. or Chandan Economics, LLC (“the Companies”) nor their affiliated or related entities, nor any person involved in the creation, production and distribution of the content make any warranties, express or implied. The Companies do not make any representations regarding the reliability, usefulness, completeness, accuracy, currency nor represent that use of any information provided herein would not infringe on other third party rights. The Companies shall not be liable for any direct, indirect or consequential damages to the reader or a third party arising from the use of the information contained herein.
1 Data retrieved on April 20th, 2022
2 All data, unless otherwise stated, are based on Chandan Economics’ analysis of a limited pool of loans with original balances of $1 million to $7.5 million and loan-to-value ratios above 50%.
3 The Arbor Small Multifamily Price Index (ASMPI) uses model estimates of small multifamily rents and compares them against small multifamily cap rates. The index measures the estimated average price appreciation on small multifamily properties with 5 to 50 units and primary mortgages of $1 million to $7.5 million. For the full methodology, visit arbor.com/asmpi-faq.