Small Multifamily Investment Trends Report Q4 2024
Pricing, Cap Rates, and Credit Conditions Show Improvement
Key Findings
- Small multifamily valuations stabilized in the third quarter of 2024.
- Cap rates moved off post-pandemic high point and declined slightly from the previous quarter’s mark.
- Credit conditions loosened as the Federal Reserve initiated its first interest rate cut in four years.
State of the Market
The normalization of the small multifamily market continued to advance in the third quarter as the Federal Reserve began its long-awaited cycle of interest rate reductions. With pricing measures, cap rates, and credit conditions all improving, investment activity is poised to rise. A favorable combination of easing interest rate pressure, robust rental demand, and stable, government-sponsored lending support continues to strengthen the fundamental health of the small multifamily subsector.
Throughout the multifamily real estate industry, optimism is building. The National Multifamily Housing Council’s (NMHC) Quarterly Survey of Apartment Conditions recently indicated that multifamily practitioners observed higher sales volumes and improved debt and equity financing conditions in the third quarter. According to the CRE Finance Council’s third quarter Sentiment Index Survey, 81% of commercial real estate/multifamily professionals expect transaction volume to improve over the next year.
Across its performance fundamentals, small multifamily has demonstrated signs of stability. Deleveraging trends have started reversing, and ascendant cap rates have lost steam. While elevated supply conditions may continue to depress sector-wide rent growth, the structural need for affordable housing should counterbalance any influx of new units. Looking ahead, markets have forecasted that the Federal Reserve will continue to cut interest rates through next year, adding more momentum to a subsector already on the rise.
Lending Volume
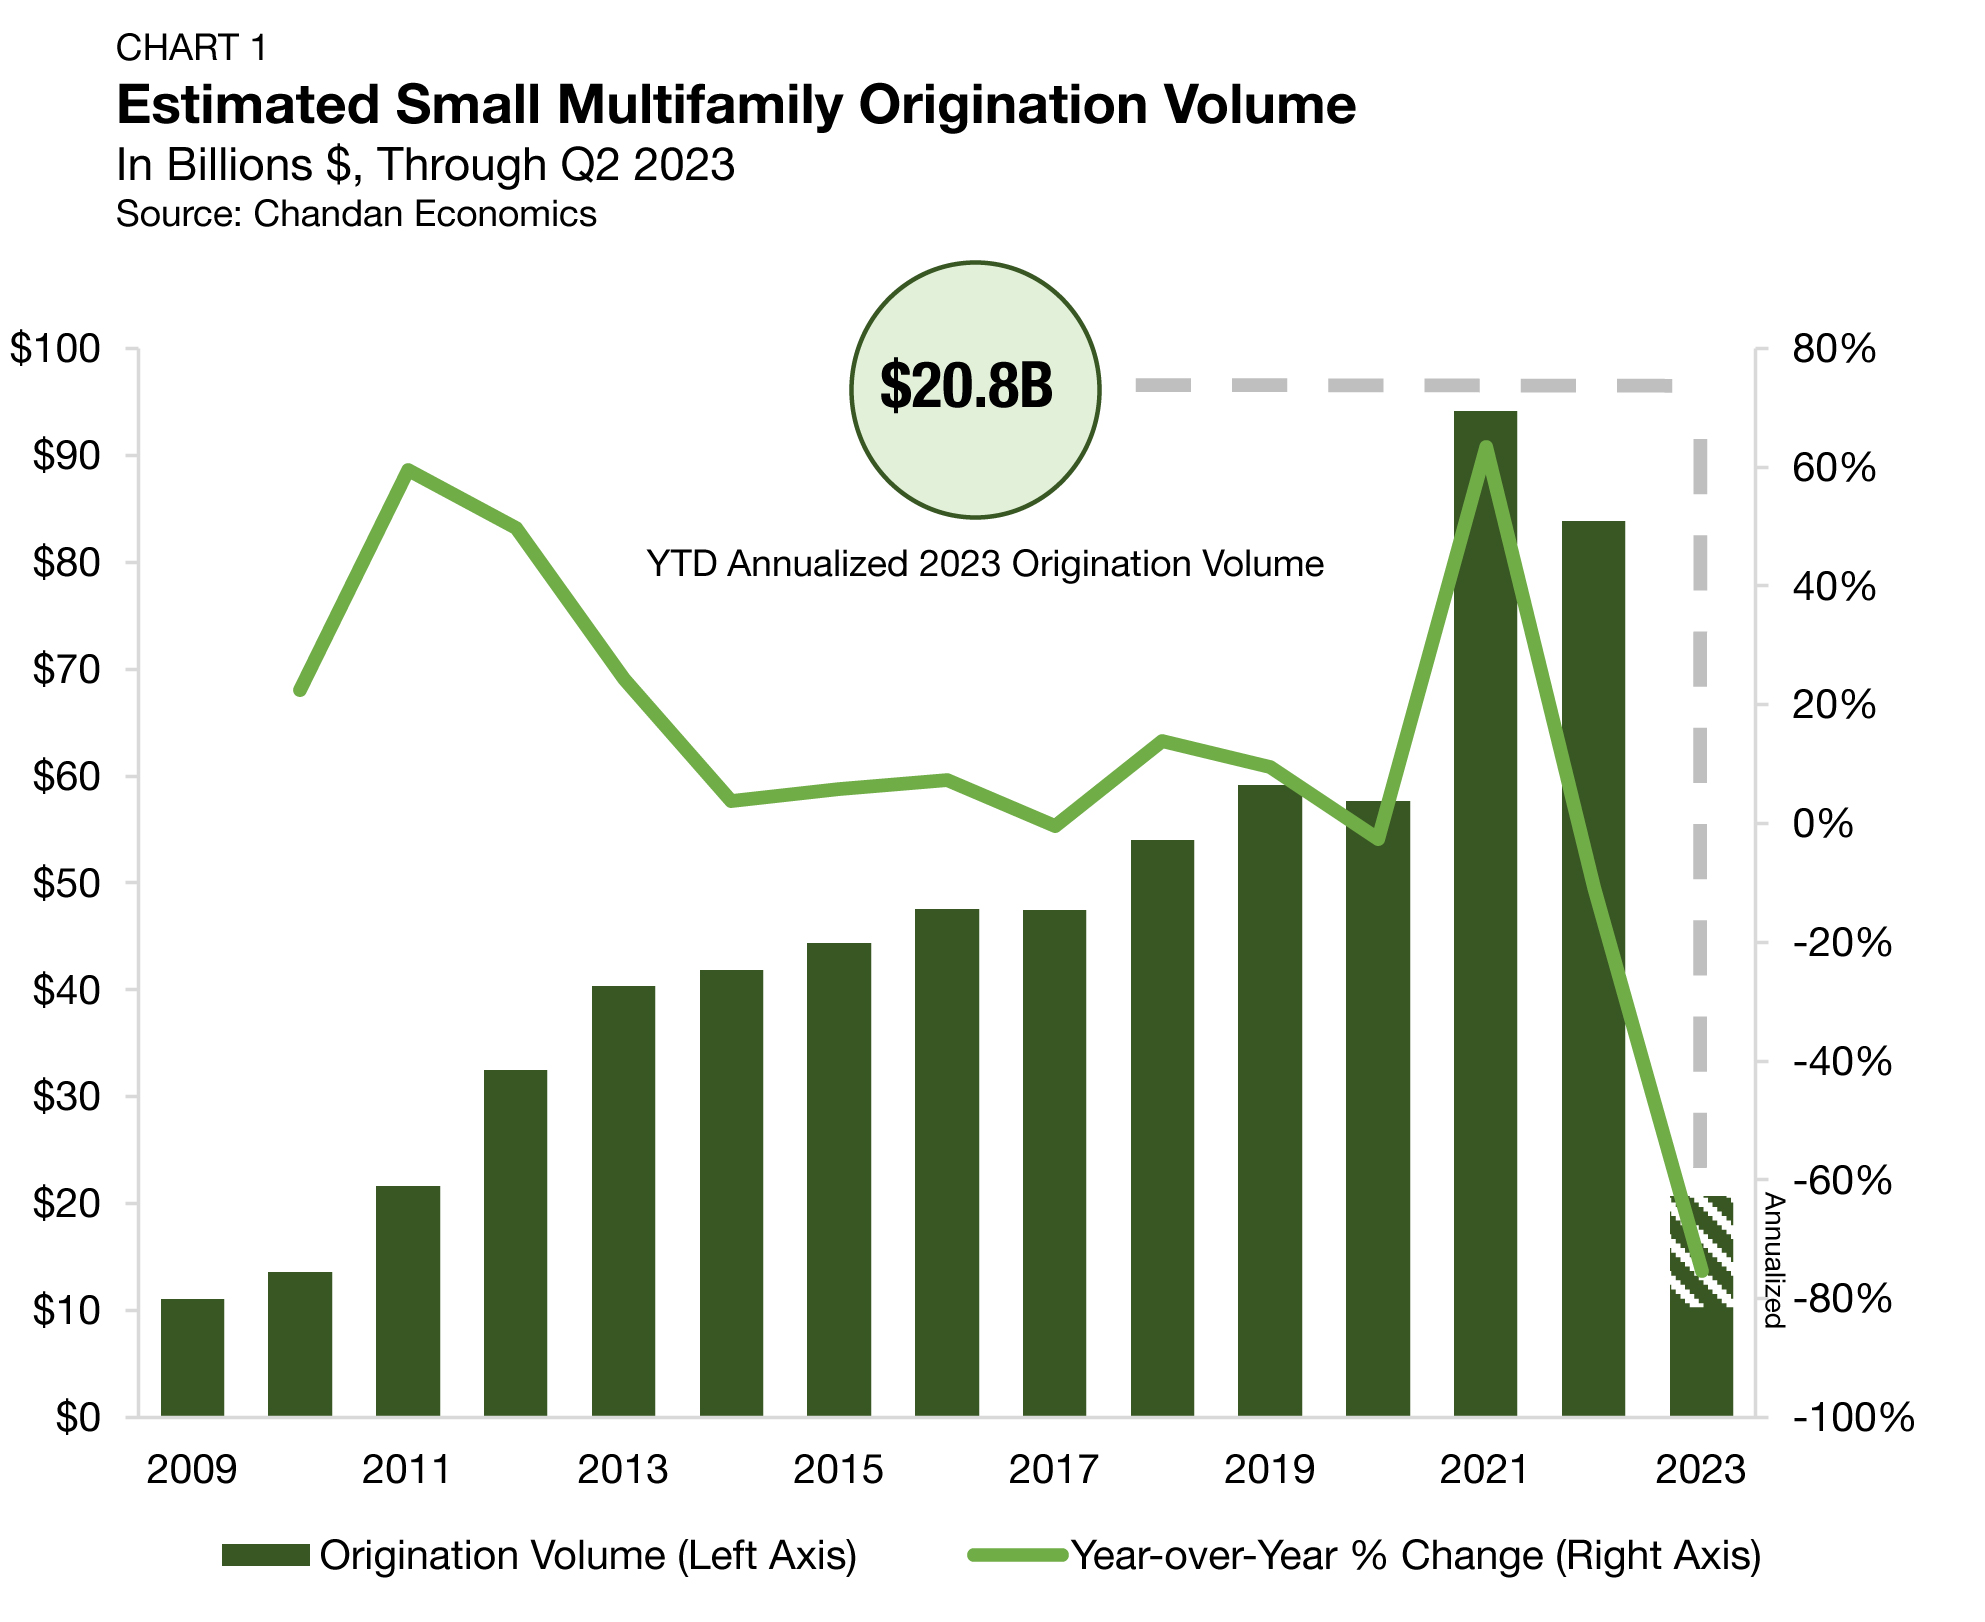
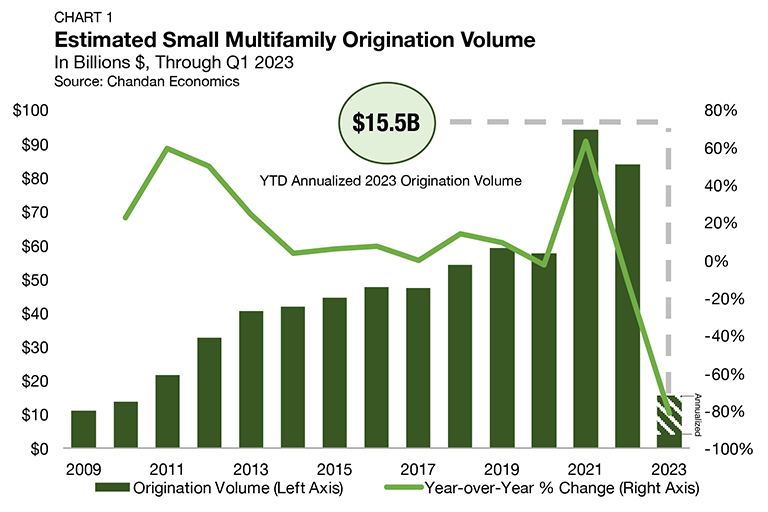
The $44.4 billion year-end 2023 estimate of new multifamily lending volume on loans with original balances between $1 million and $9 million1 (including loans for apartment building sales and refinancing) was down significantly from $90.1 billion in 2022 (Chart 1). Through the end of the third quarter of 2024, originations have stabilized in line with last year’s cadence. Through the third quarter, small multifamily originations are on an annualized pace to reach $46.3 billion in 2024, a modest increase of 4.2% over last year’s volume.
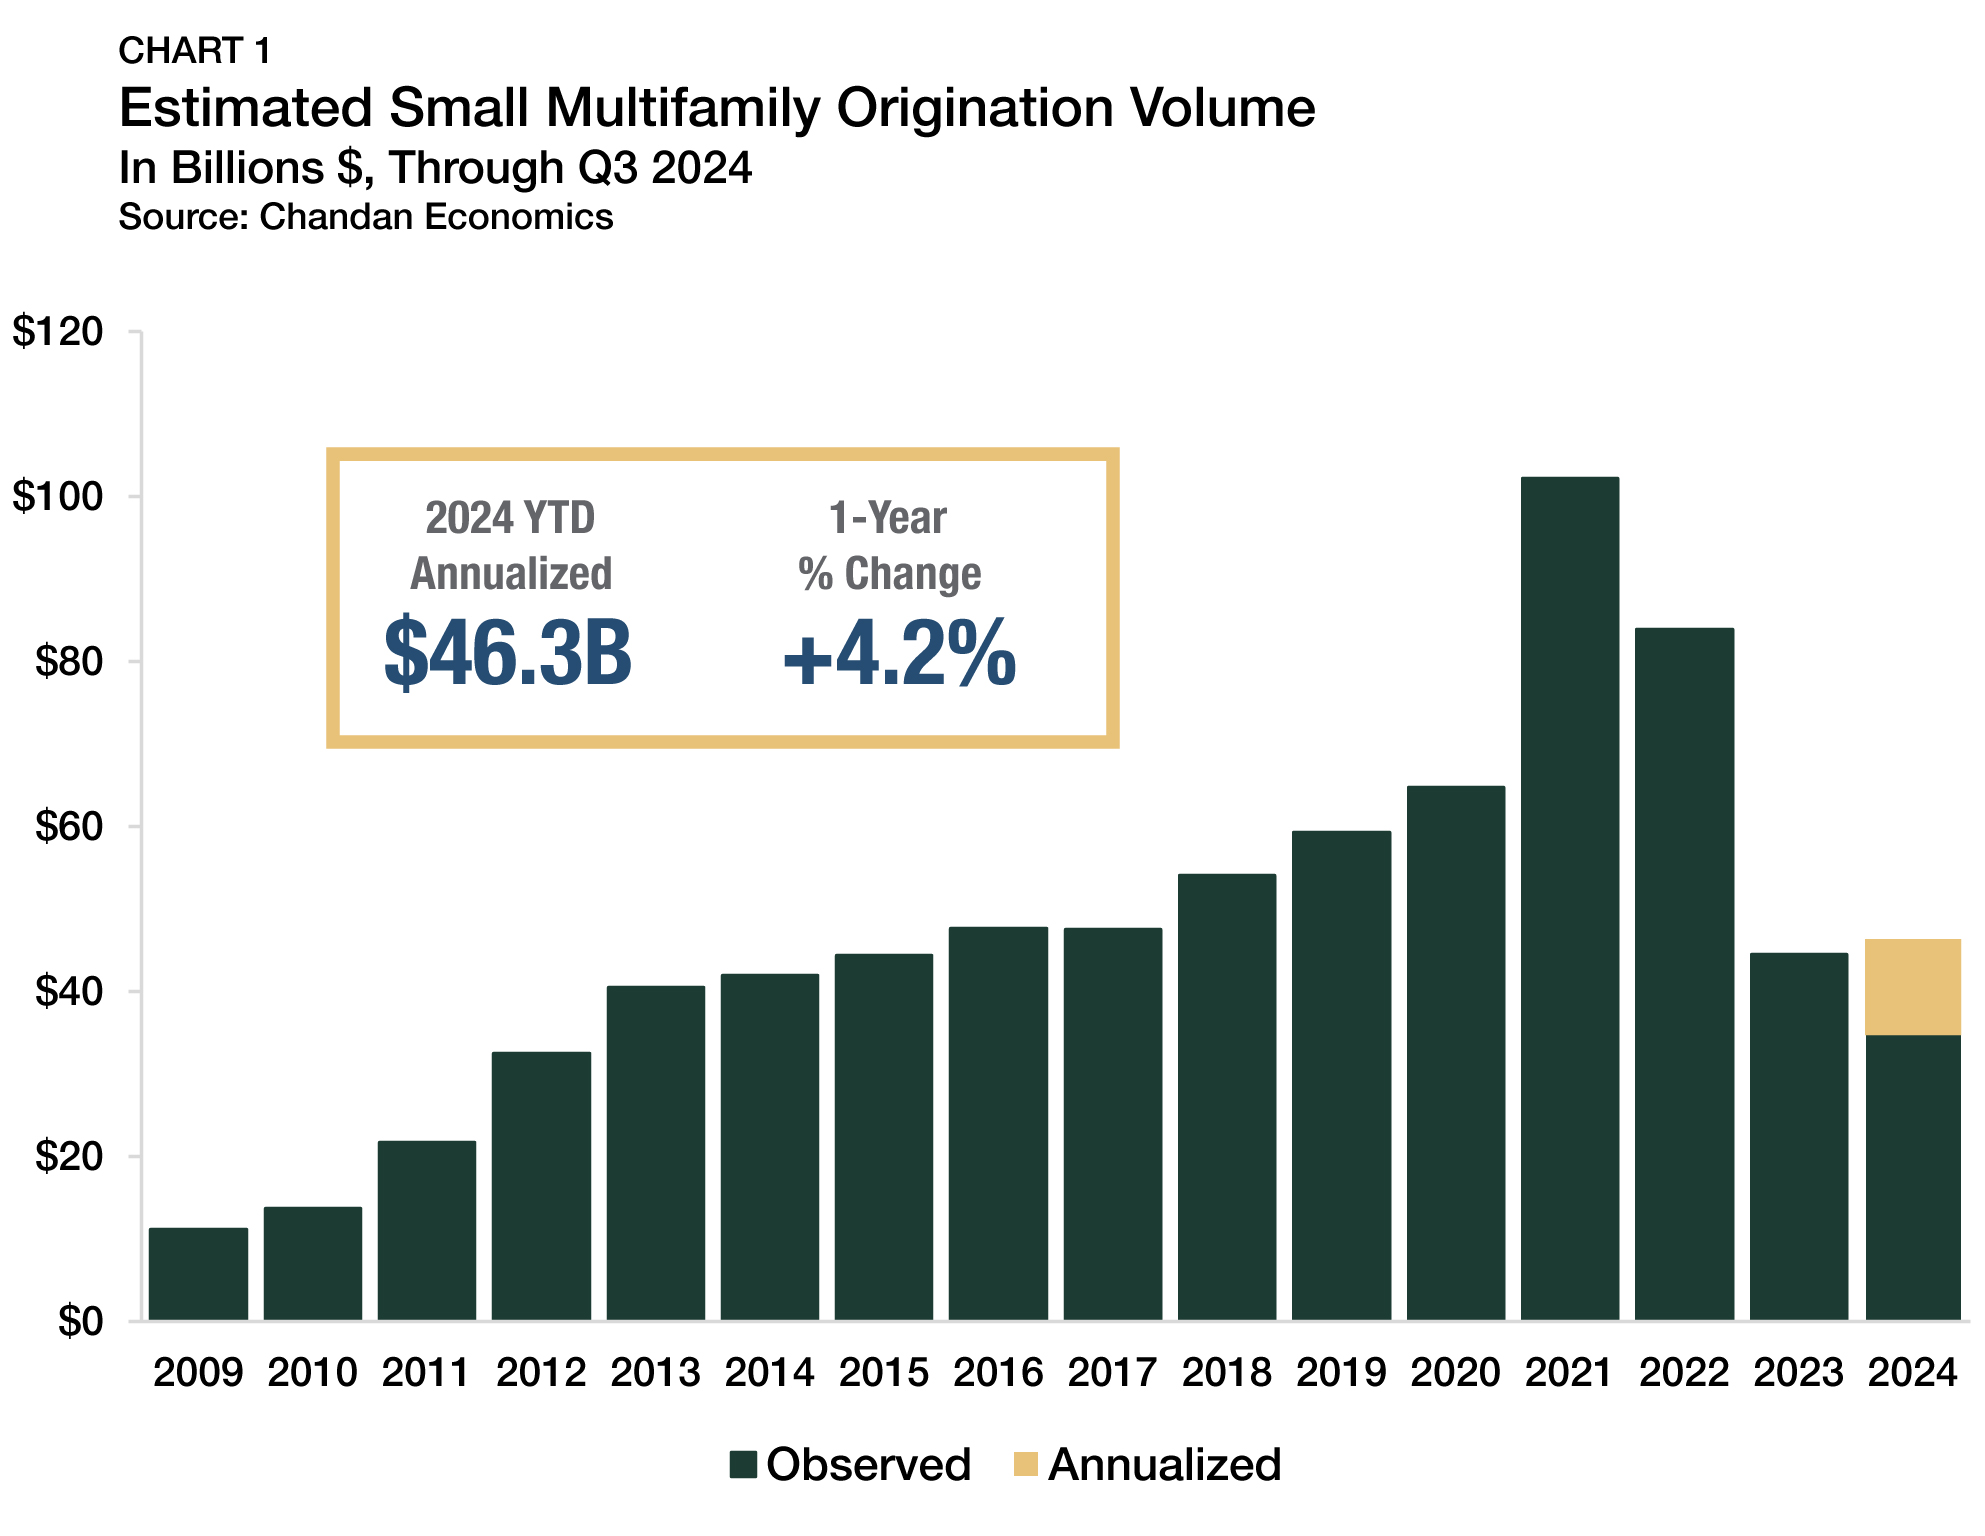
The interest rate environment is the primary factor that has held down origination volumes in 2023 and 2024. Higher financing costs have meant that prospective buyers have required steeper asset price discounts to execute transactions. At the same time, asset owners that have held properties since before 2022 have generally enjoyed low debt servicing costs over the past two years. As a result, buyers and sellers have engaged in a strategy of patience. With the Federal Reserve likely to continue cutting interest rates this year and next, financing costs are becoming more favorable, and originations activity should begin increasing.
1 All data, unless otherwise stated, are based on Chandan Economics’ analysis of a limited pool of loans with original balances of $1 million to $9.0 million and loan-to-value ratios above 50%.
Loans by Purpose
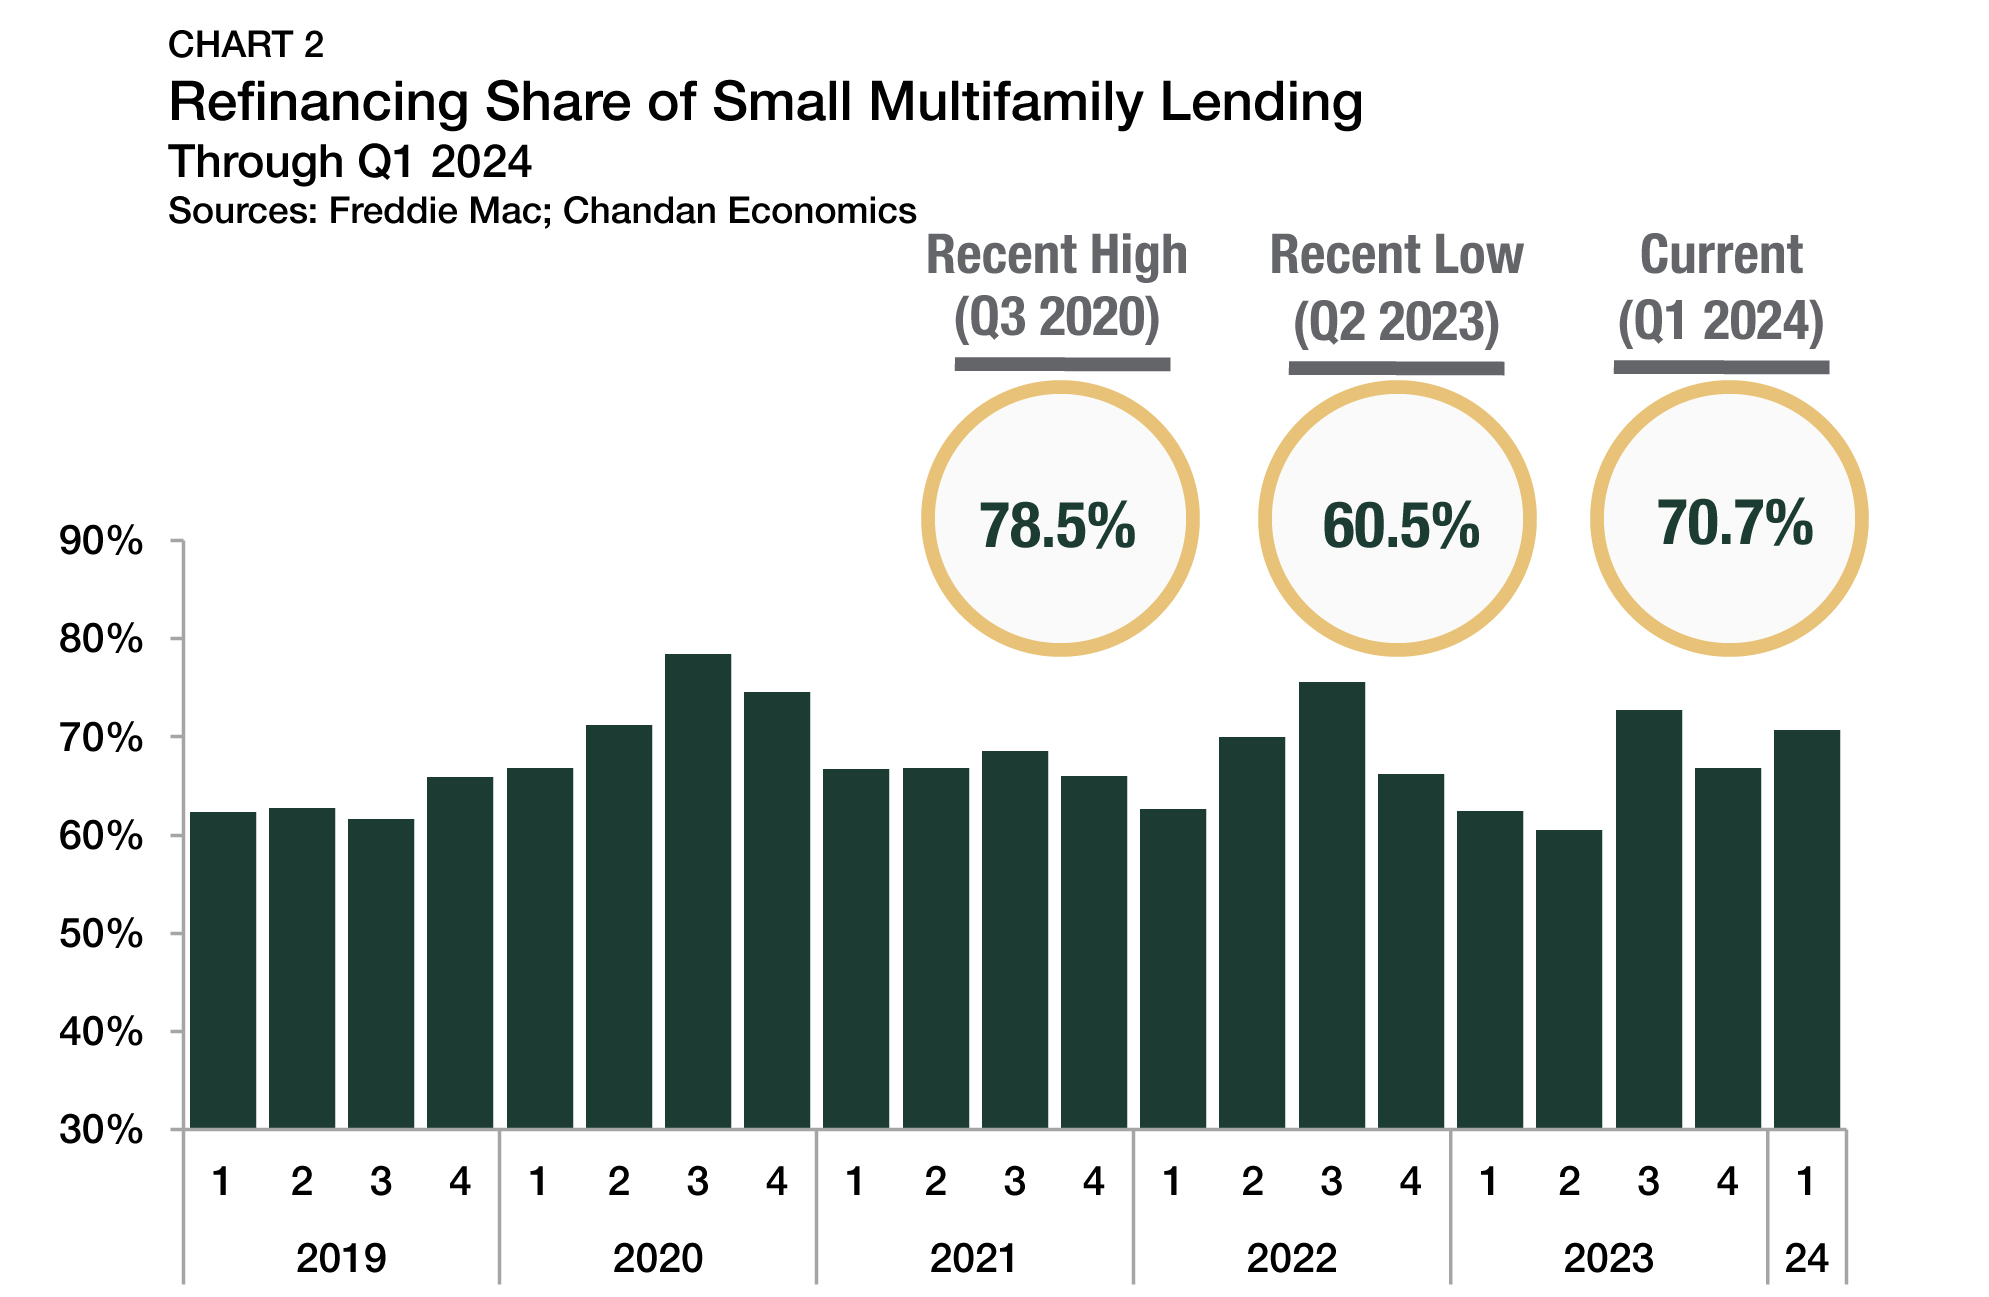
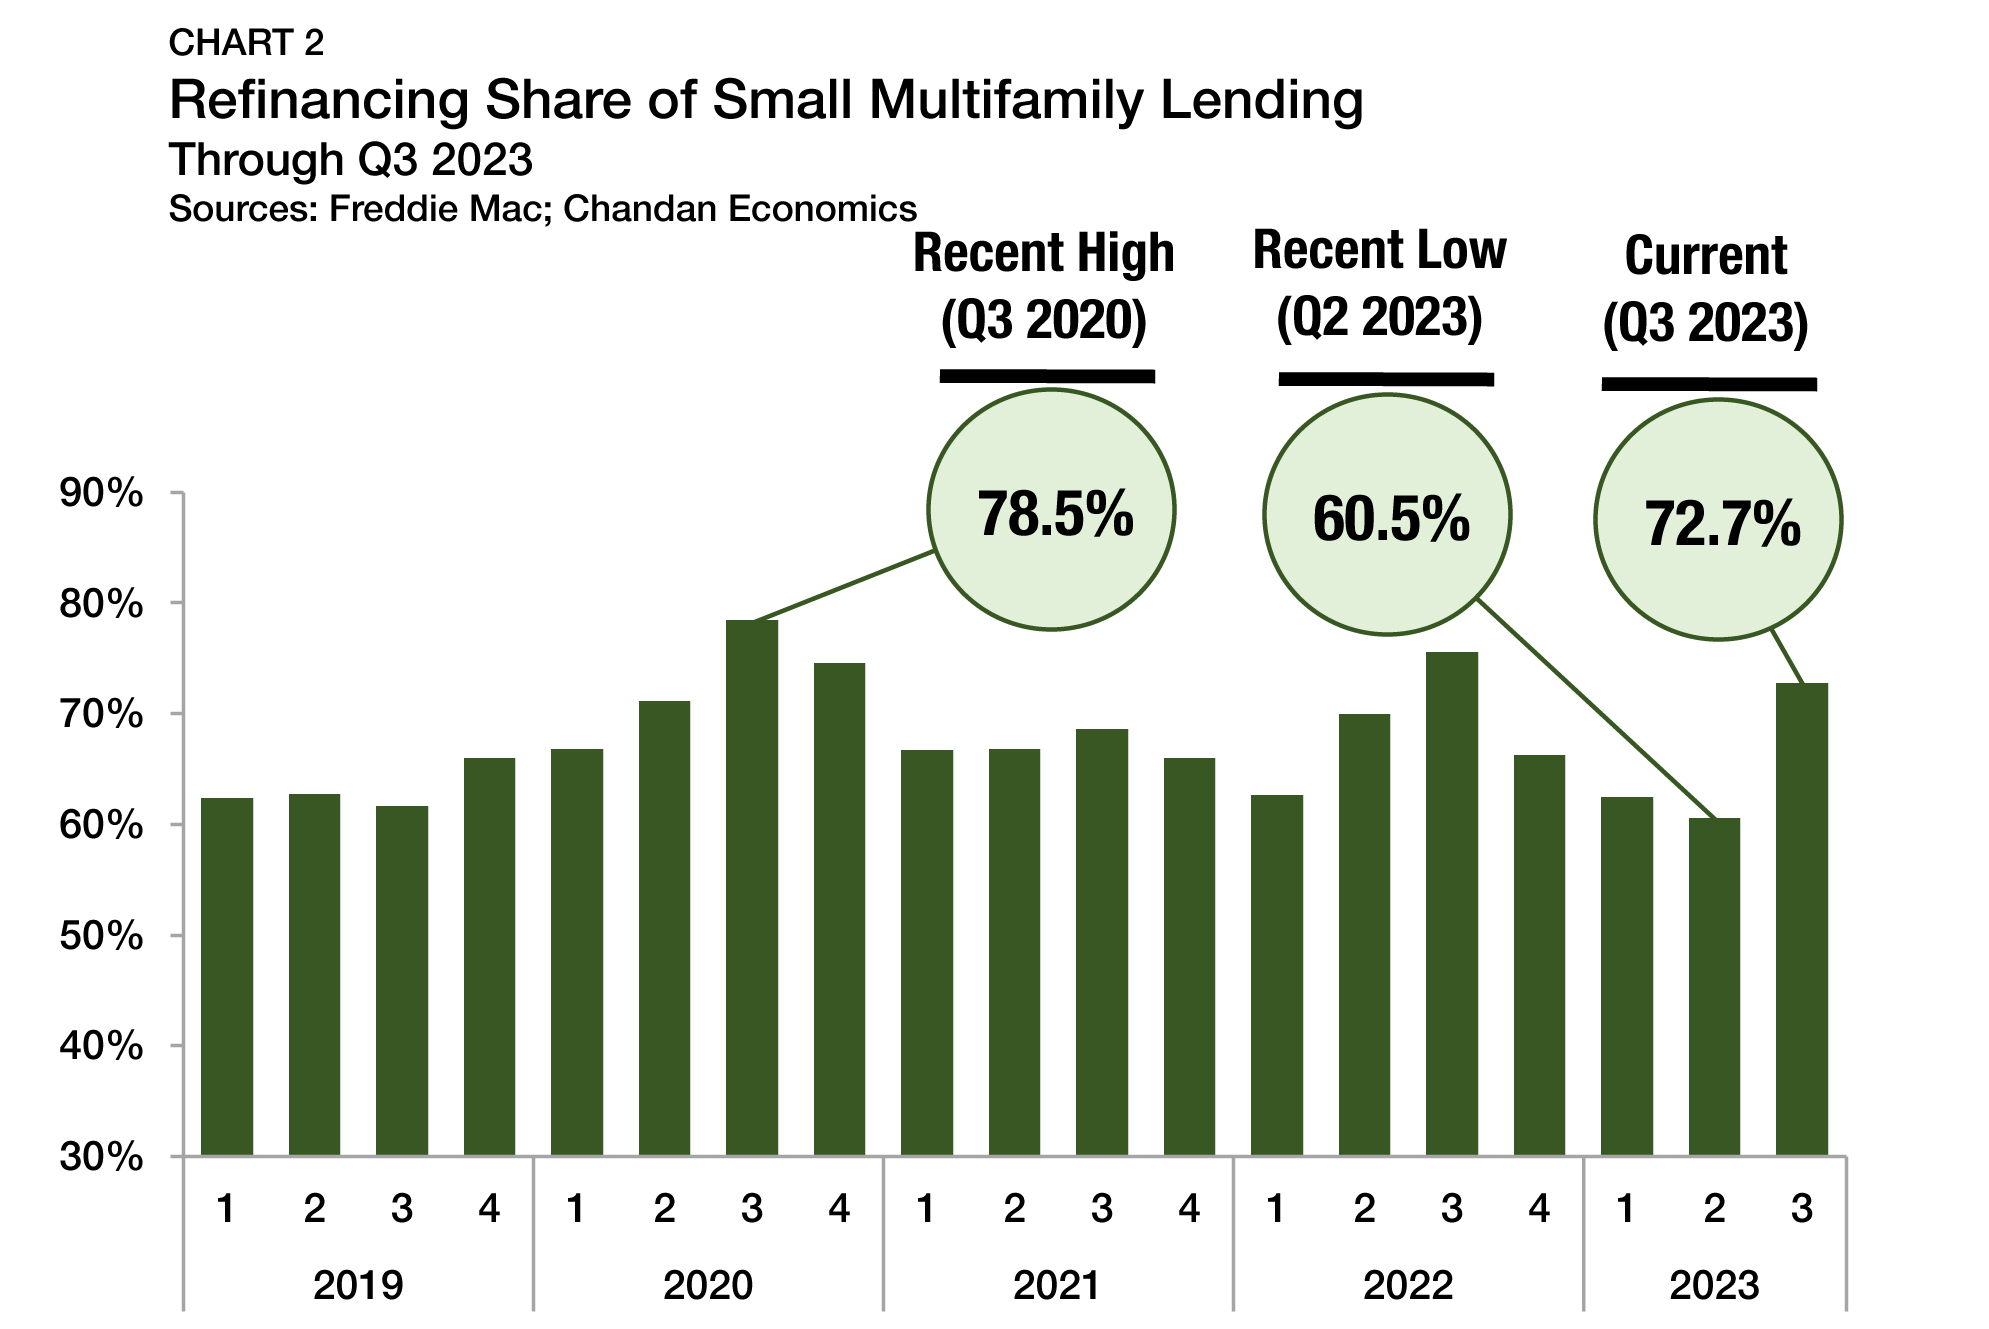
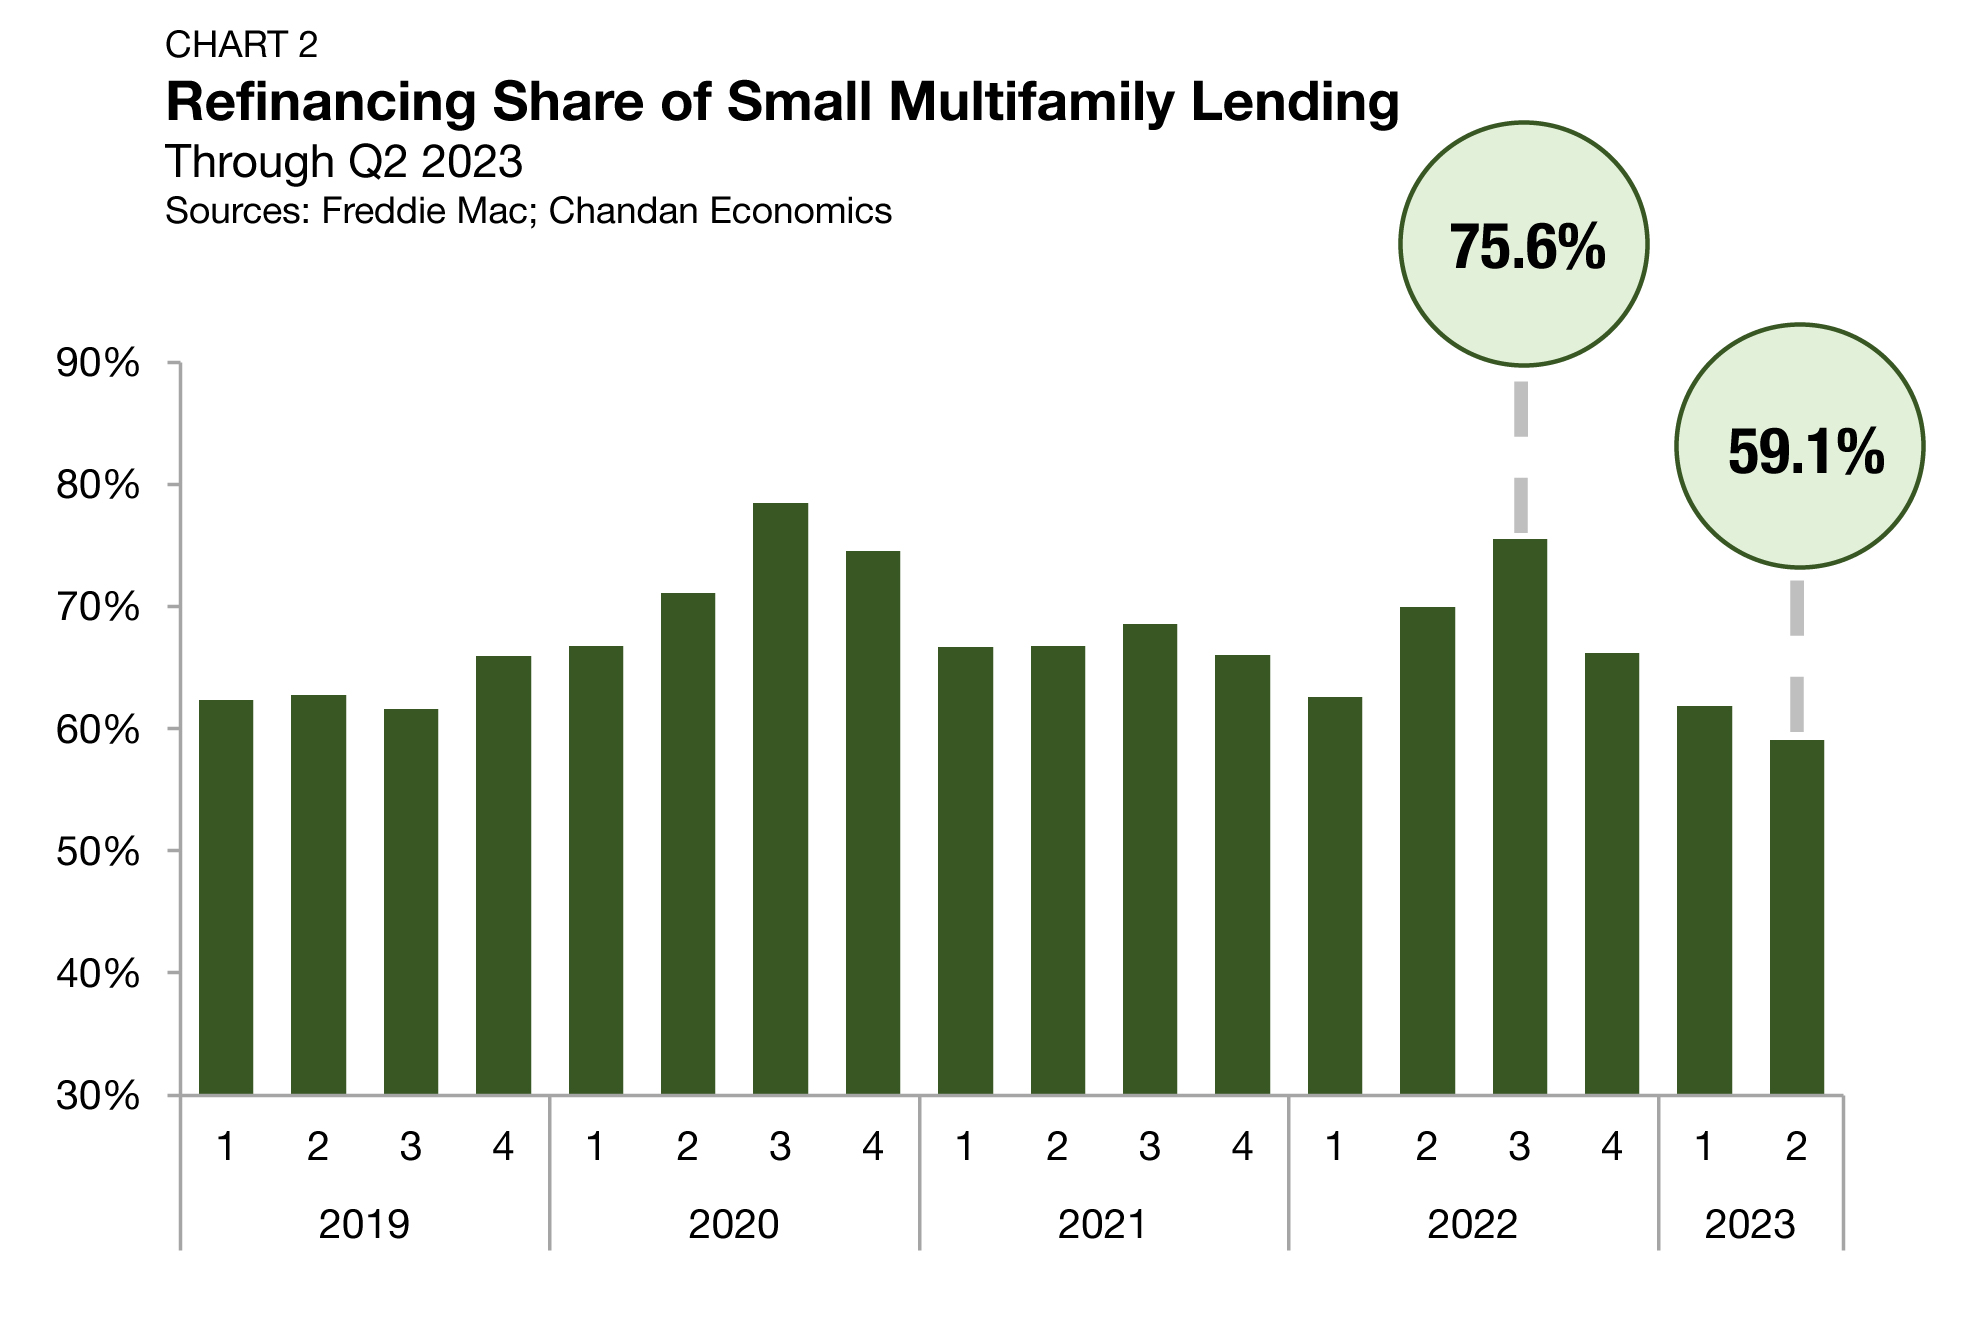
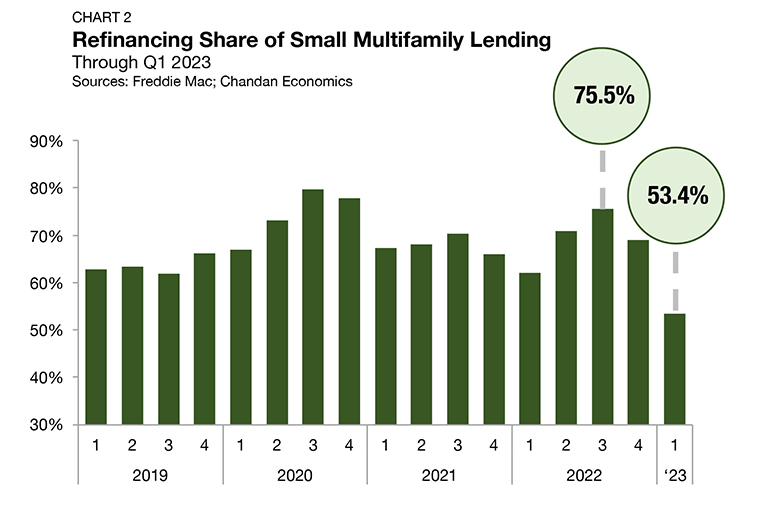
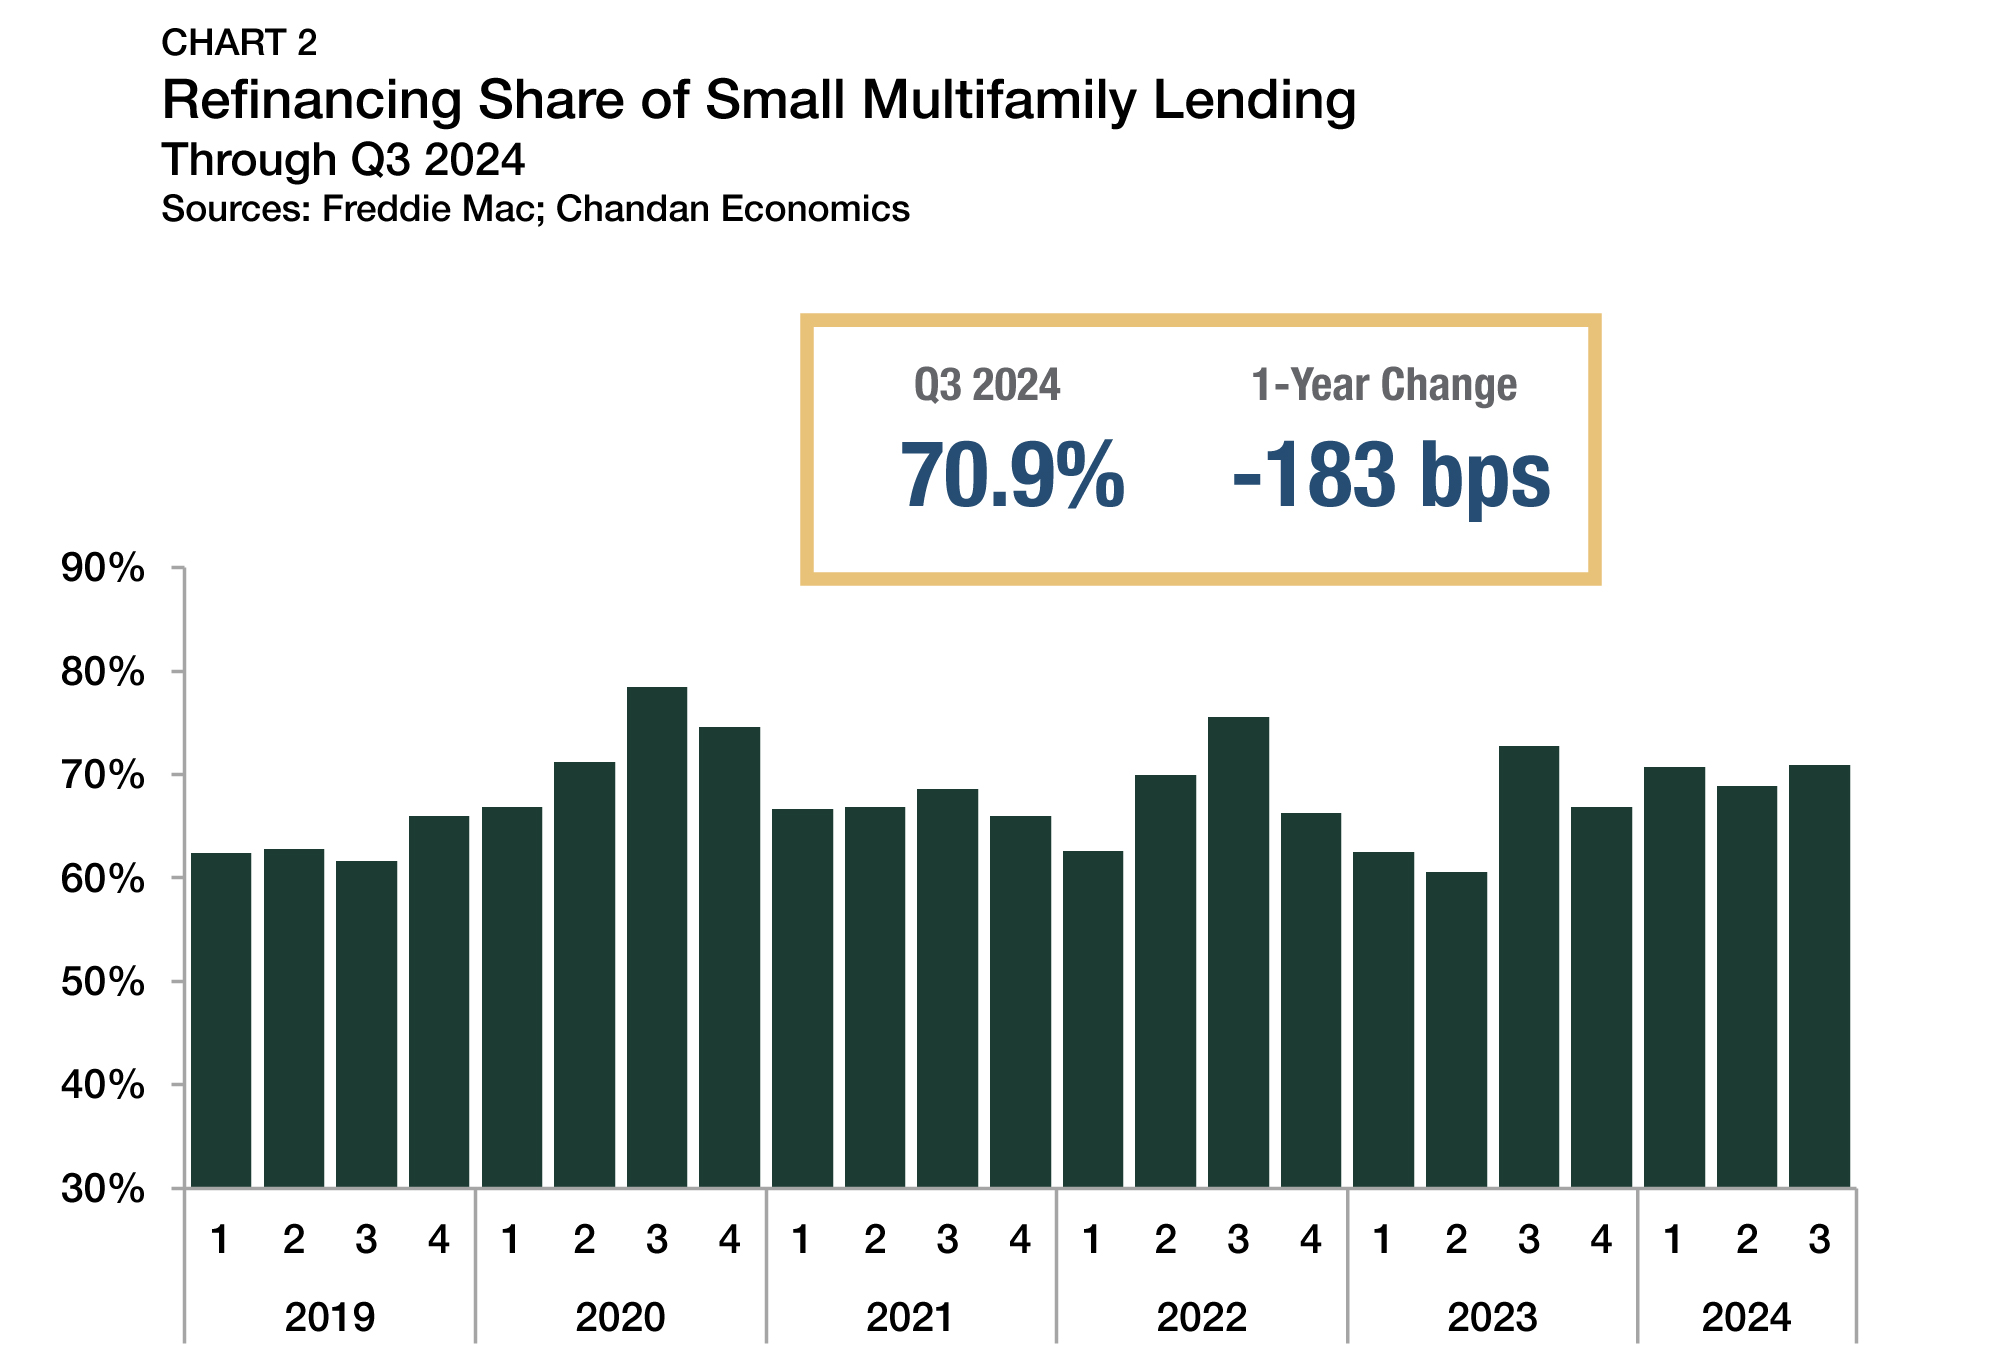
High interest rates reduce the incentive for investors to pursue cash-out refinancings. After hitting a recent high of 75.6% in the third quarter of 2022, the refinancing share of originations fell precipitously to a low of 60.5% in the second quarter of 2023 (Chart 2). However, the refinancing share of originations, which was 70.9% in the third quarter of 2024, has recovered and moderated over the past five quarters, ranging between 66.8% and 72.7%.
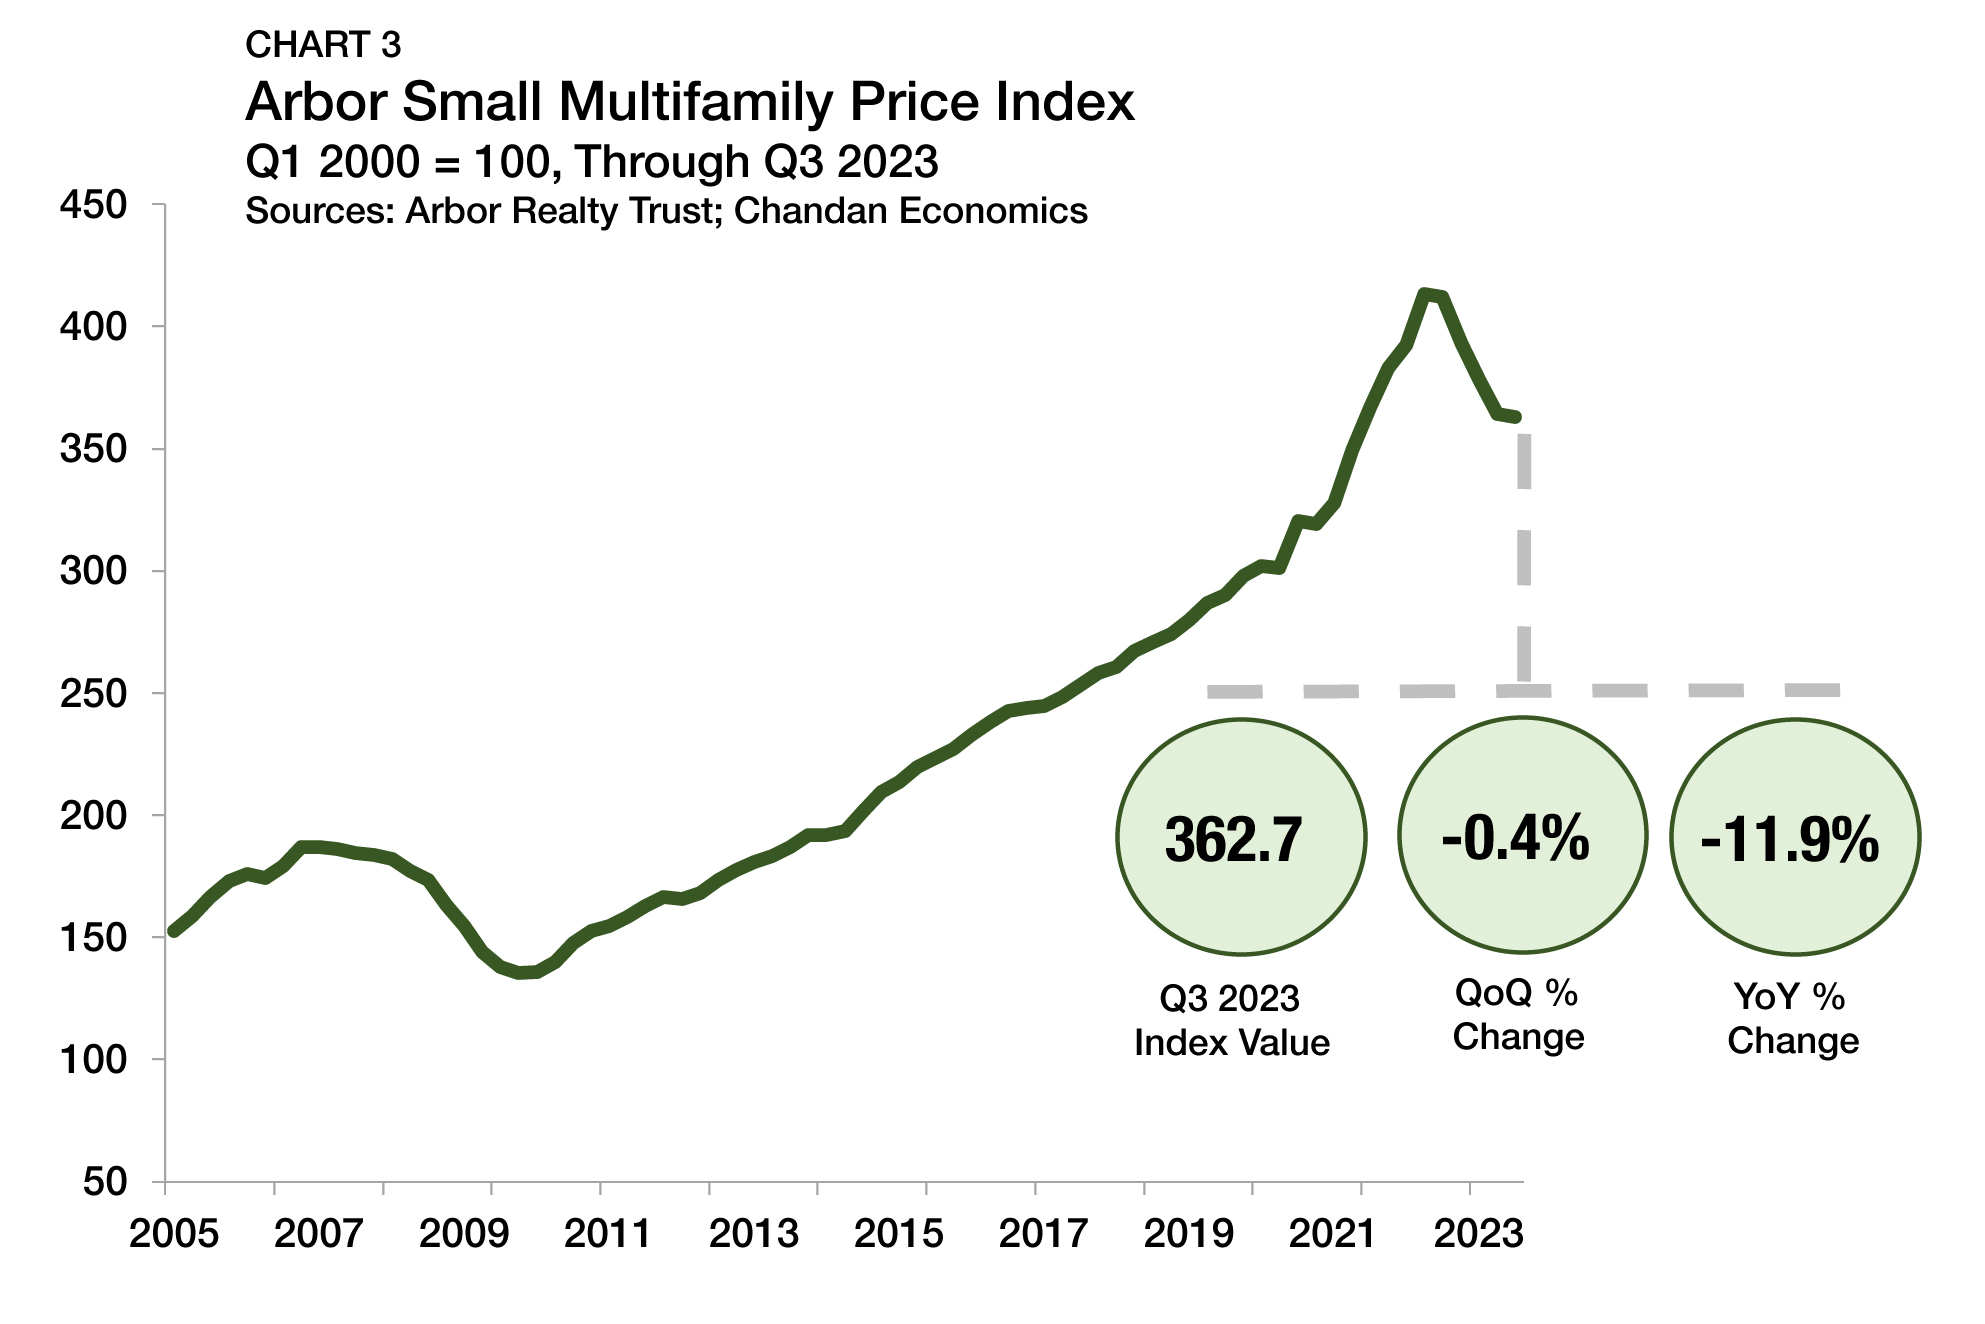
Arbor Small Multifamily Price Index
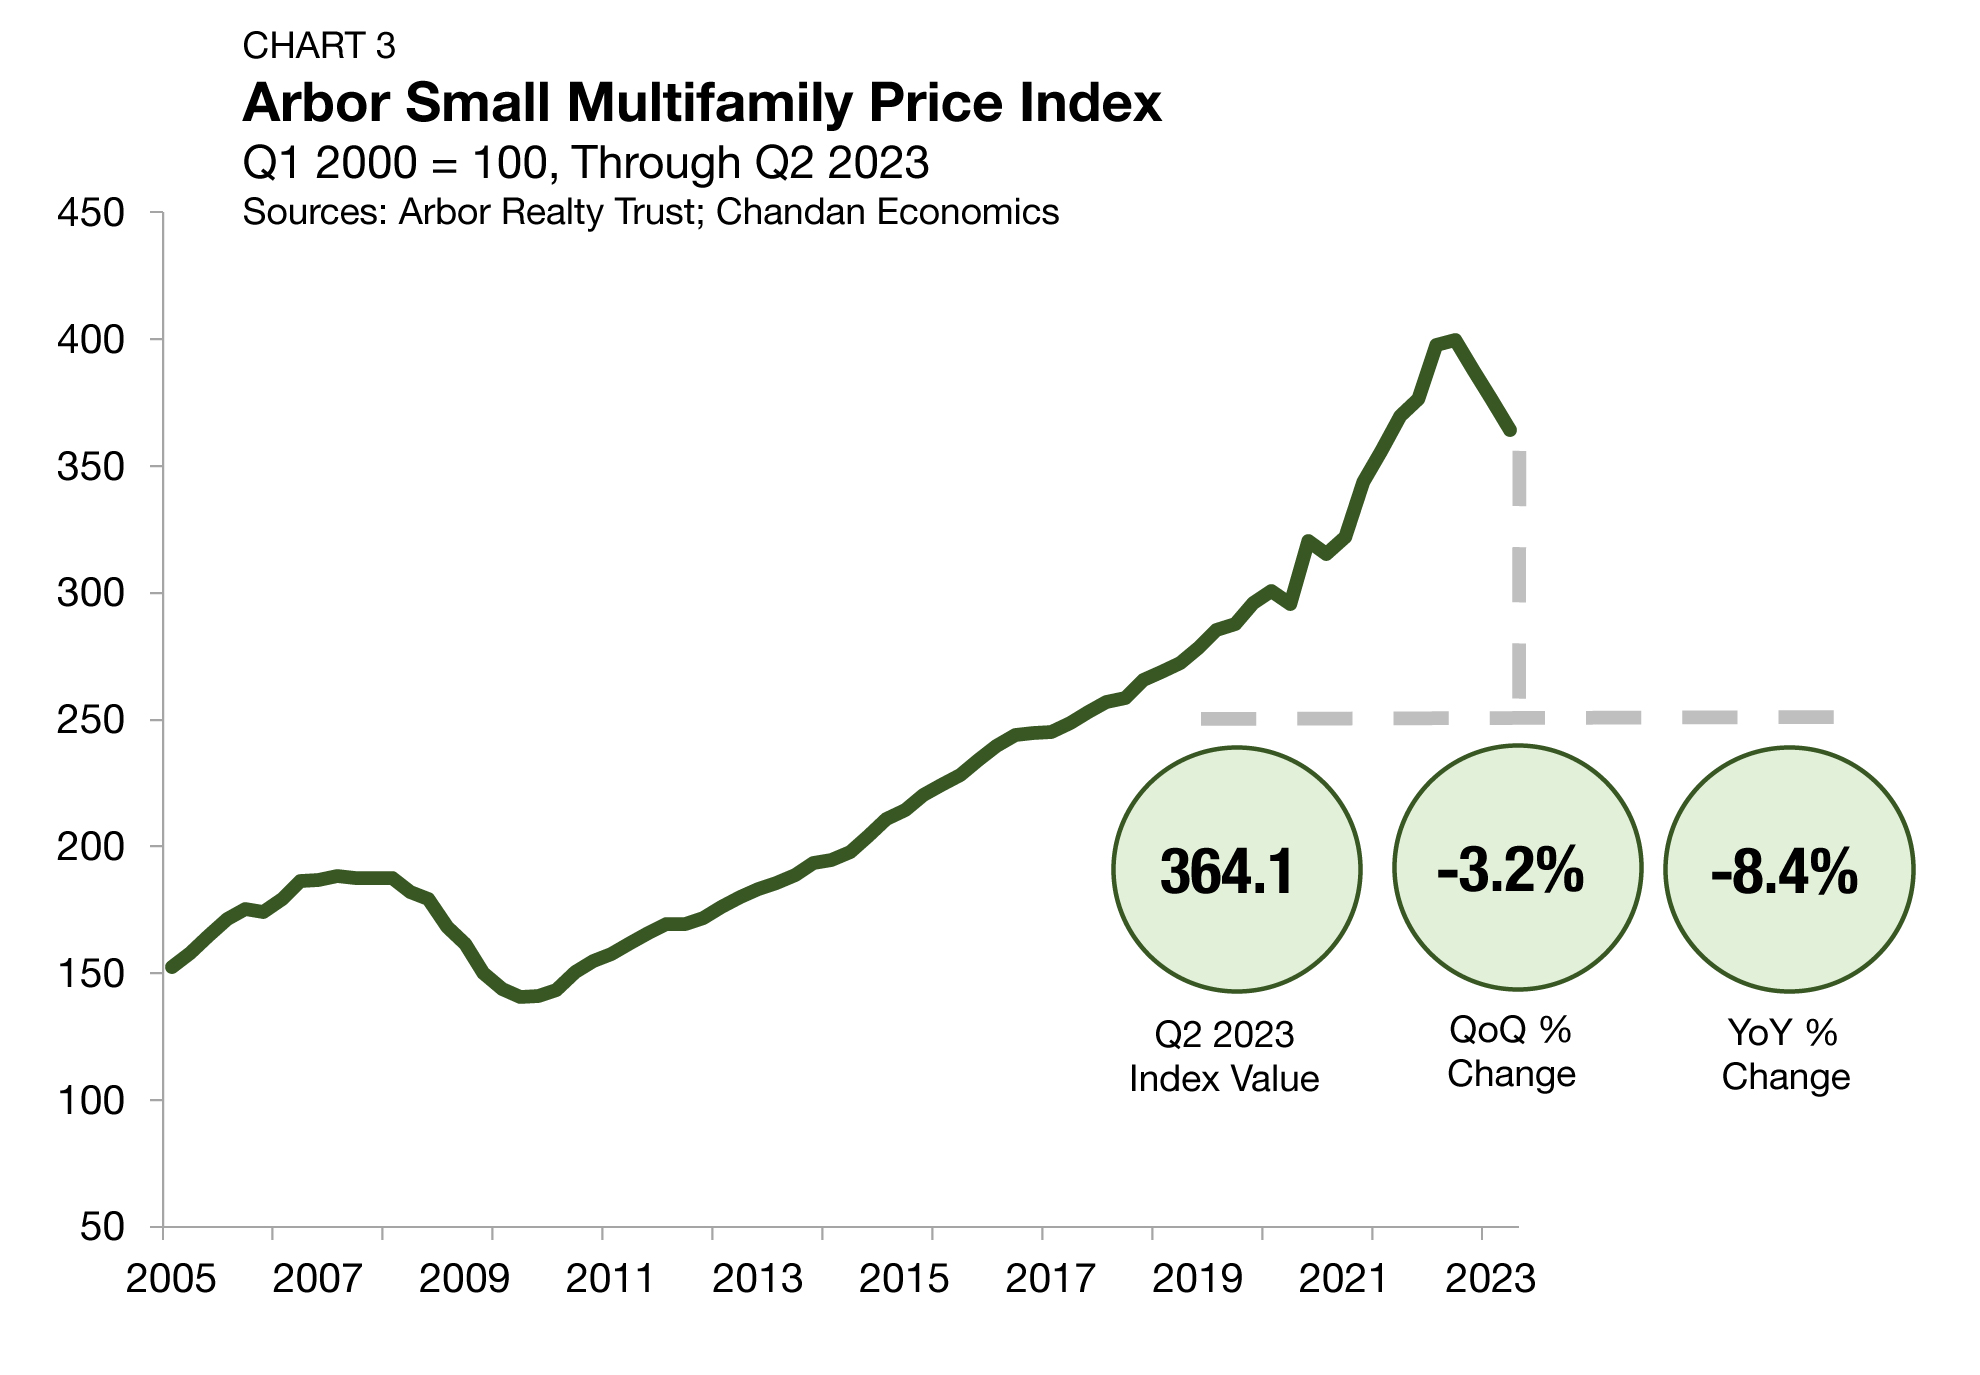
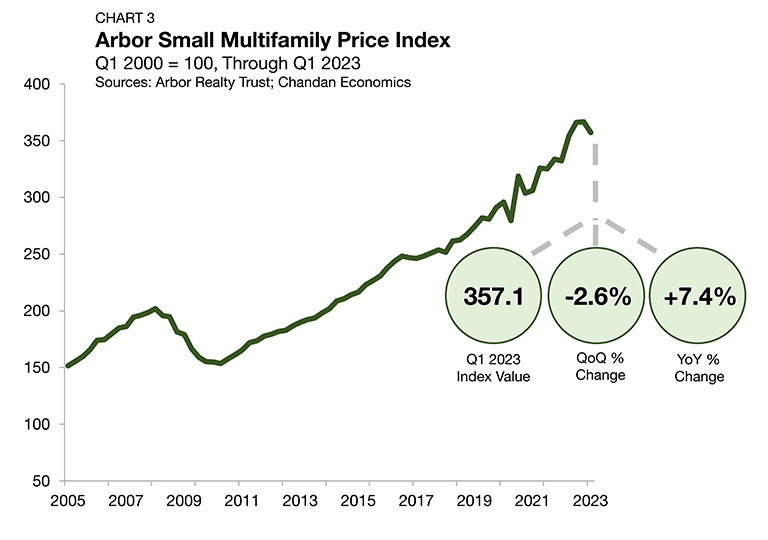
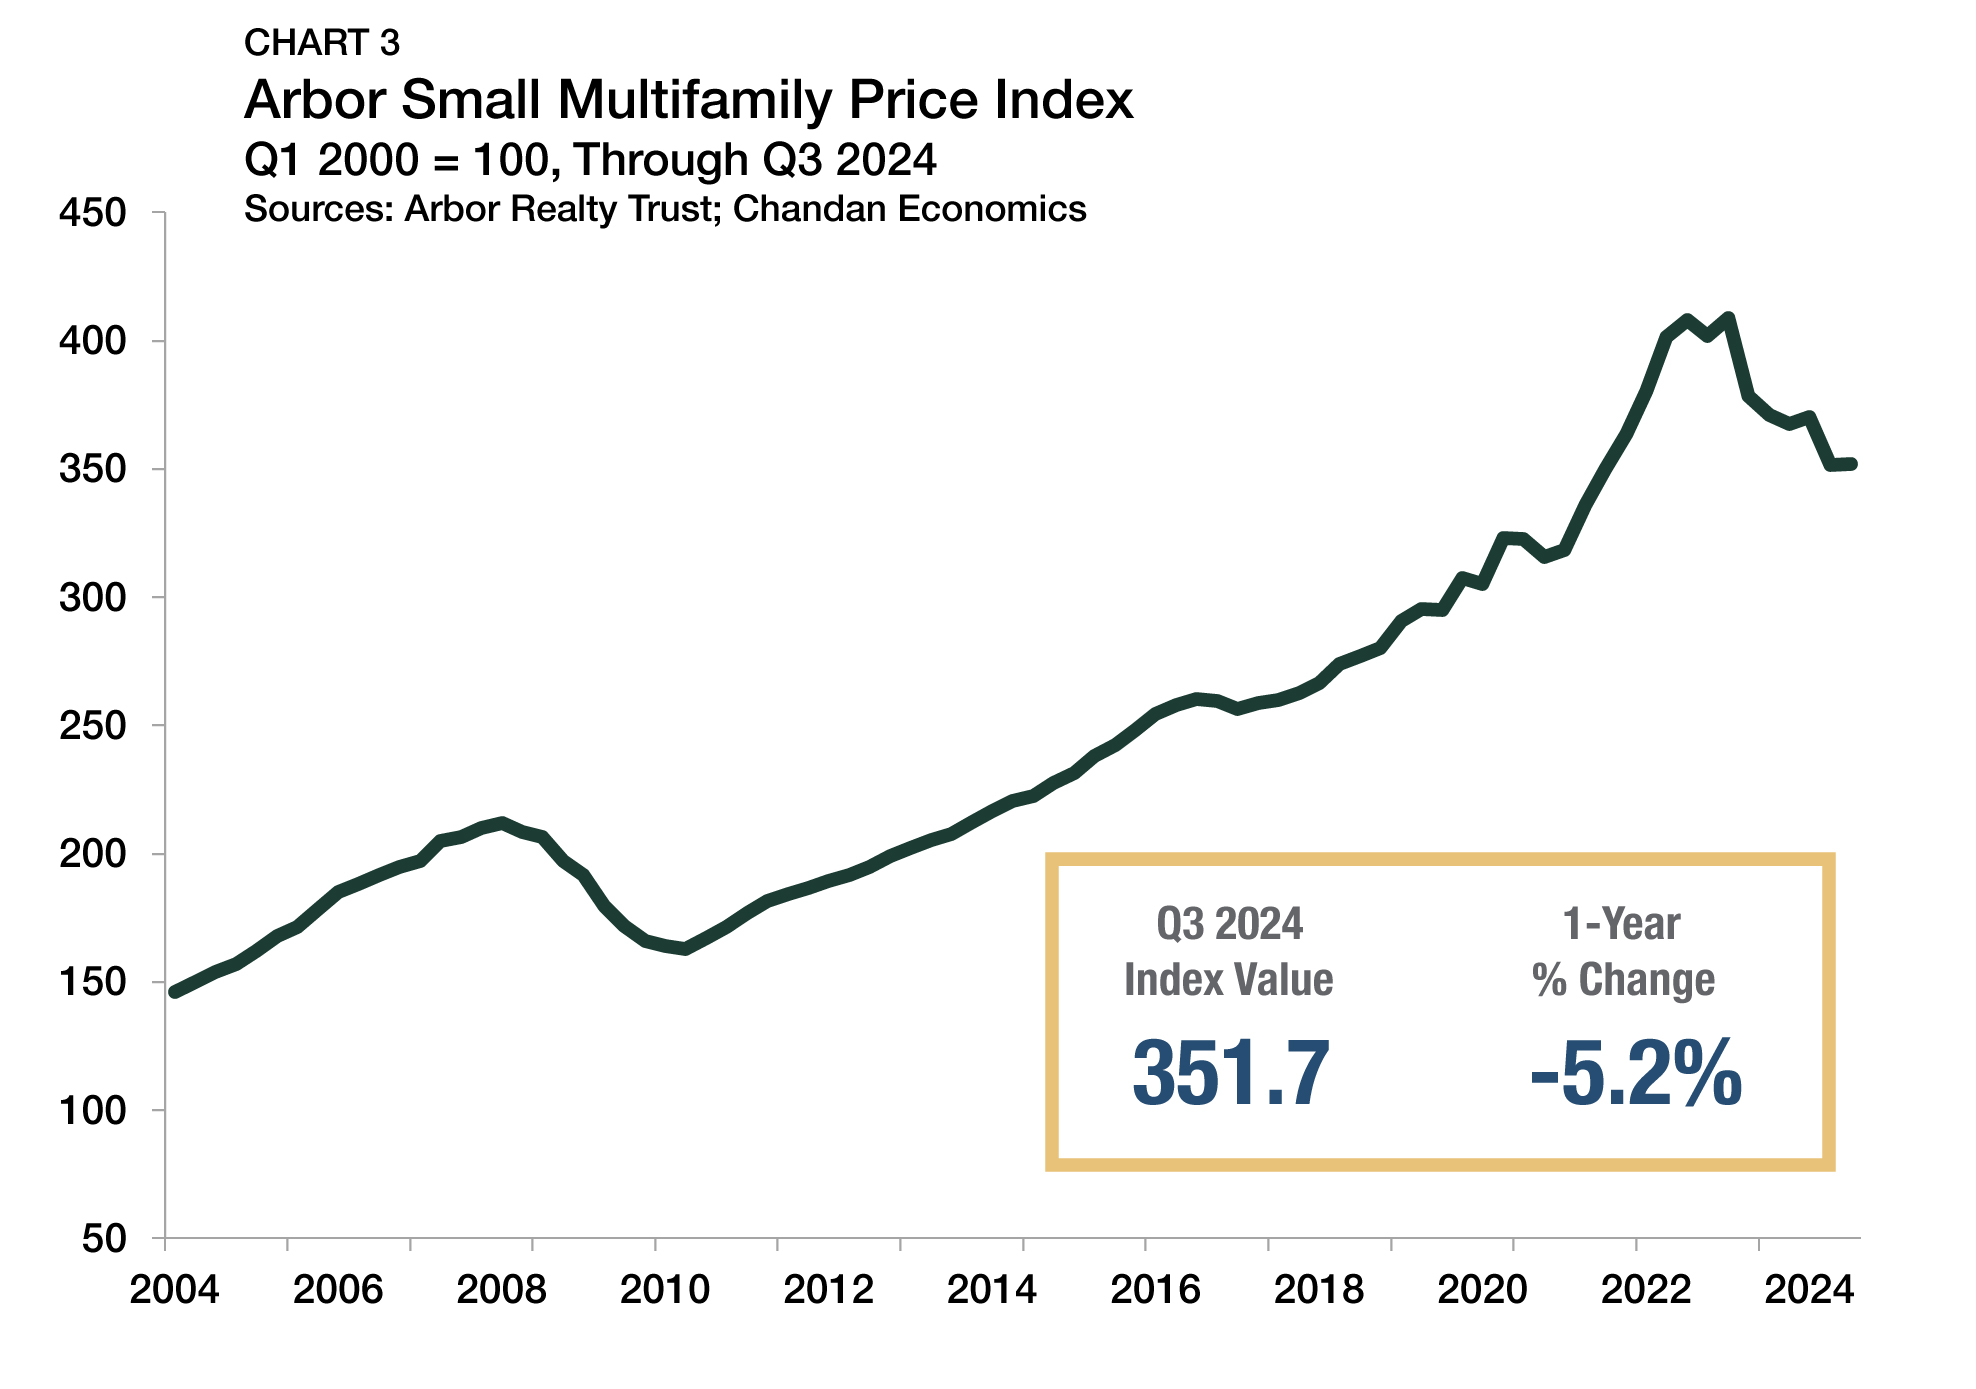
According to the Arbor Small Multifamily Price Index, asset valuations are down 5.2% from a year earlier through the third quarter of 2024 (Chart 3), although valuations improved by a marginal 0.1% compared to the previous quarter. Property-level revenues saw healthy levels of growth in the third quarter, coinciding with resilient rent growth, declining cap rates, and improving occupancy rates — all of which supported valuations. However, average operating expenses also moved higher, muting some gains.
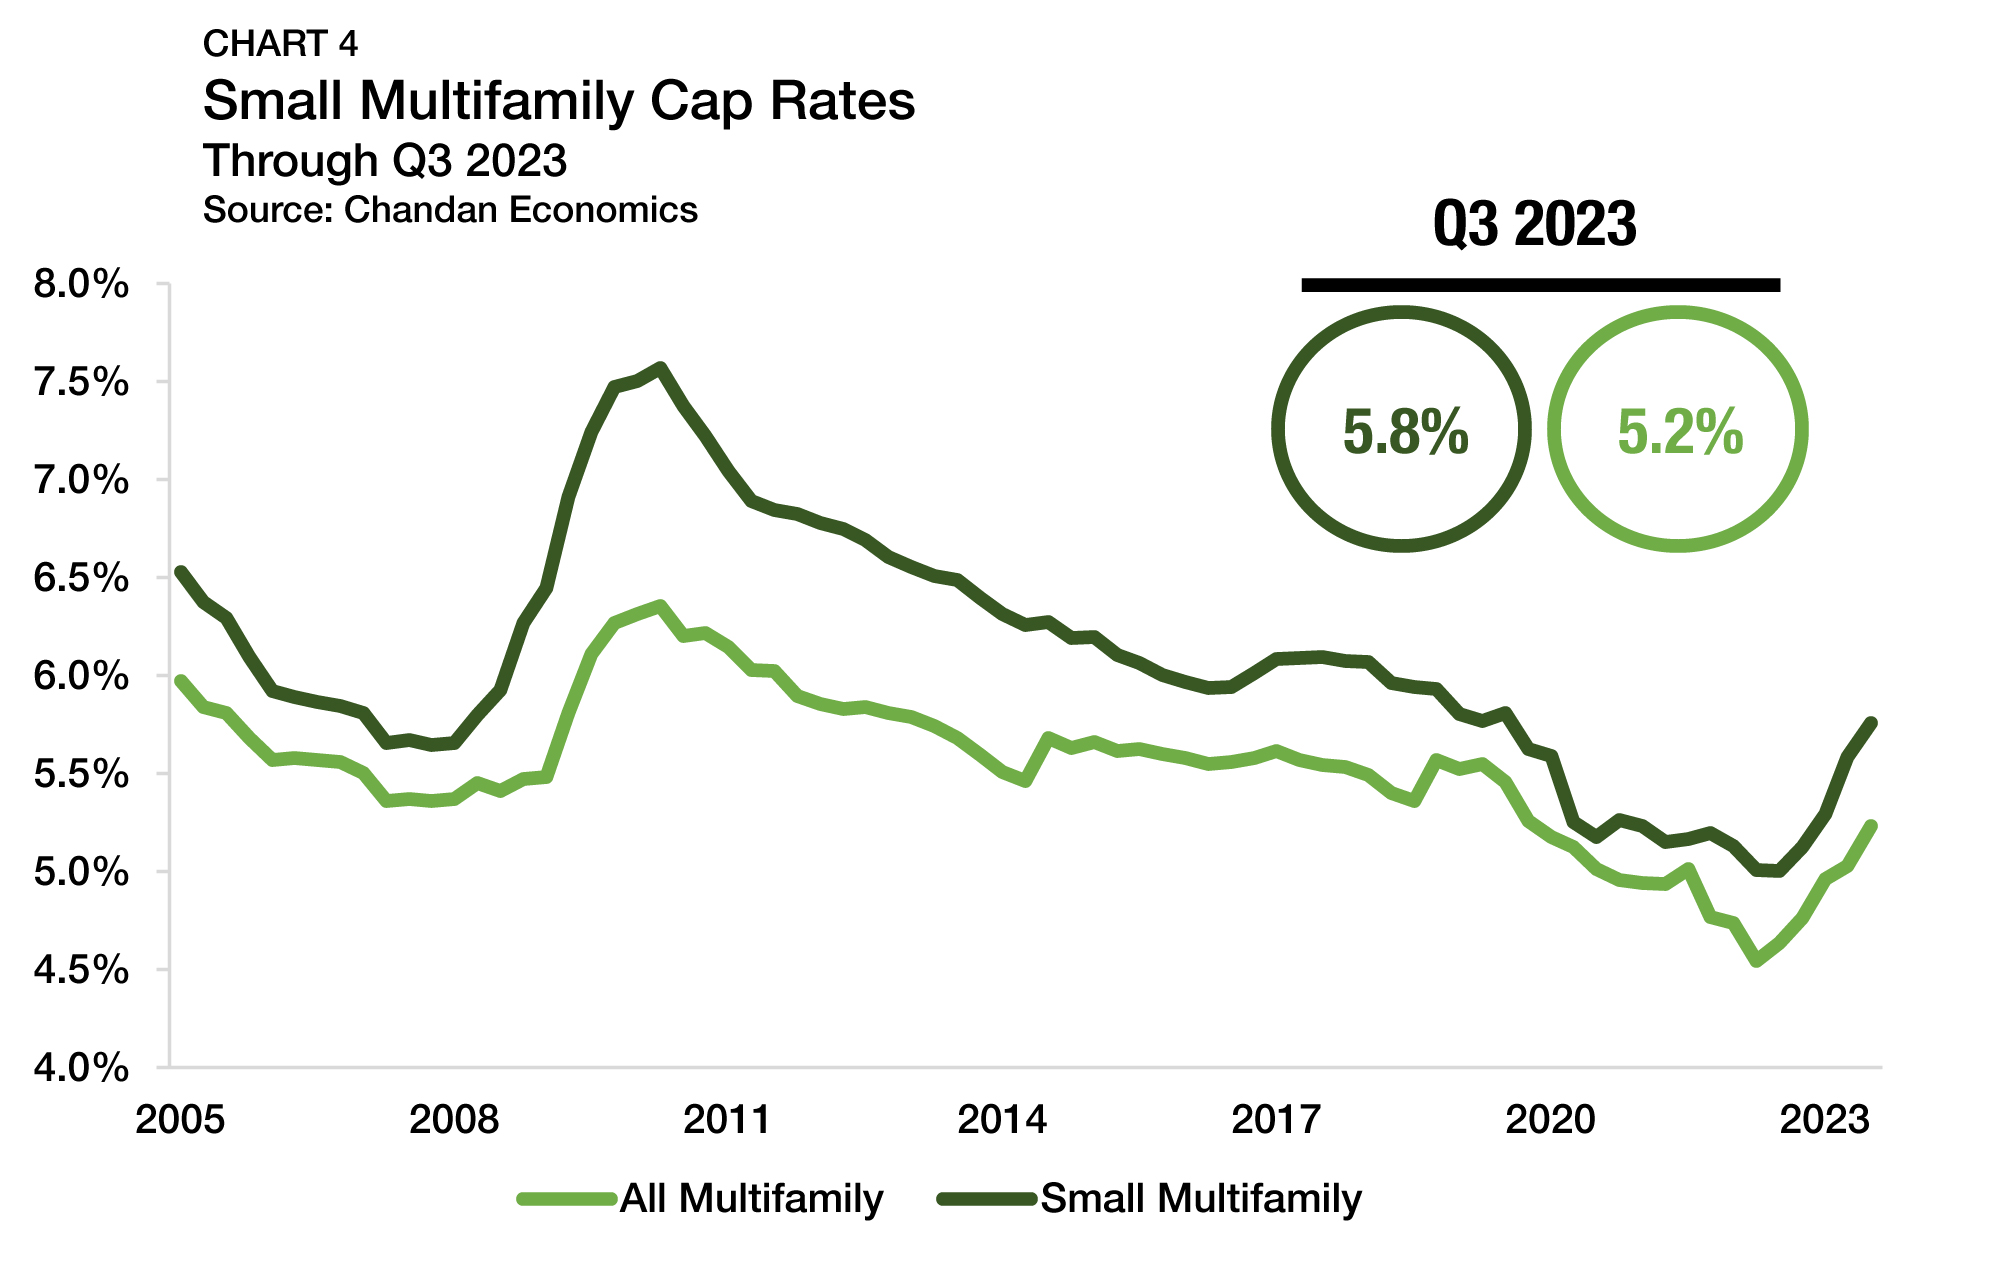
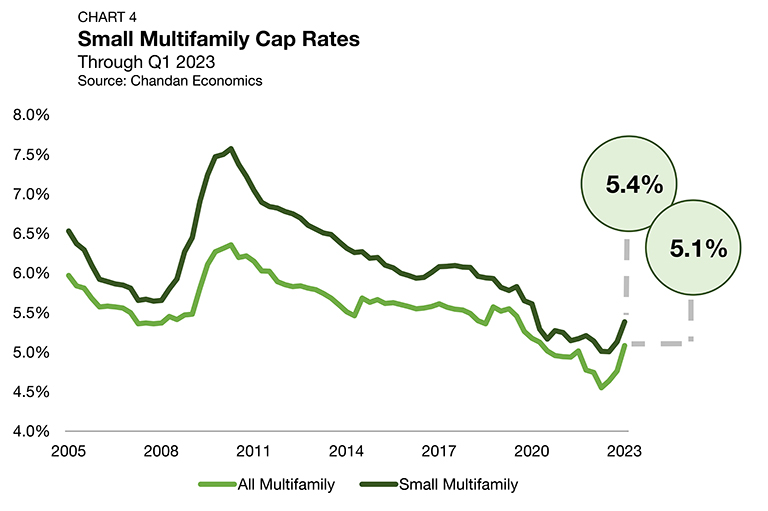
Cap Rates & Spreads
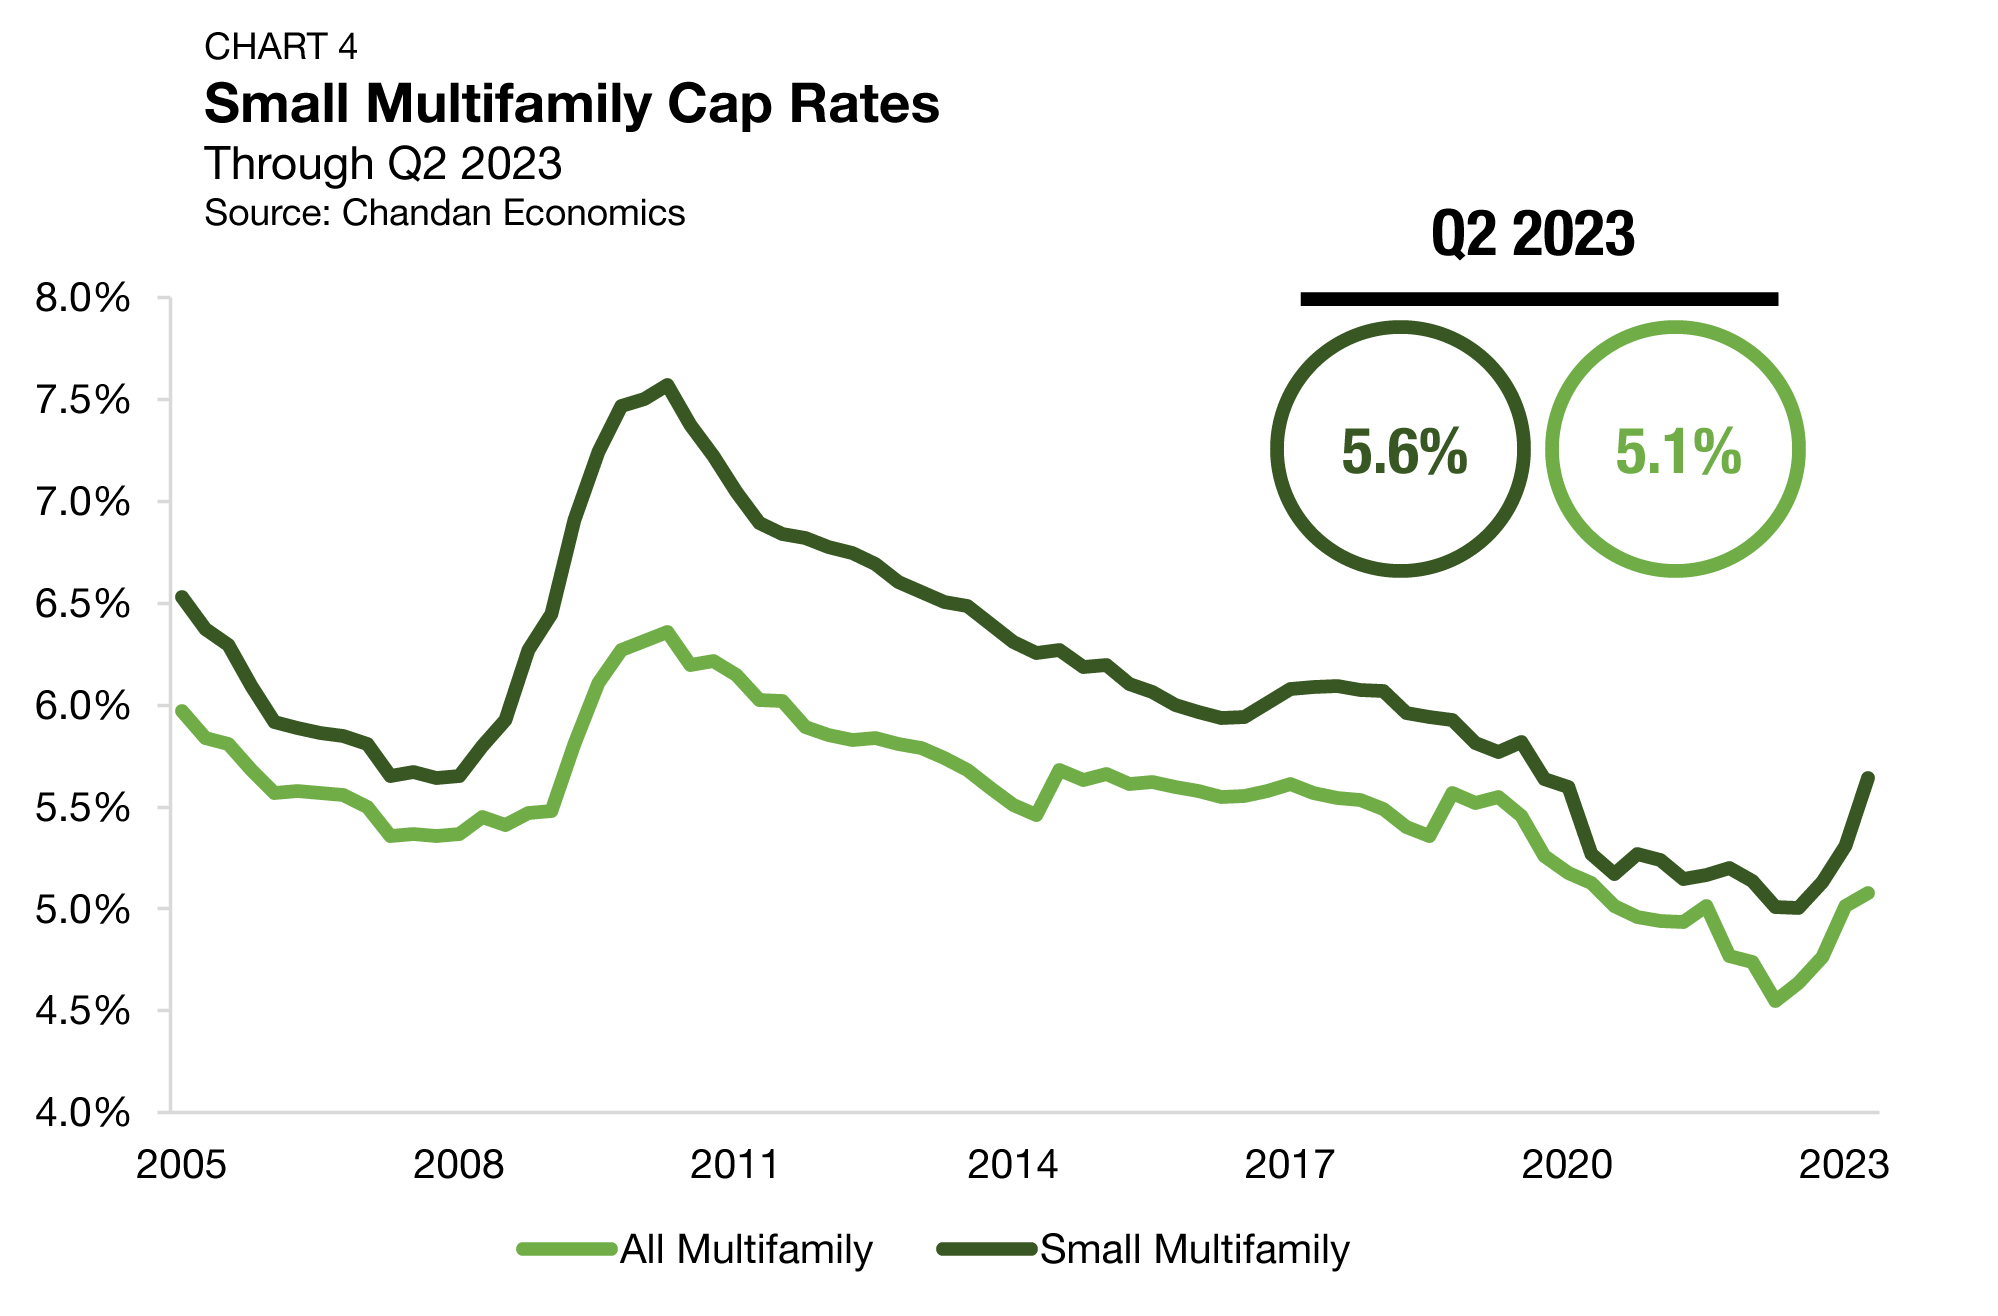
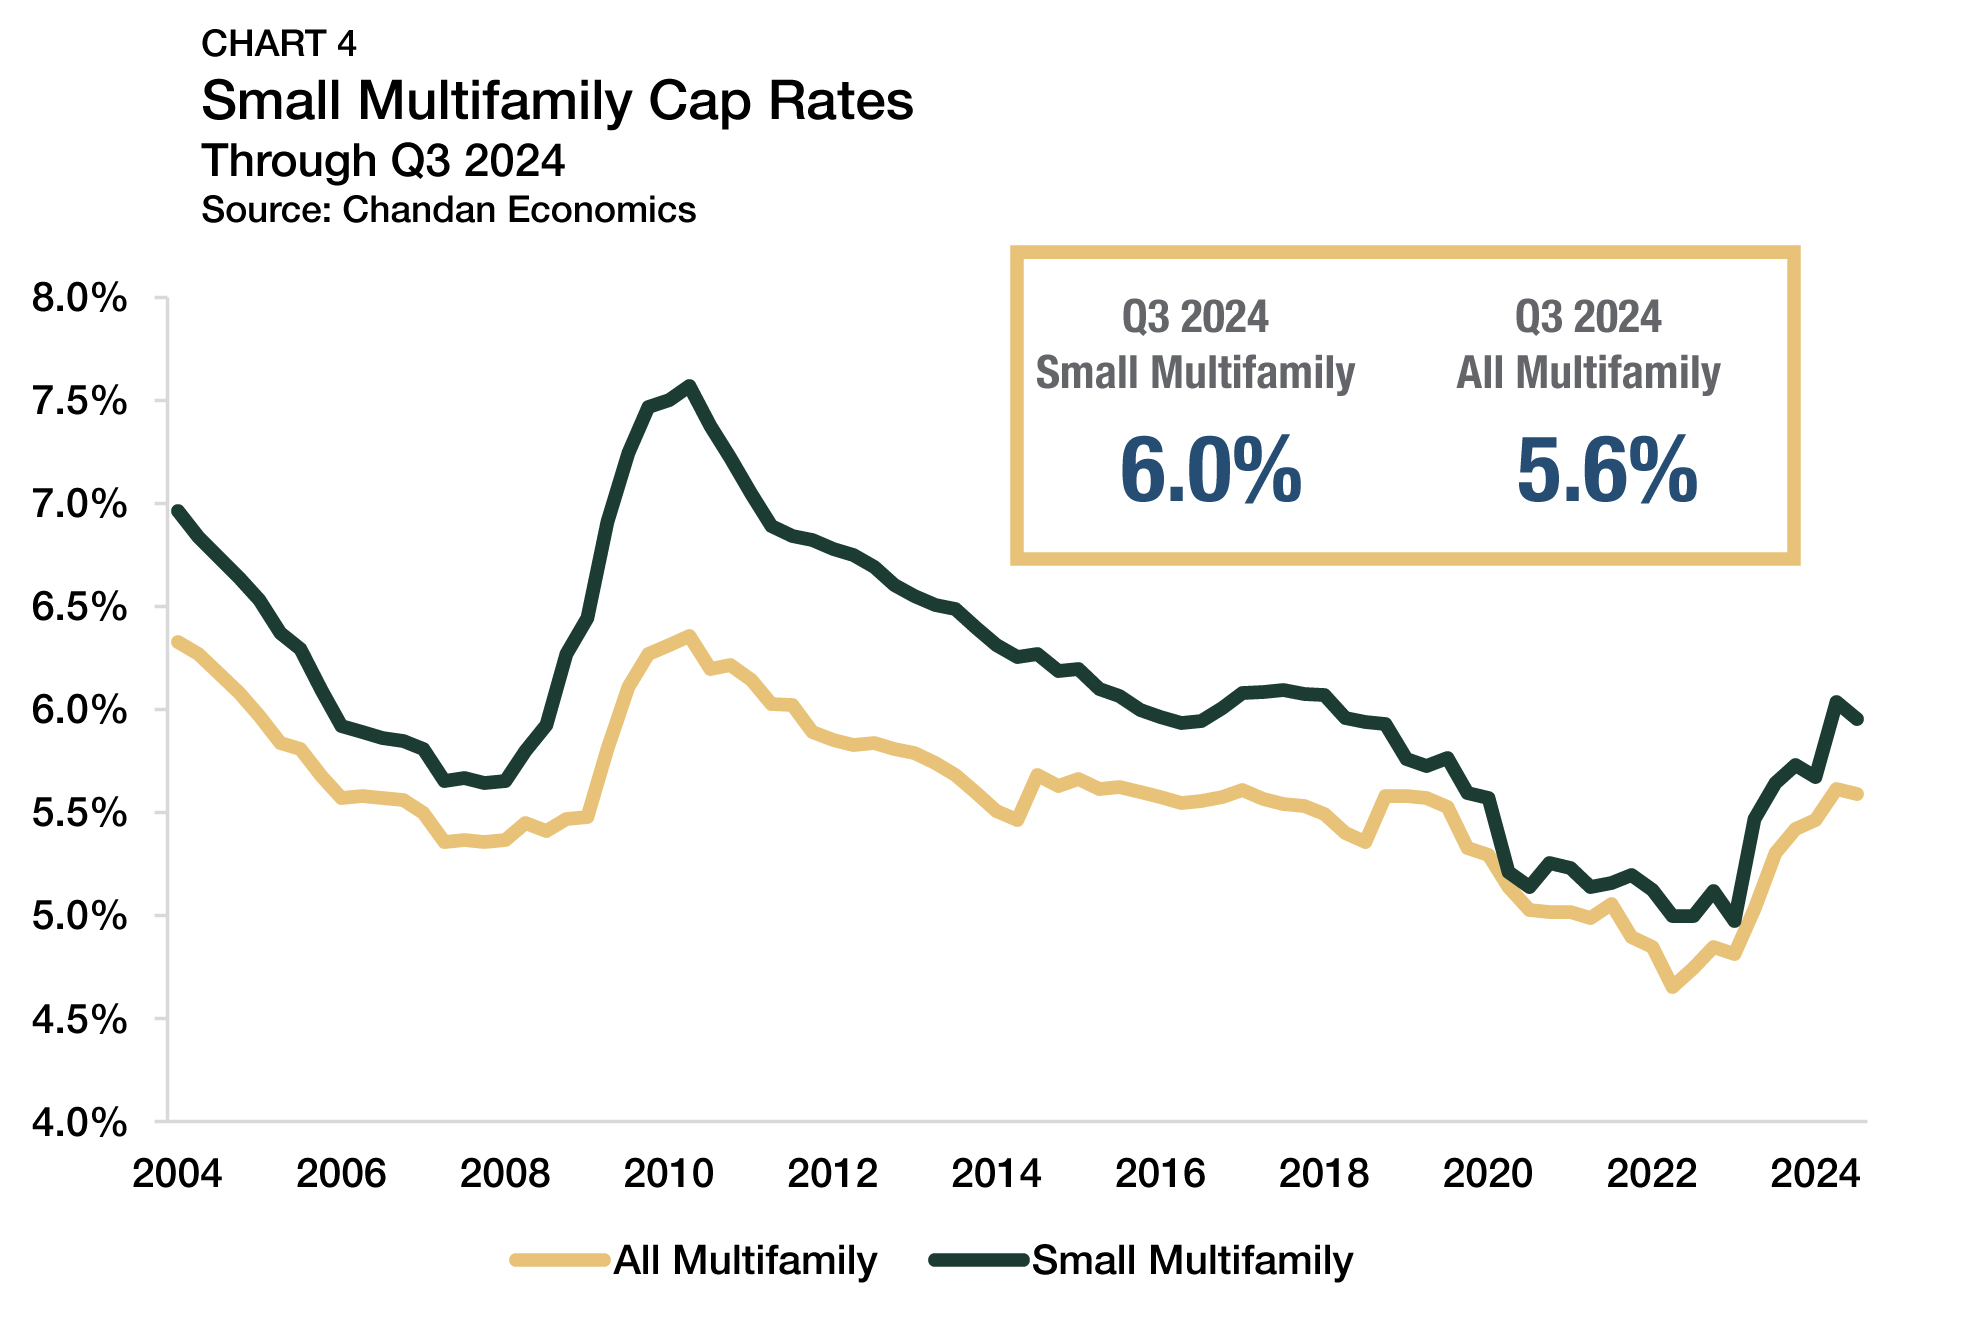
In the third quarter of 2024, small multifamily cap rates averaged 6.0%, declining slightly from the previous quarter (Chart 4). The decline moved the average cap rate for the subsector below its six-year high. Despite a small decrease last quarter, small multifamily cap rates have risen by 31 bps from one year ago and 98 bps compared to the cyclical low point set in early 2023. While elevated cap rates have negatively impacted asset valuations in recent quarters, they have also improved the return profile of small multifamily properties for prospective investors.
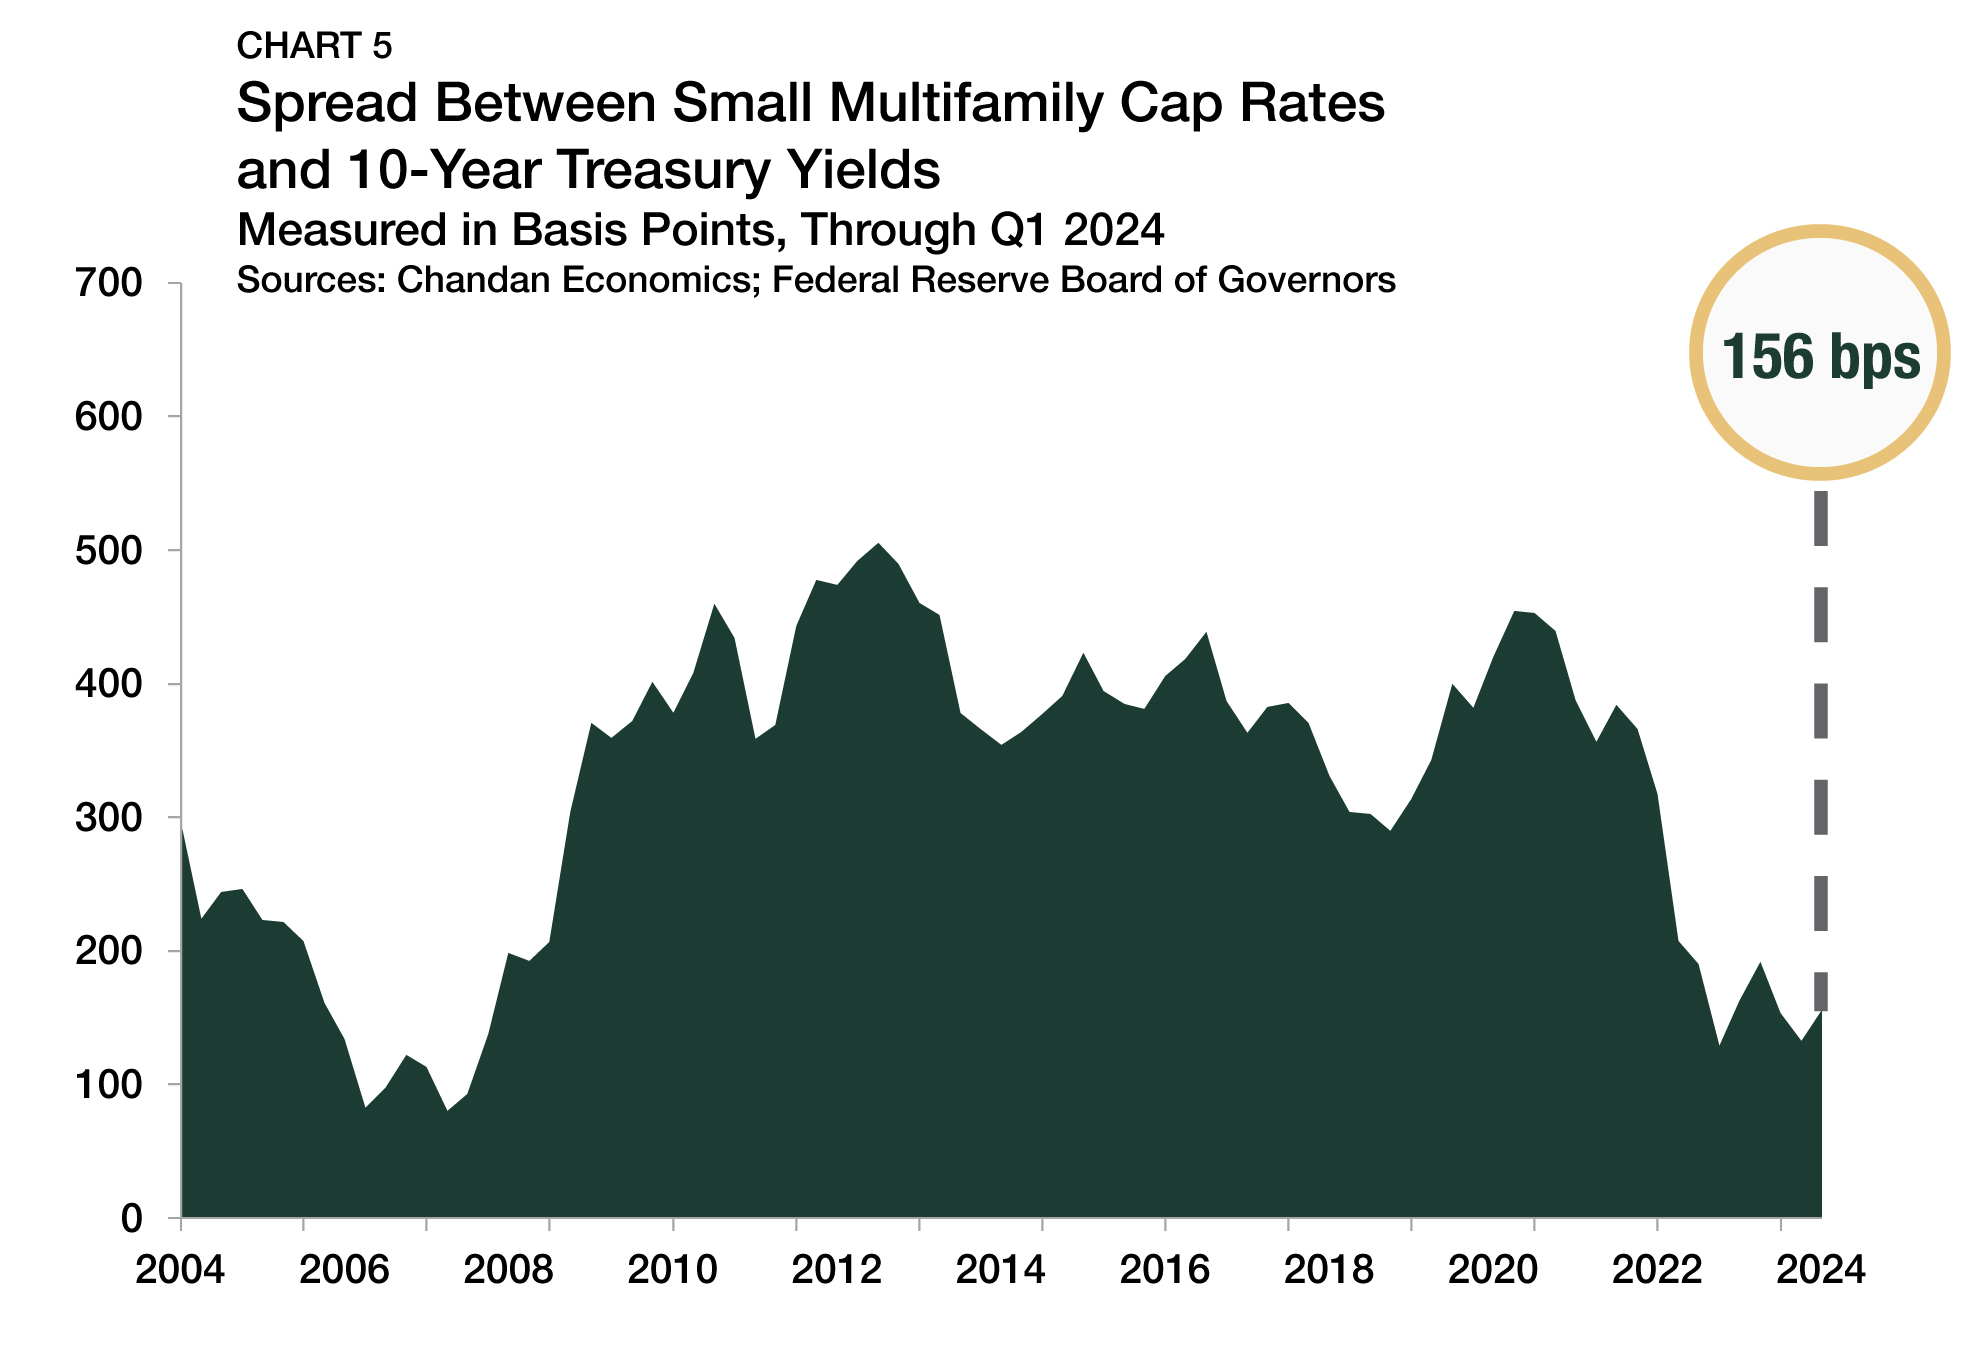
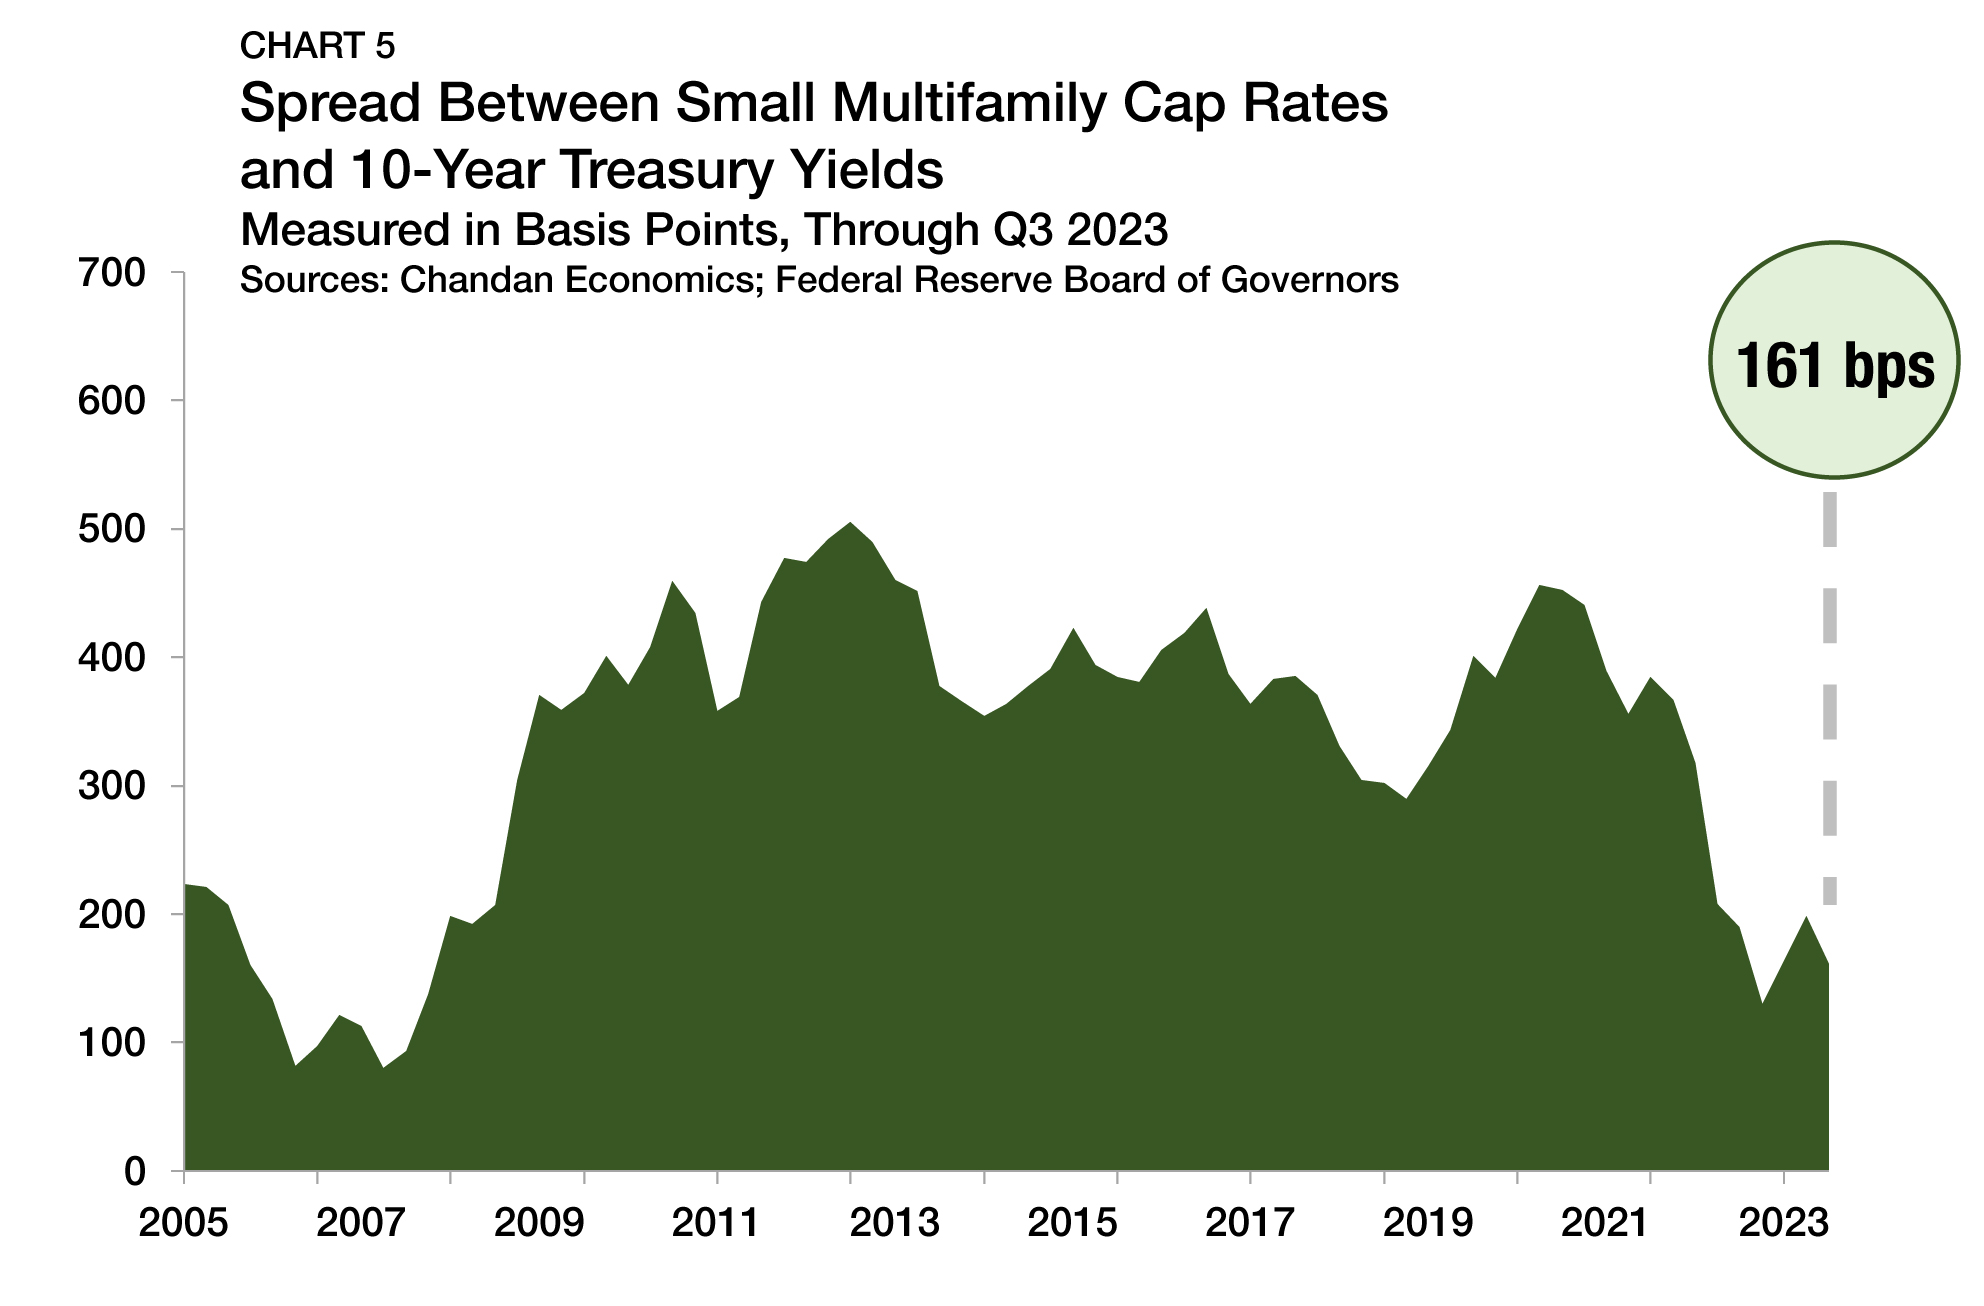
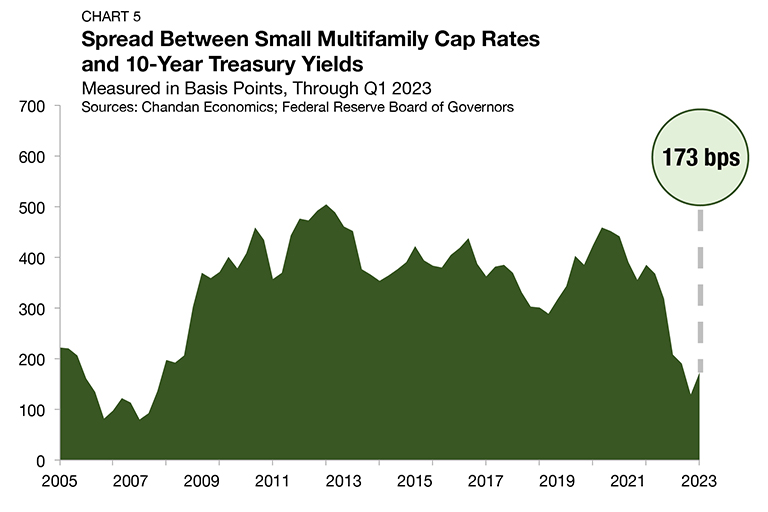
The small multifamily risk premium, best measured by comparing cap rates to the yield on the 10-year Treasury, approximates the additional compensation that investors require to account for higher levels of risk. This risk premium widened by 42 bps in the third quarter of 2024 to reach 201 bps (Chart 5). The increase occurred as 10-year Treasury yields averaged 4.0% between July and September 2024 — down from 4.5% in the second quarter of the year.
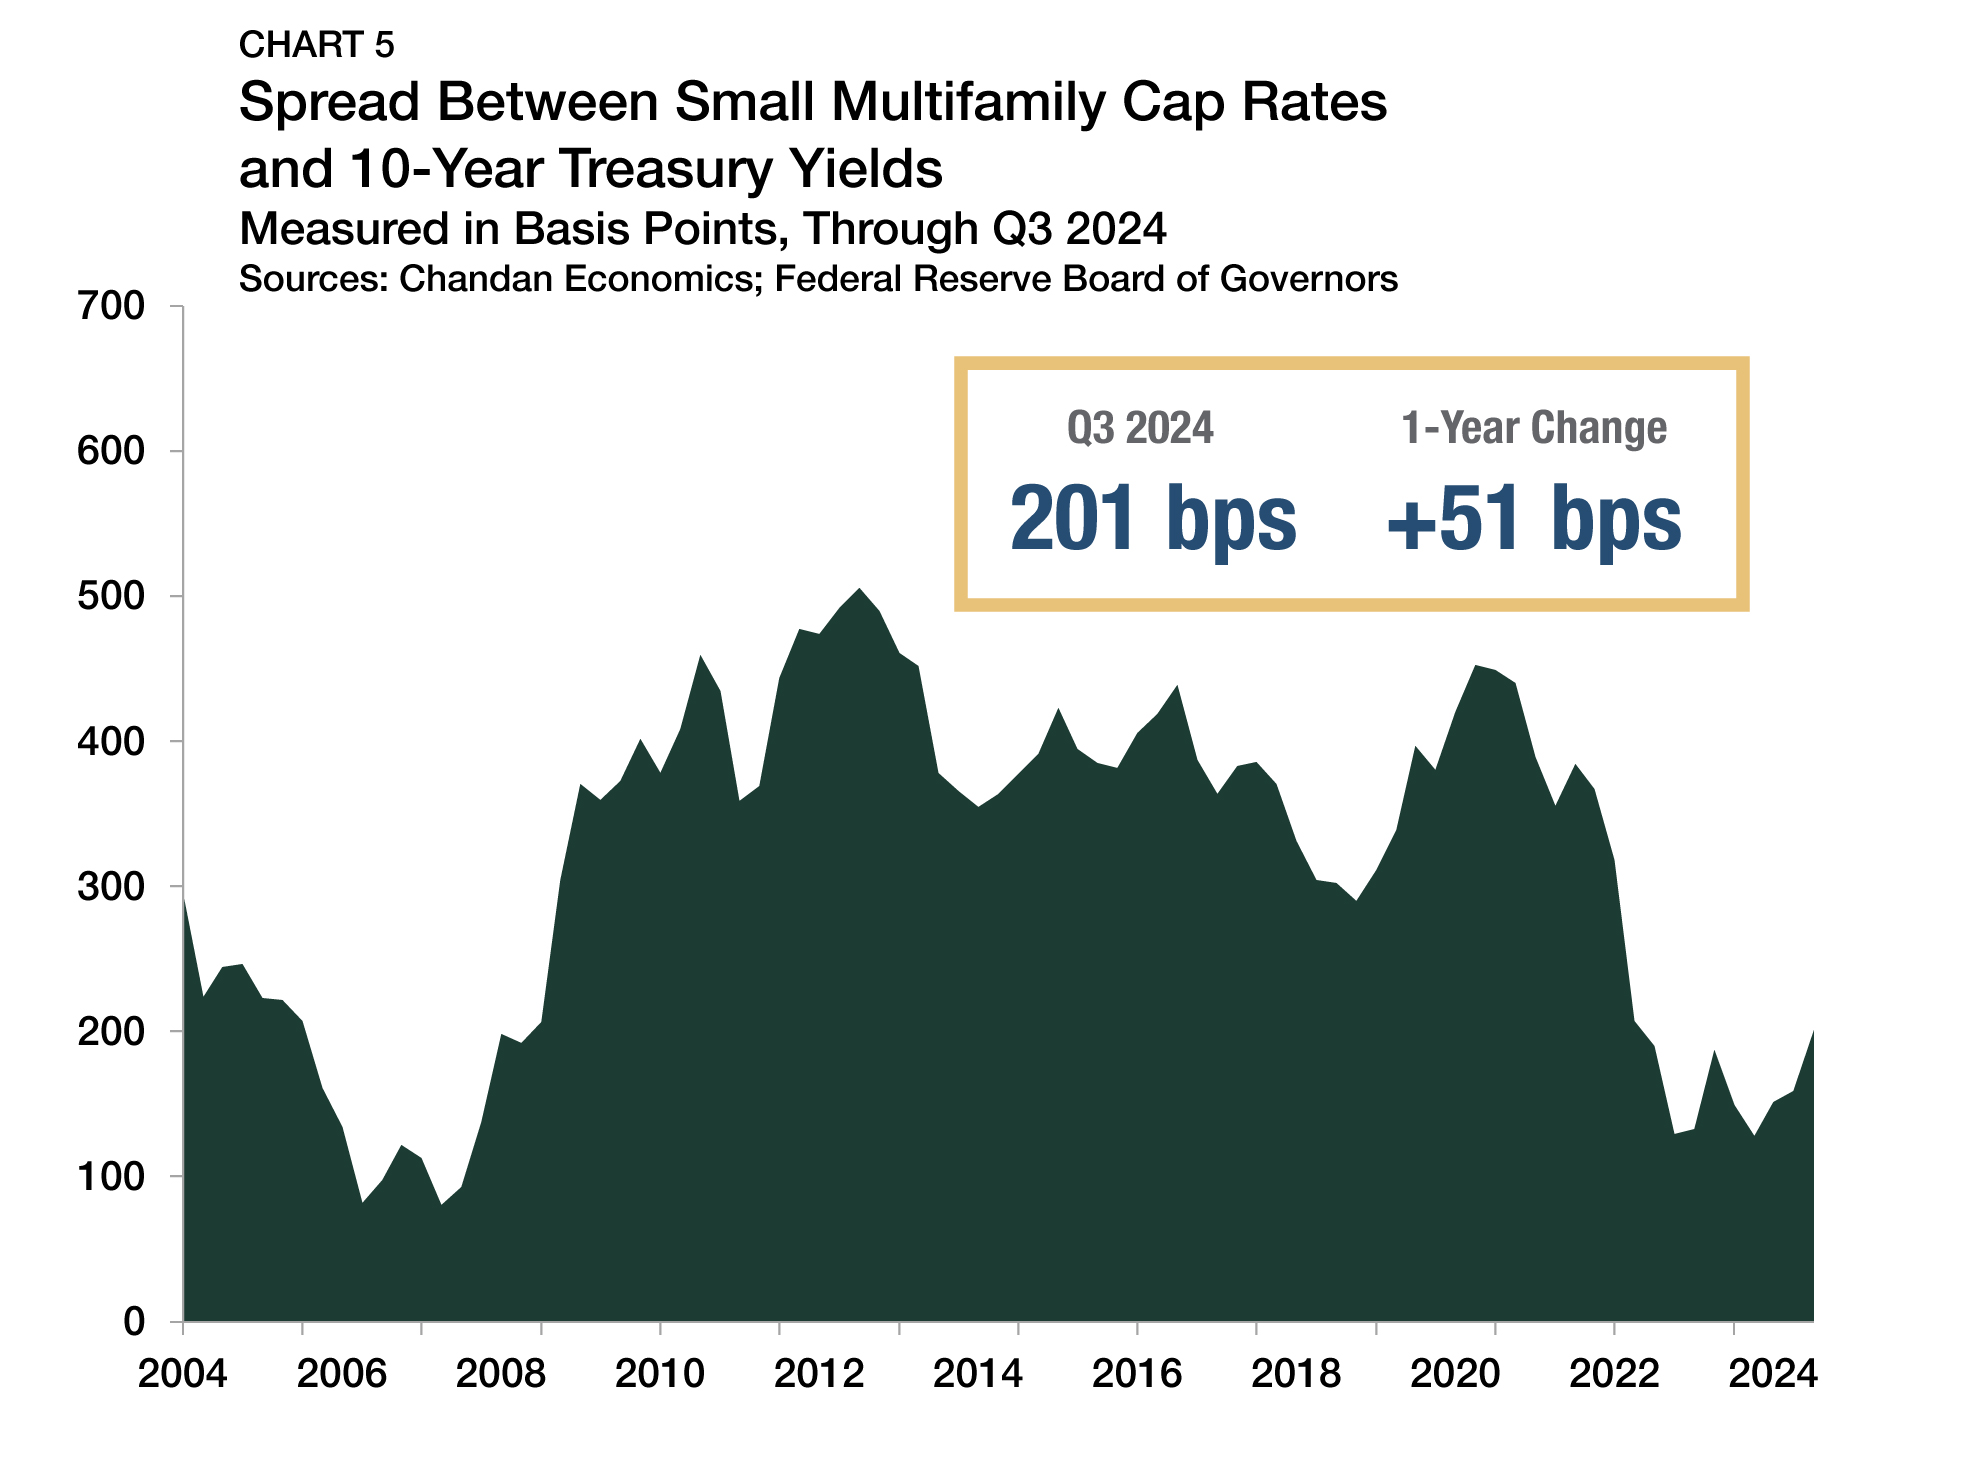
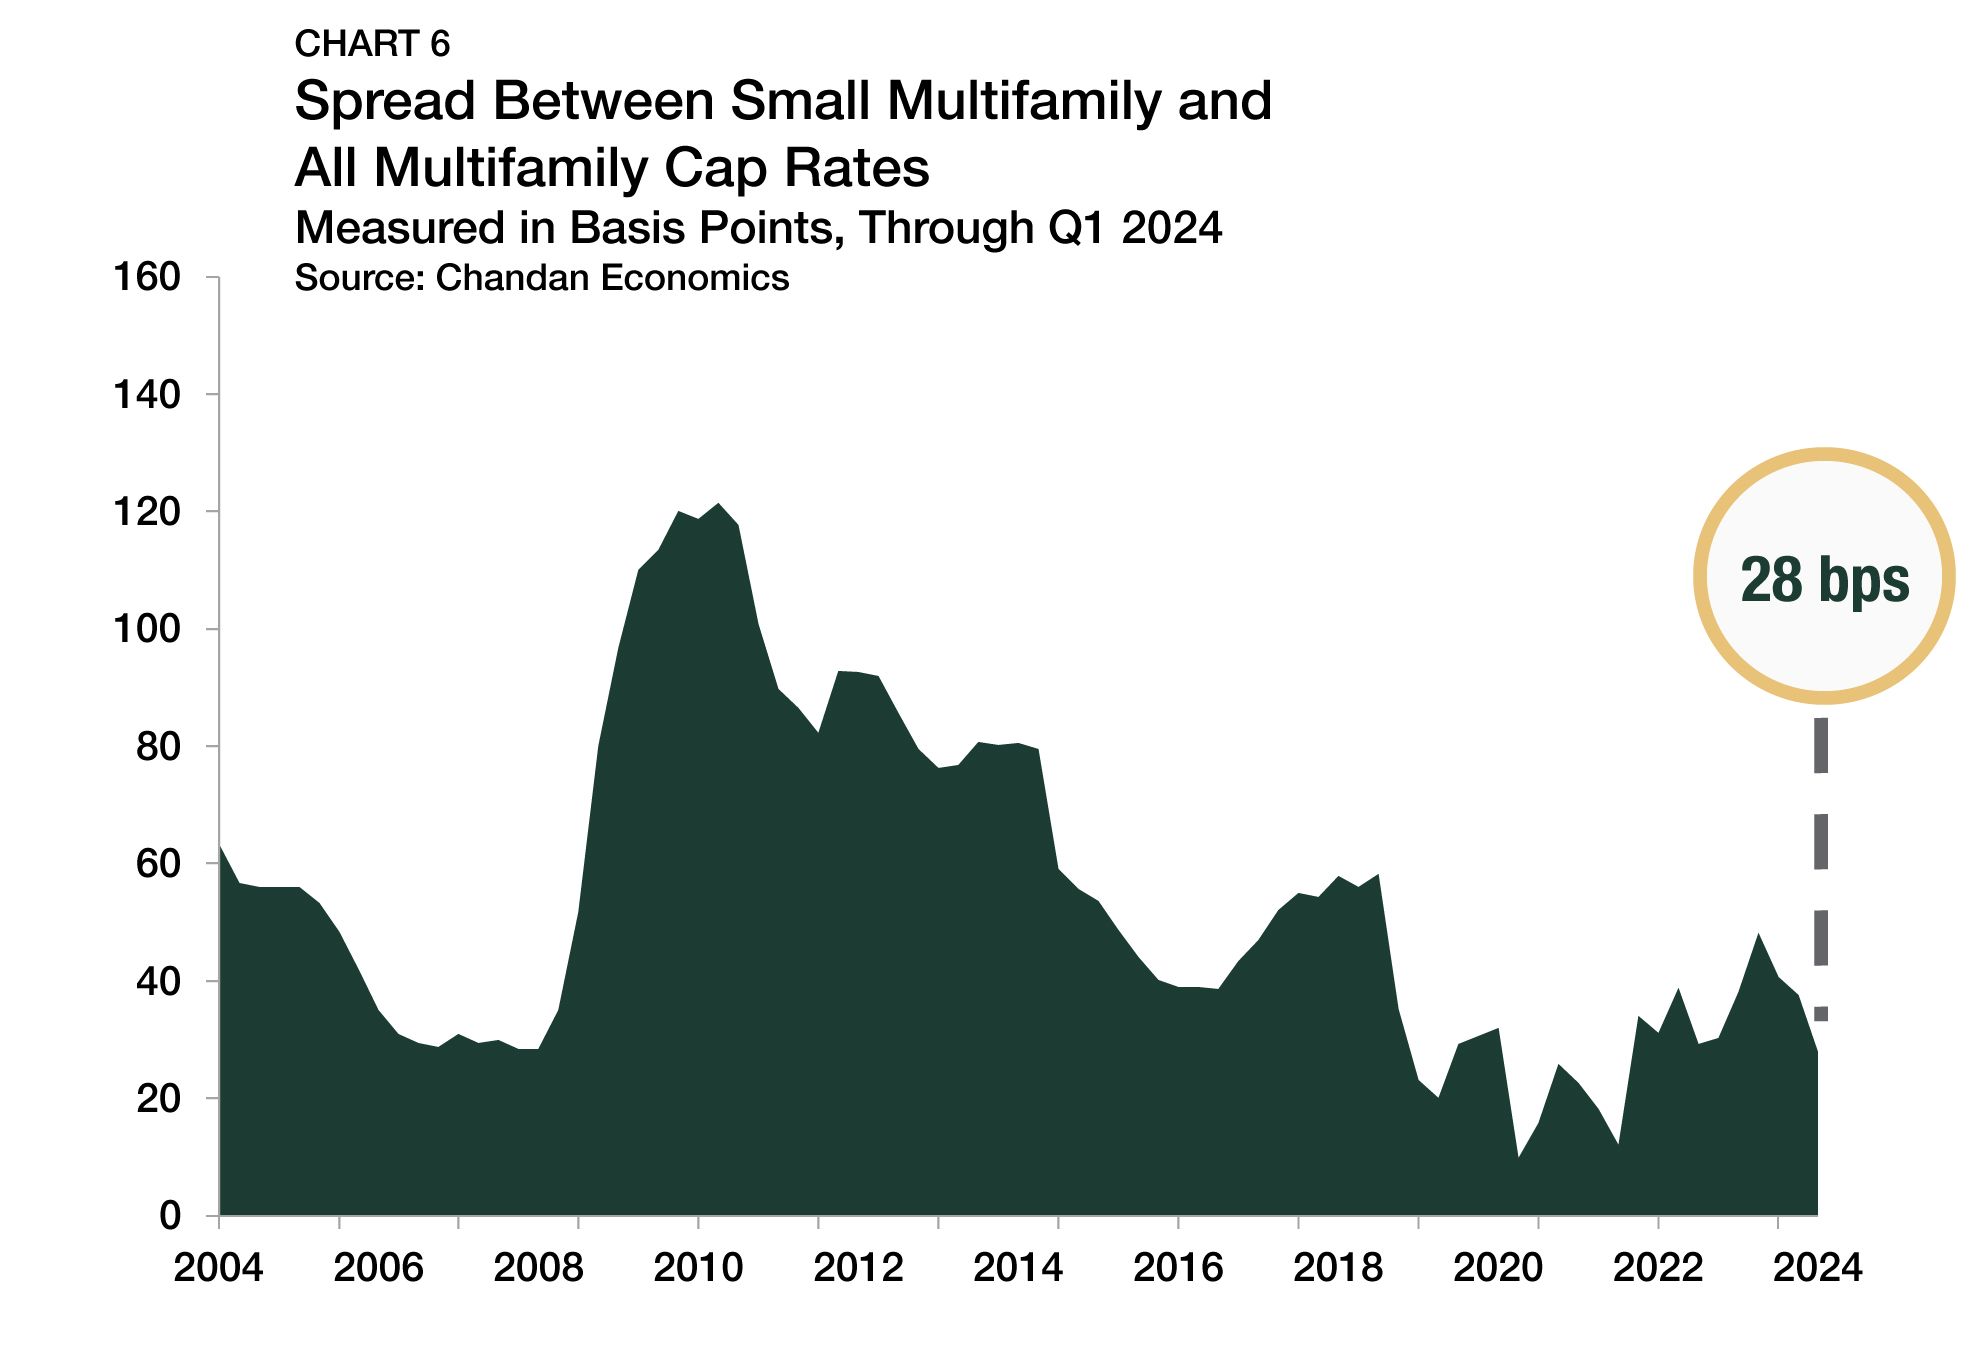
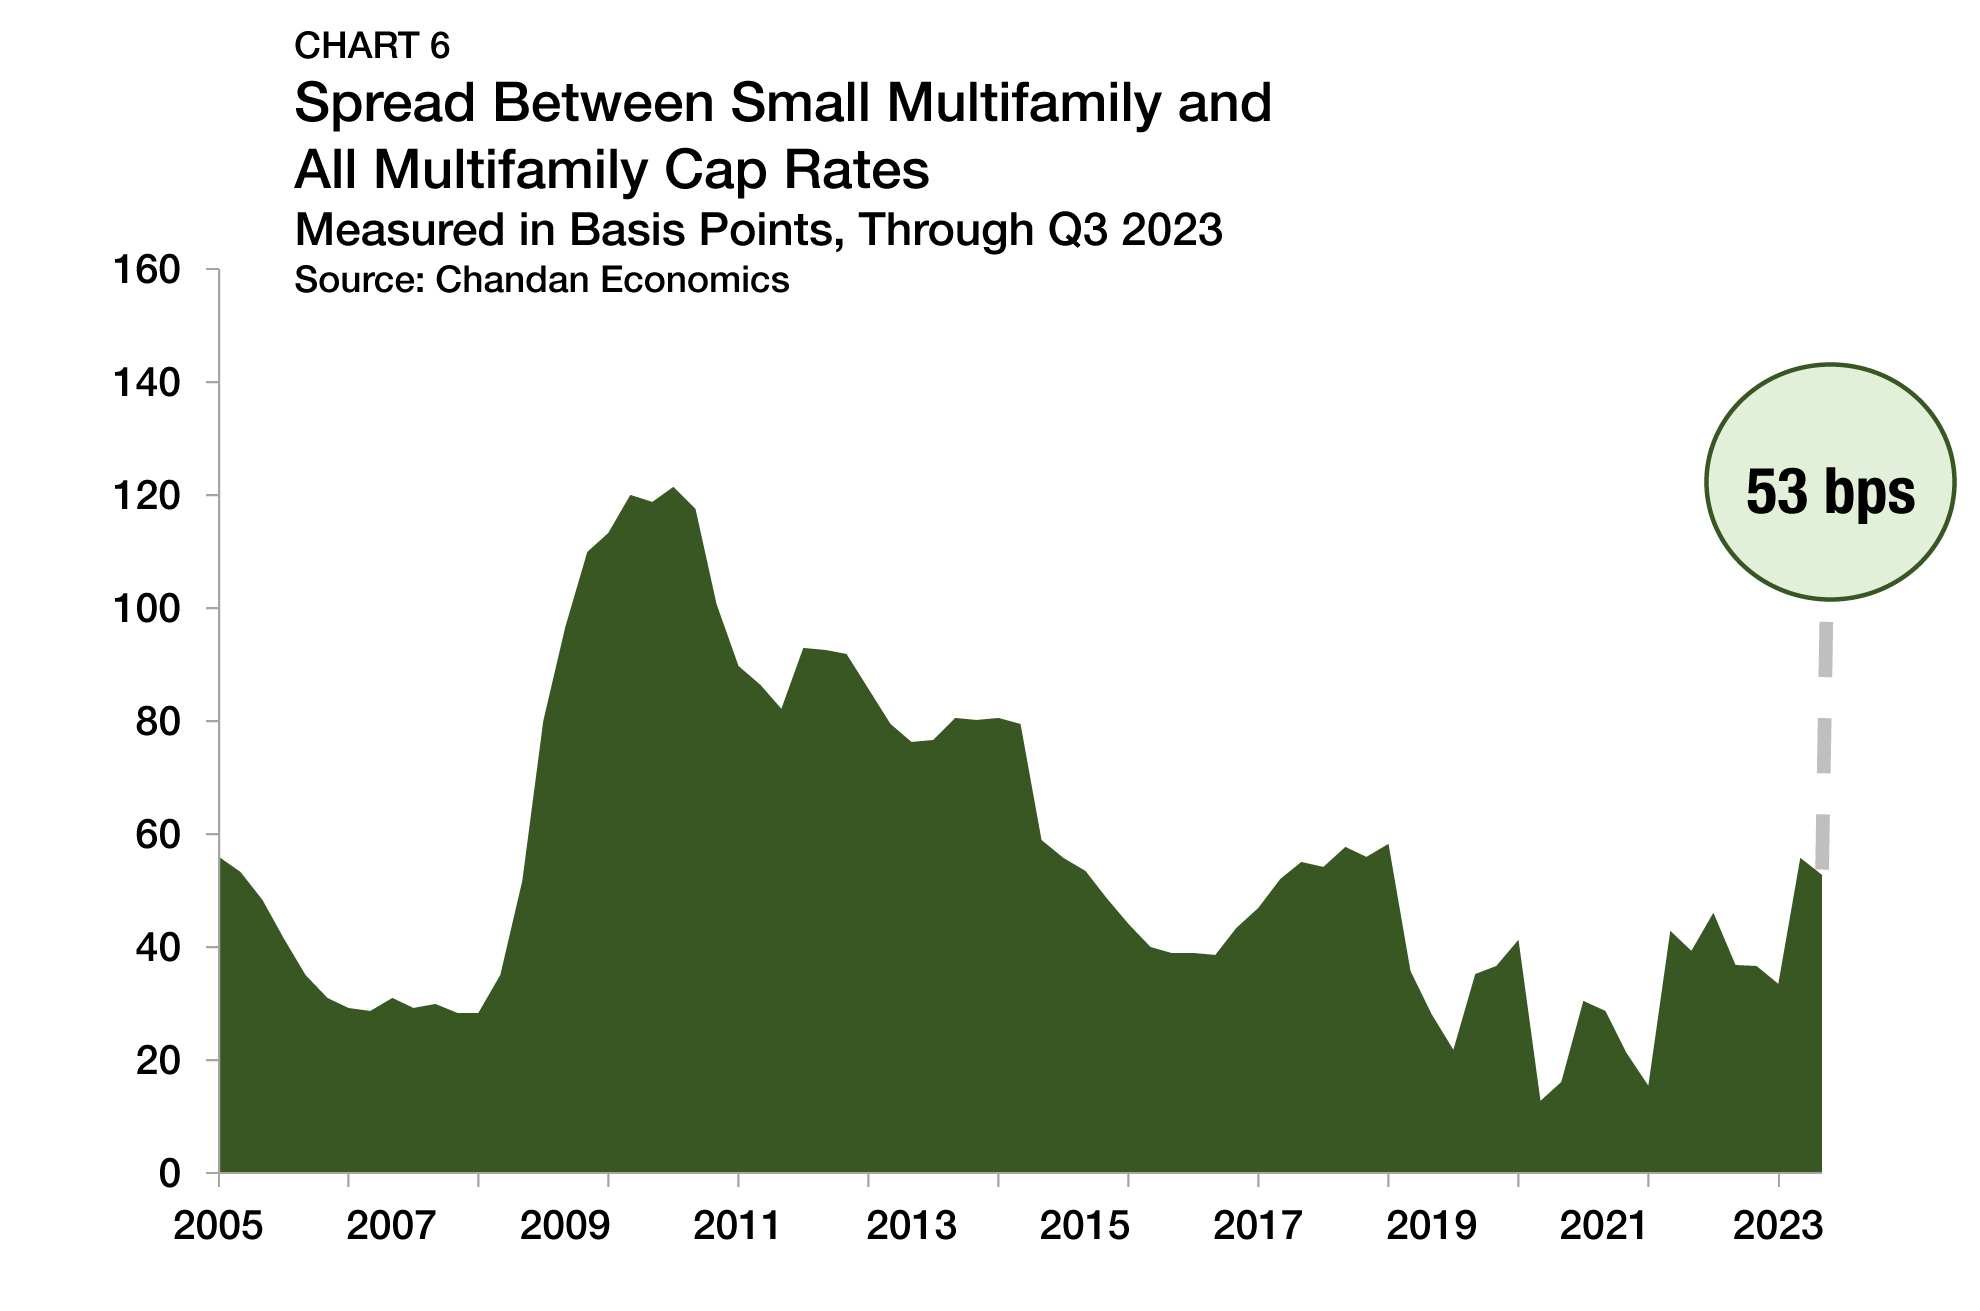
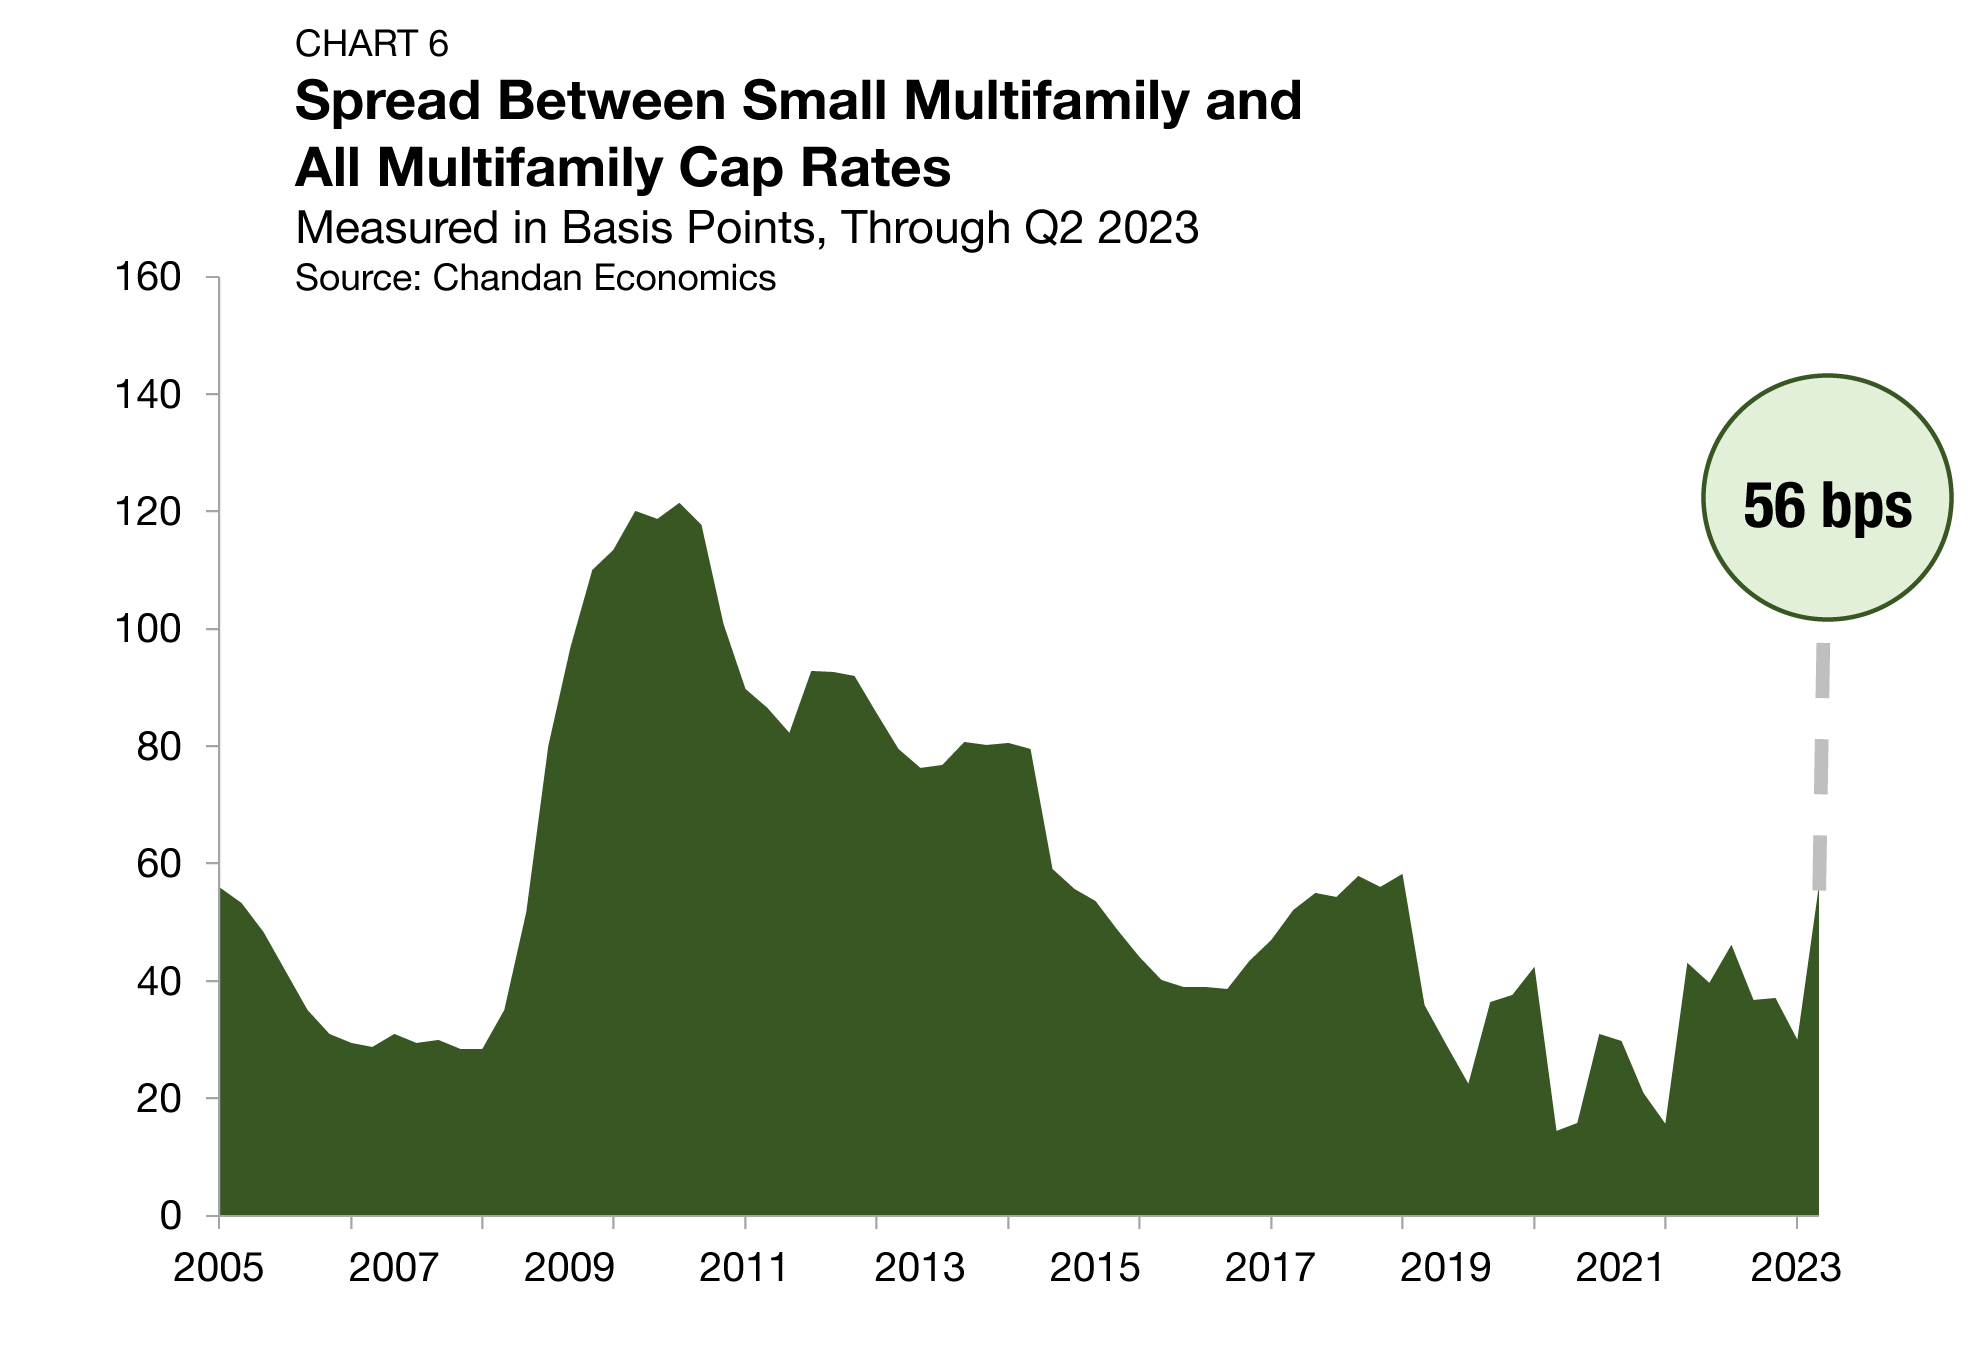
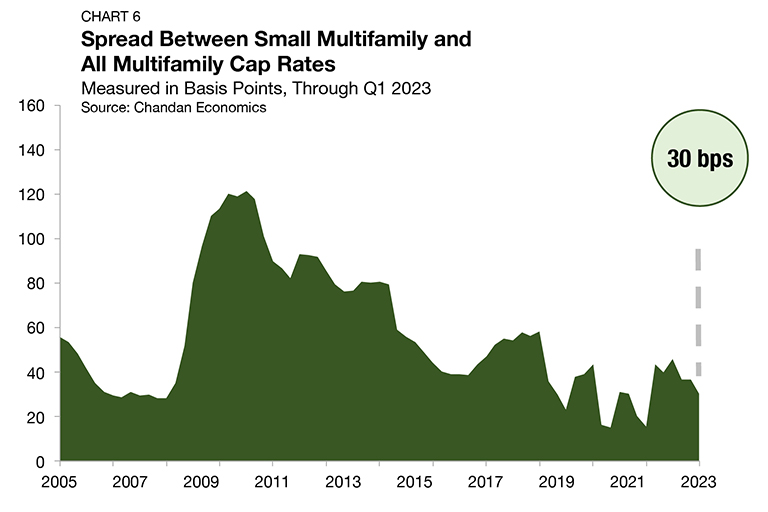
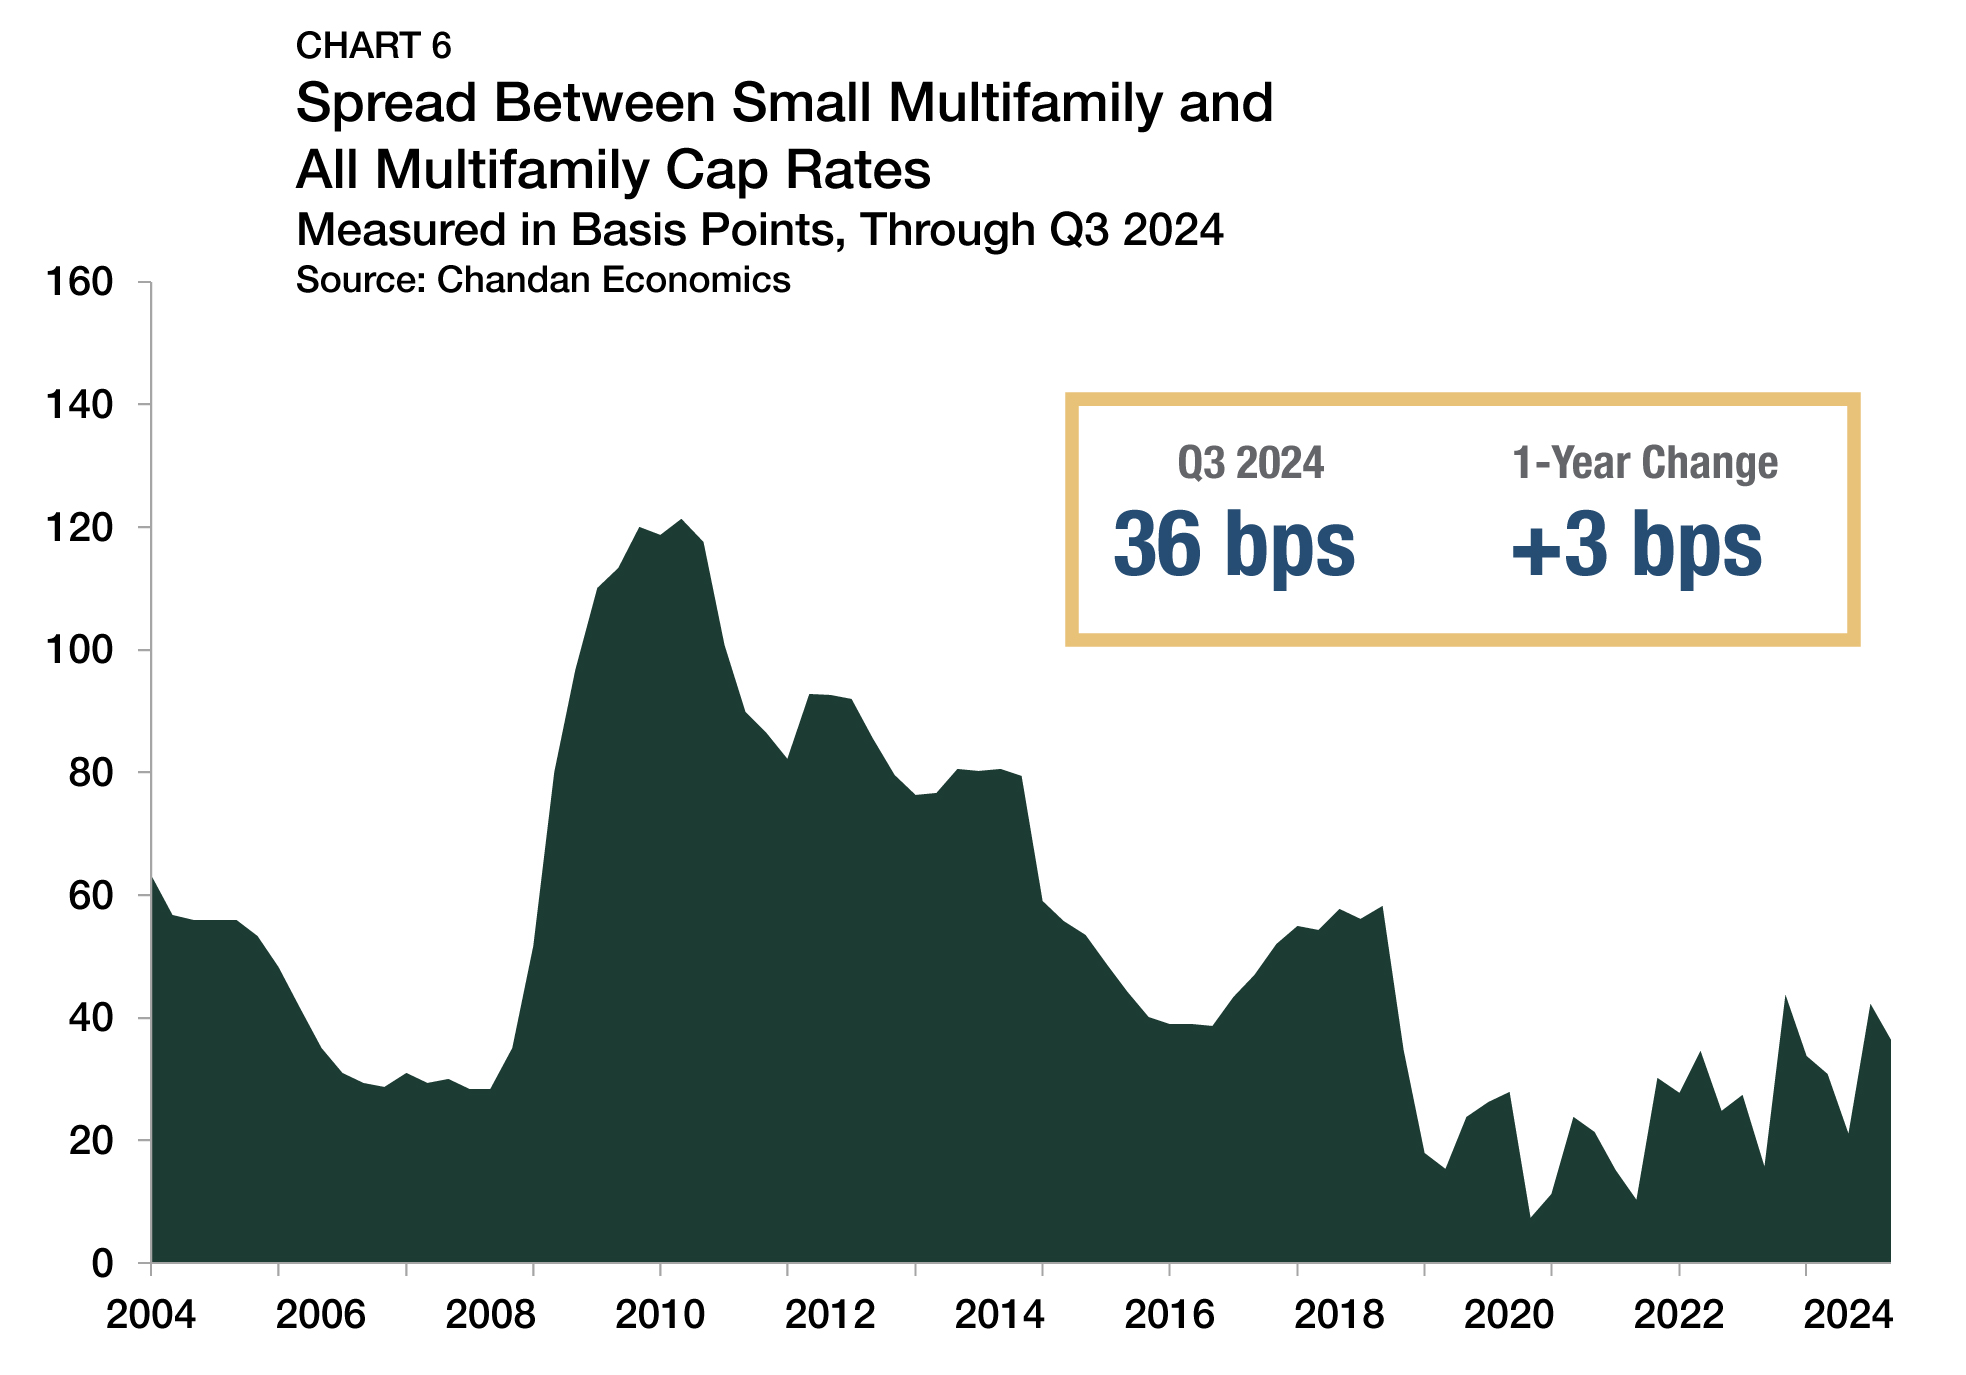
The increase in the spread represents a reversion towards pre-pandemic trends. Between 2015 and 2019, the small multifamily risk premiumaveraged 370 bps — nearly double the current spread. Simultaneously, the cap rate spread between small multifamily assets and the rest of the multifamily sector, a measure of the risk unique to smaller properties, decreased by a marginal 6 bps during the third quarter to reach 36 bps (Chart 6).
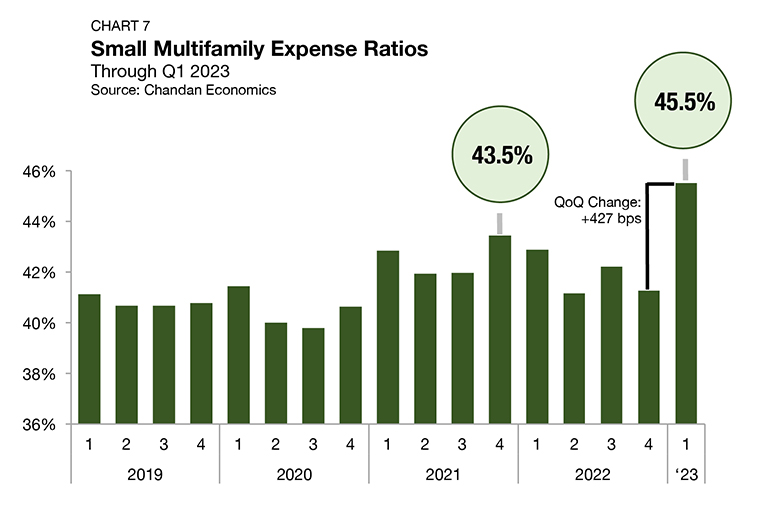
Expense Ratios
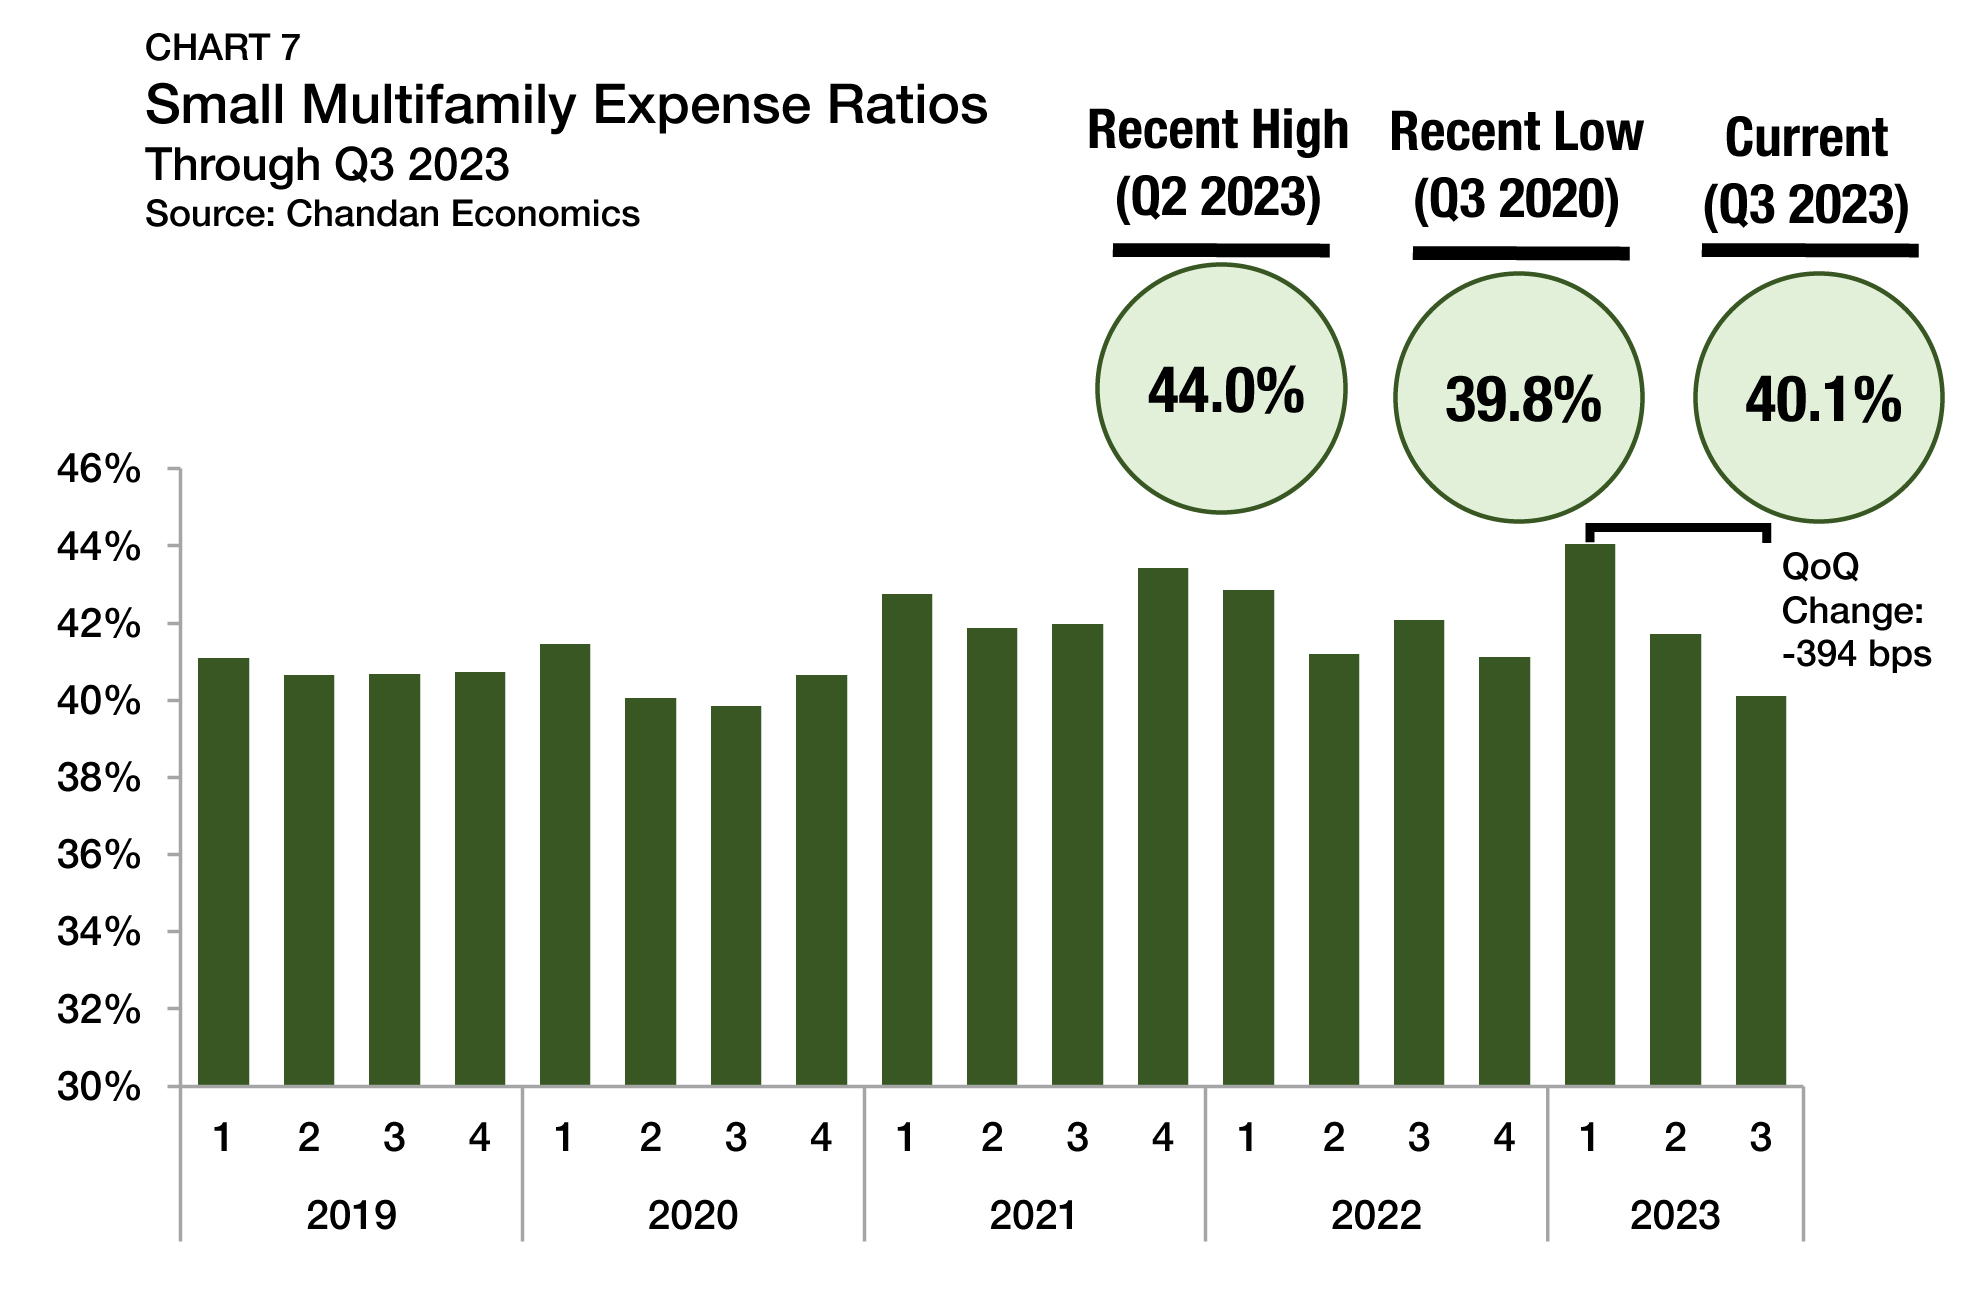
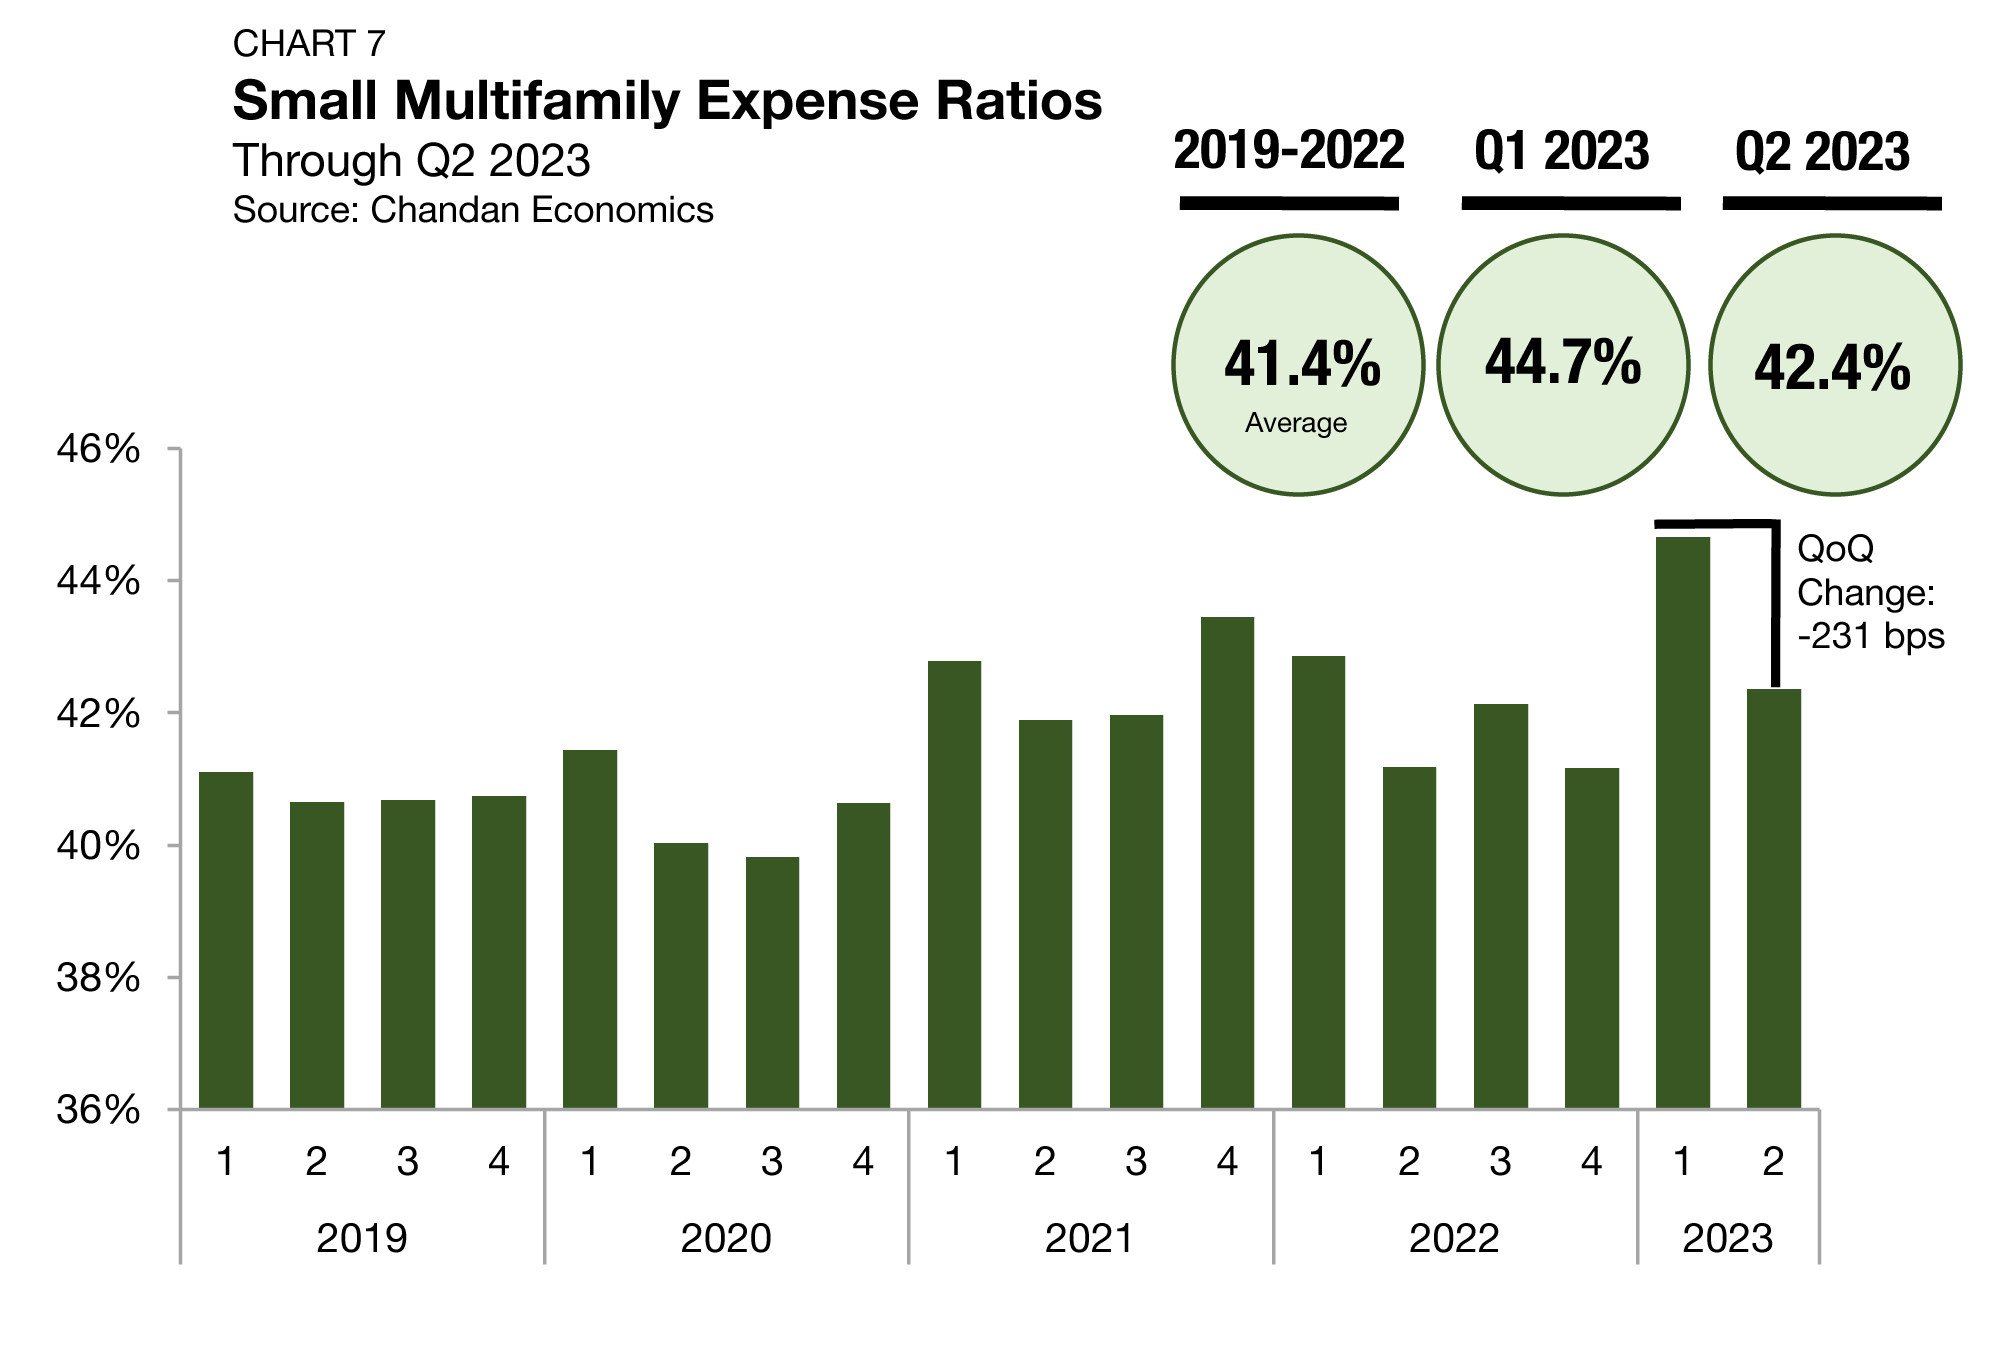
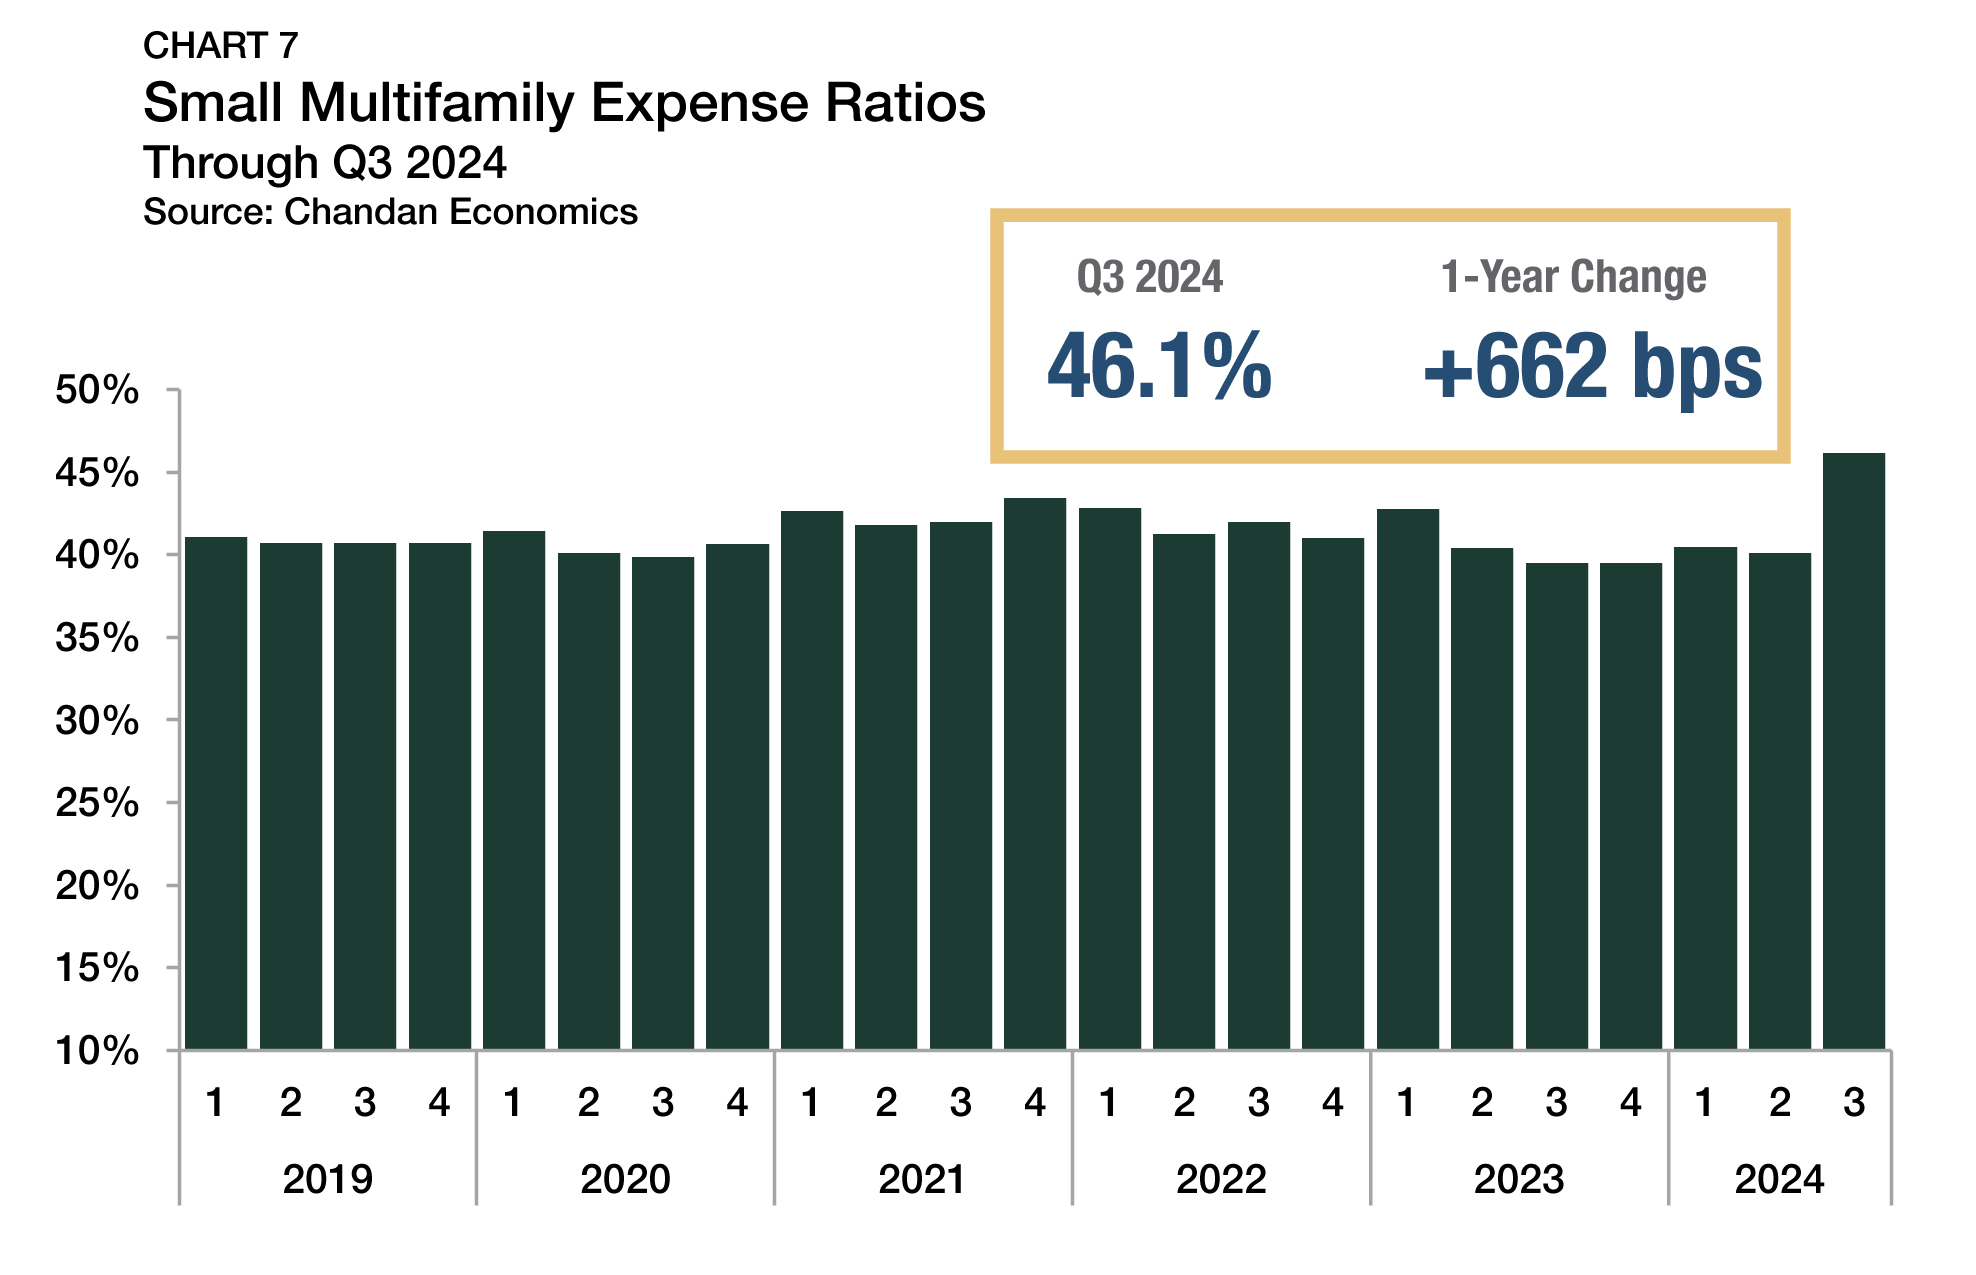
Expense ratios, measured as the relationship between underwritten property-level expenses and gross income, jumped considerably in the third quarter of 2024, rising to 46.1% — the highest level in at least five years (Chart 7). The continued surge in multifamily insurance prices, especially in parts of the country impacted by repeated climate events, has been a growing culprit behind the dramatic uptick in expense ratios.
Occupancy Rates
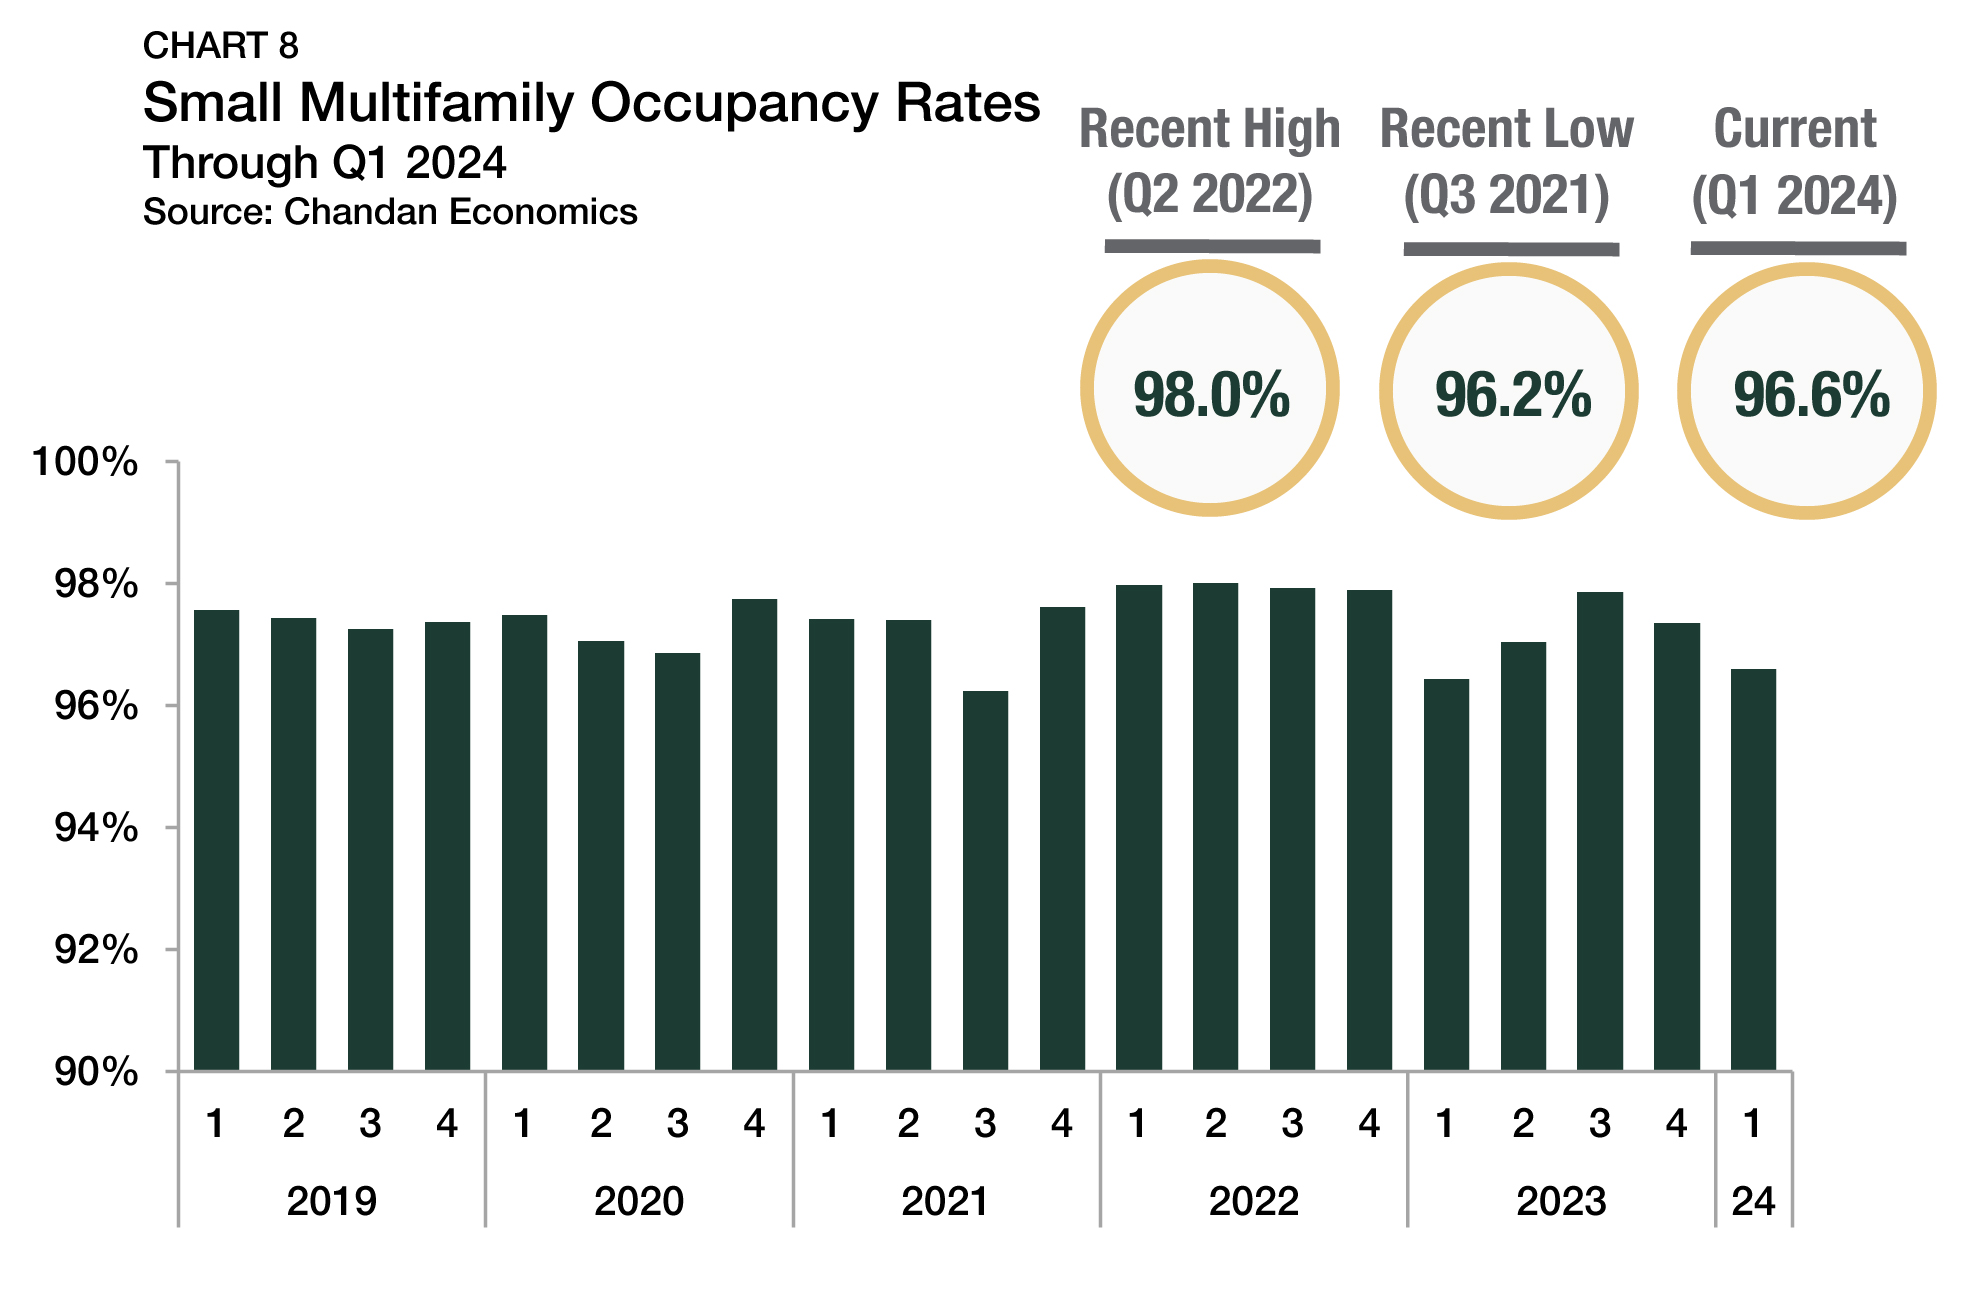
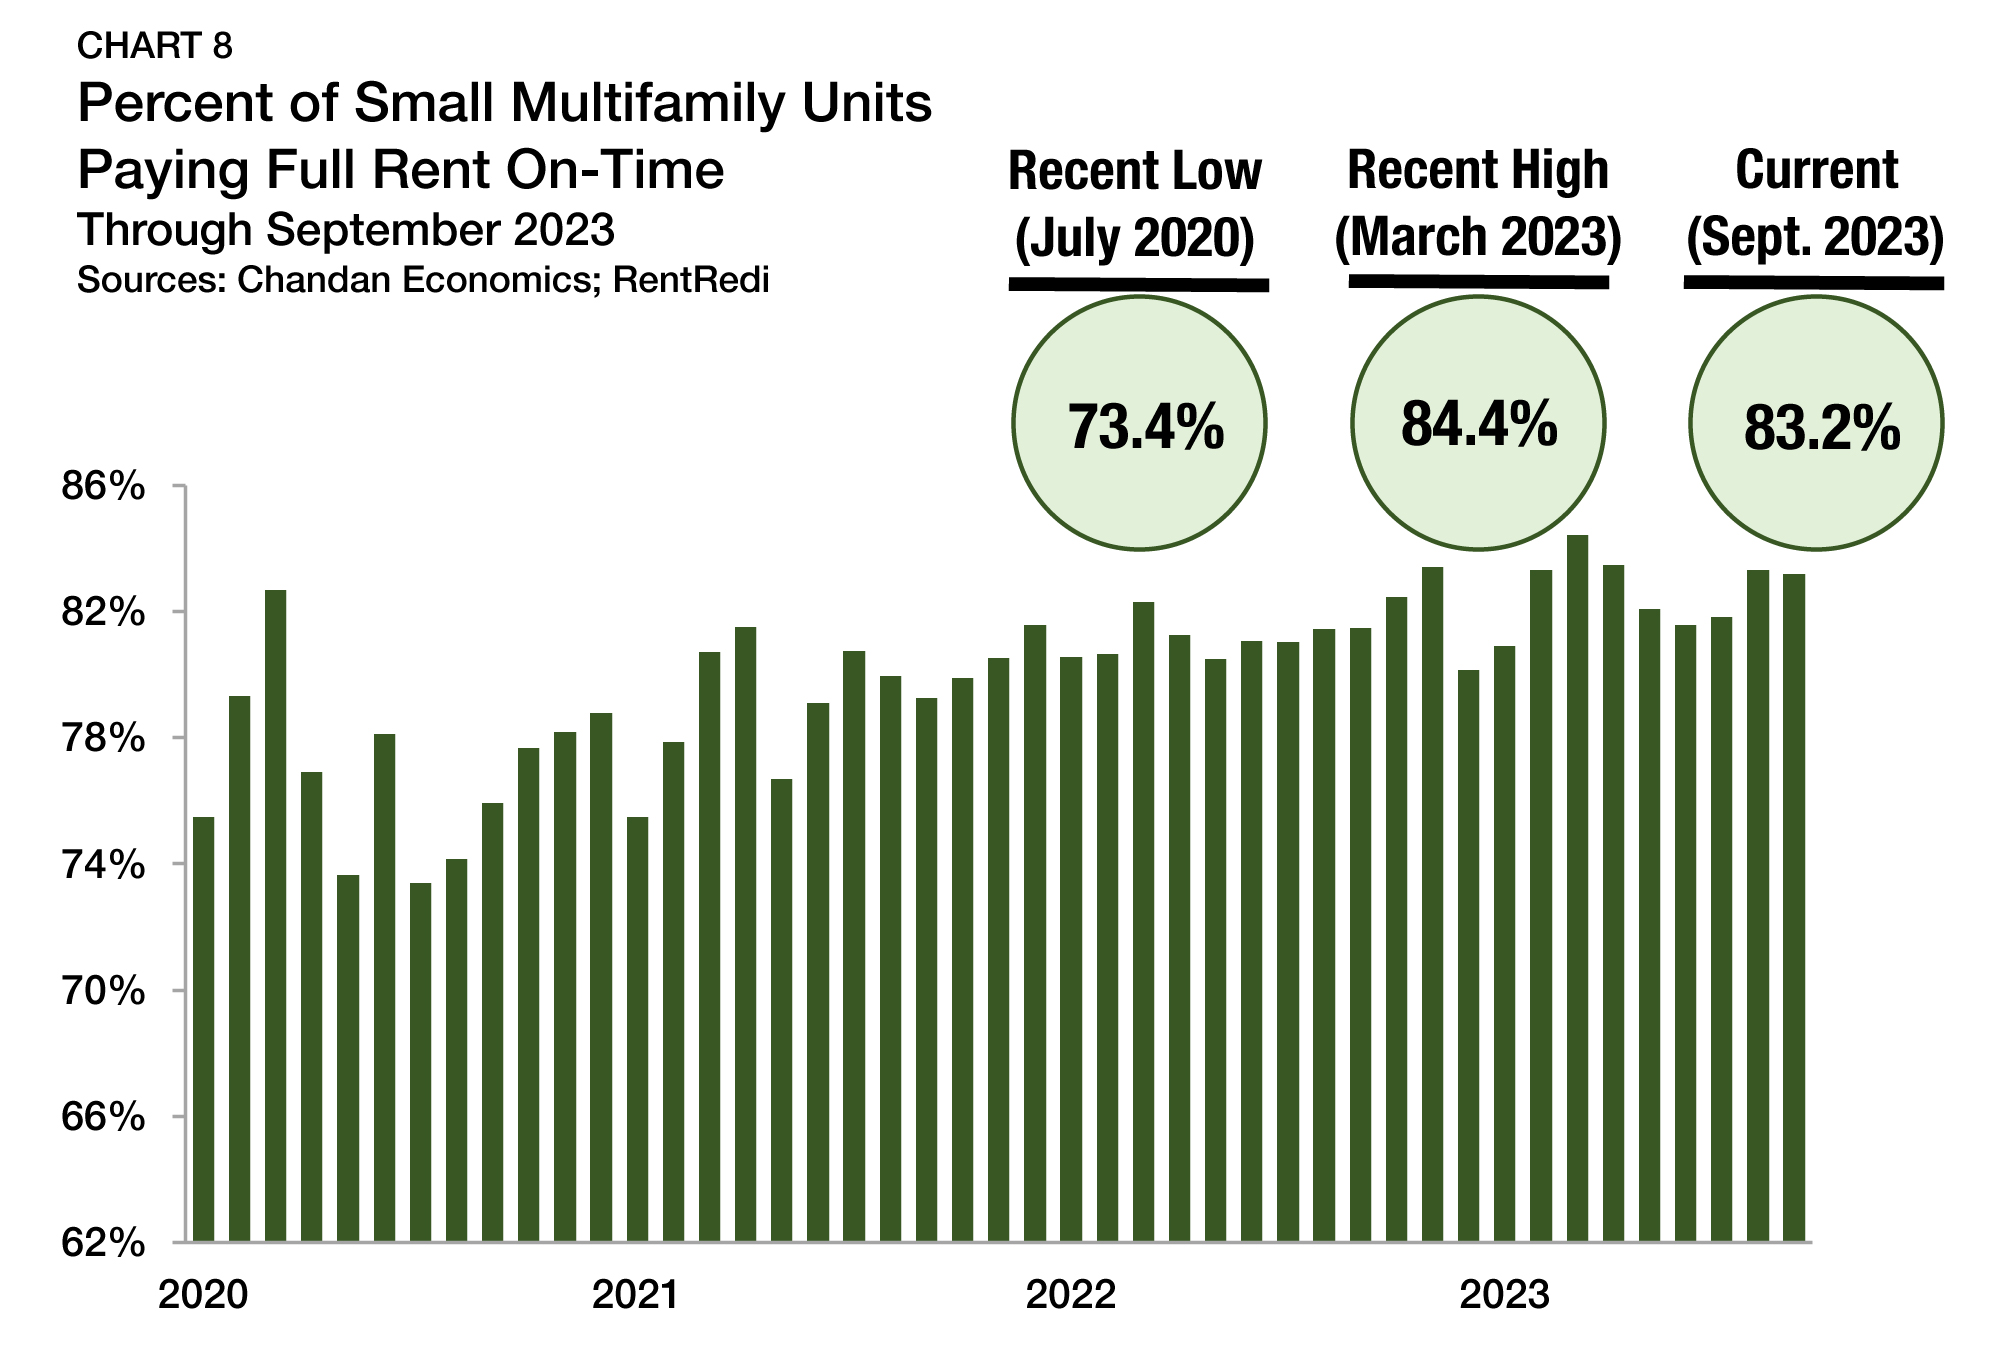
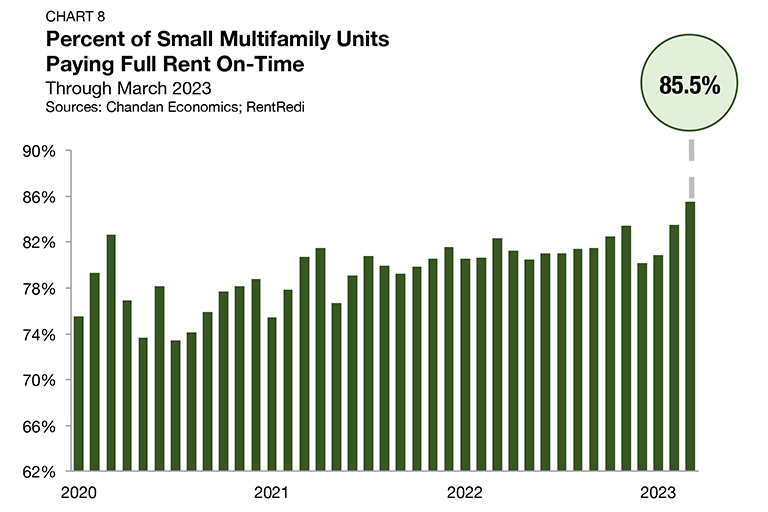
Occupancy rates within small multifamily properties that received financing during the third quarter averaged 97.5% (Chart 8). After occupancy rates slid through 2023 and into early 2024, there was an encouraging turnaround over the past two quarters, as occupancy rates jumped an average of 87 bps between the first and third quarters of the year.
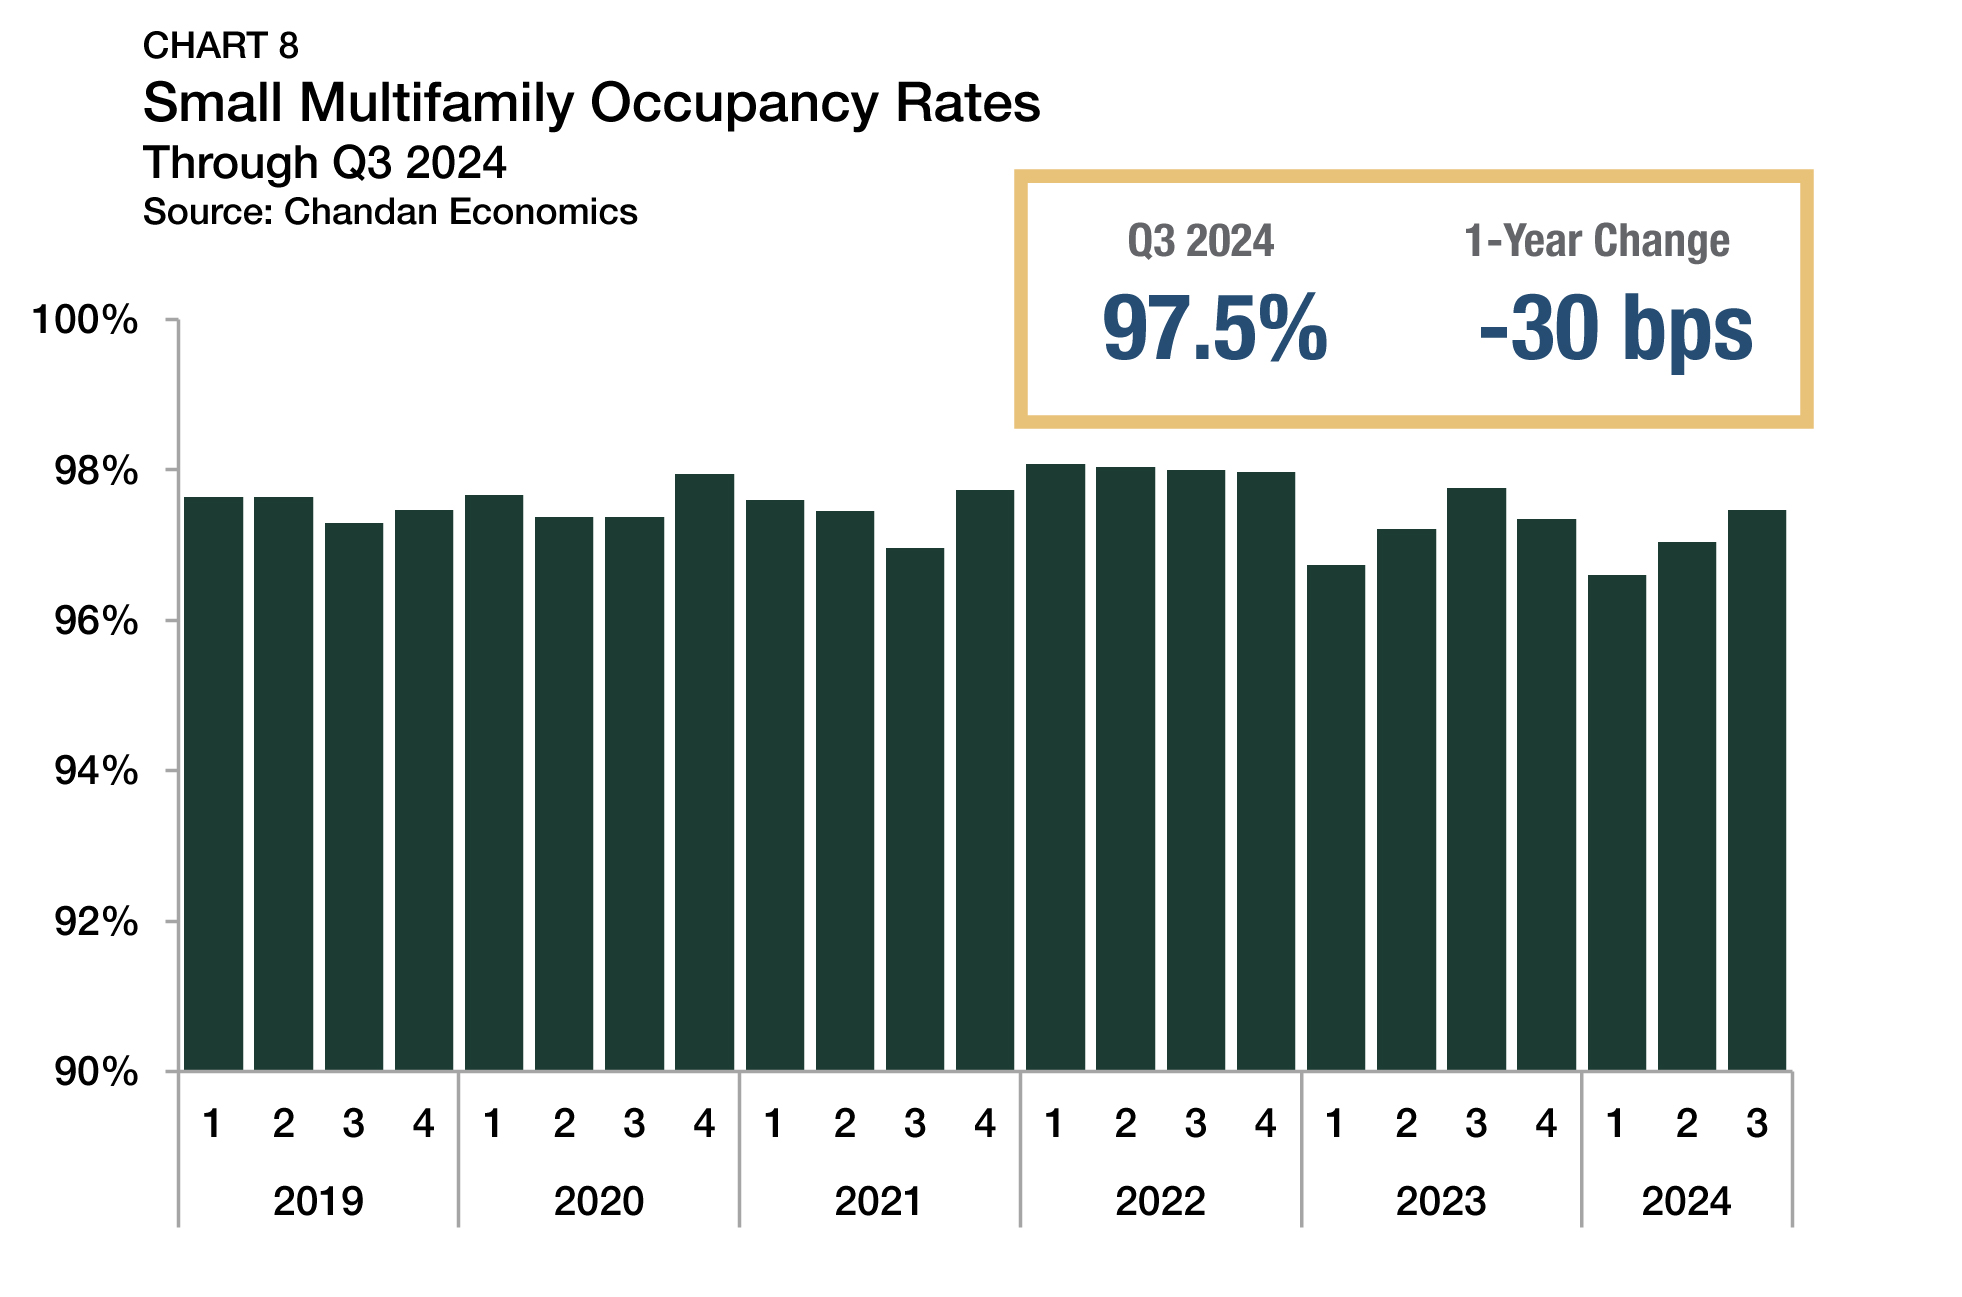
Small multifamily occupancy rates routinely outperform the rest of the multifamily sector, tracking about 2% higher than the average set across all multifamily properties, an anomaly that may be due to closer tenant-landlord relationships. According to a recent report by the Terner Center for Housing Innovation at UC Berkeley, a majority of small multifamily property owners reported that at least half of their rental units were being leased at below-market-rate rents, primarily as a strategy to retain quality tenants.
Leverage & Debt Yields
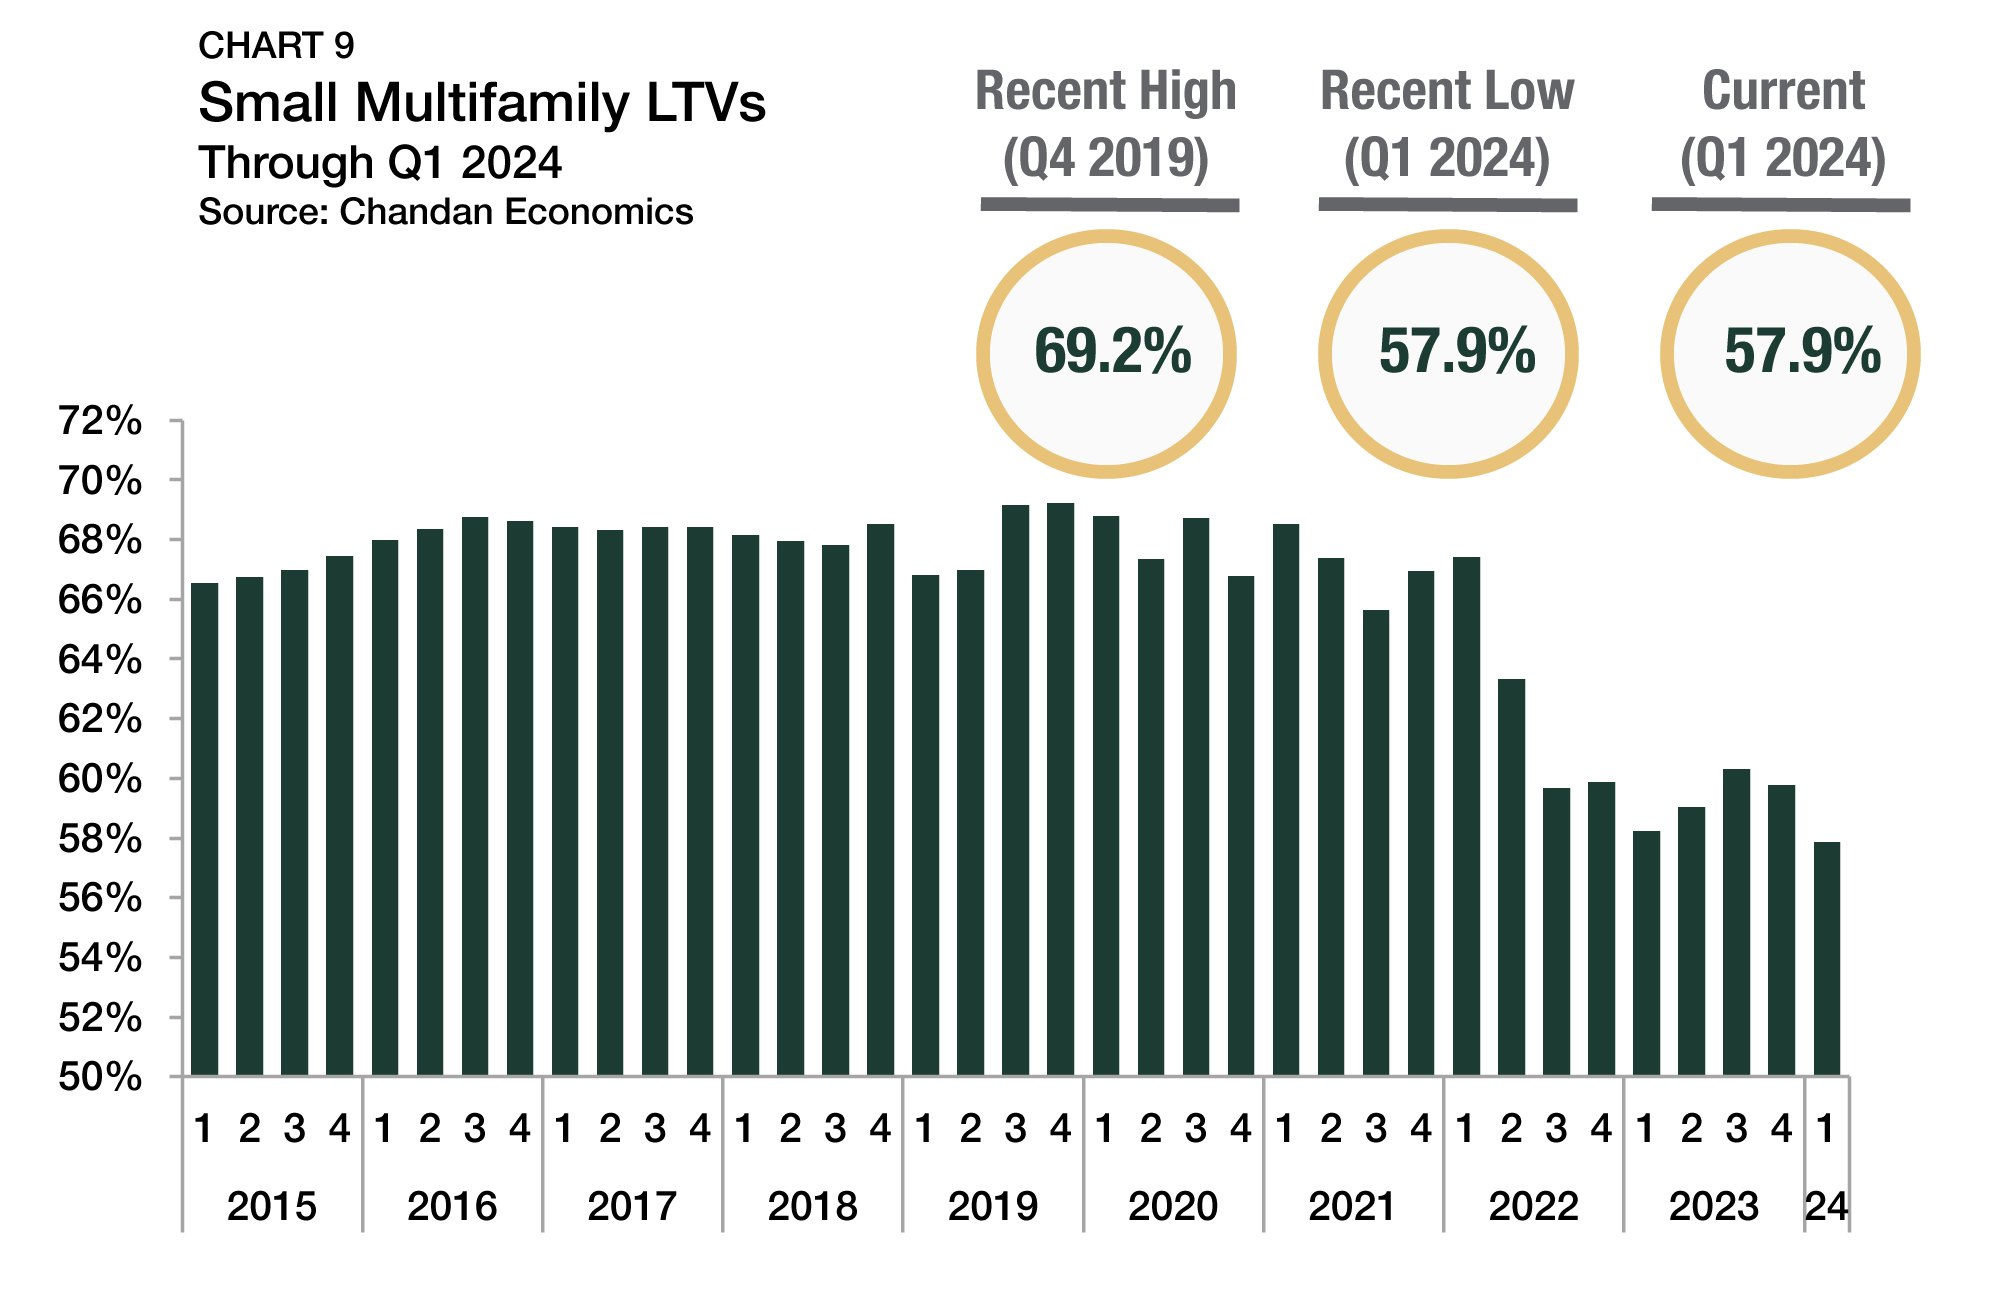
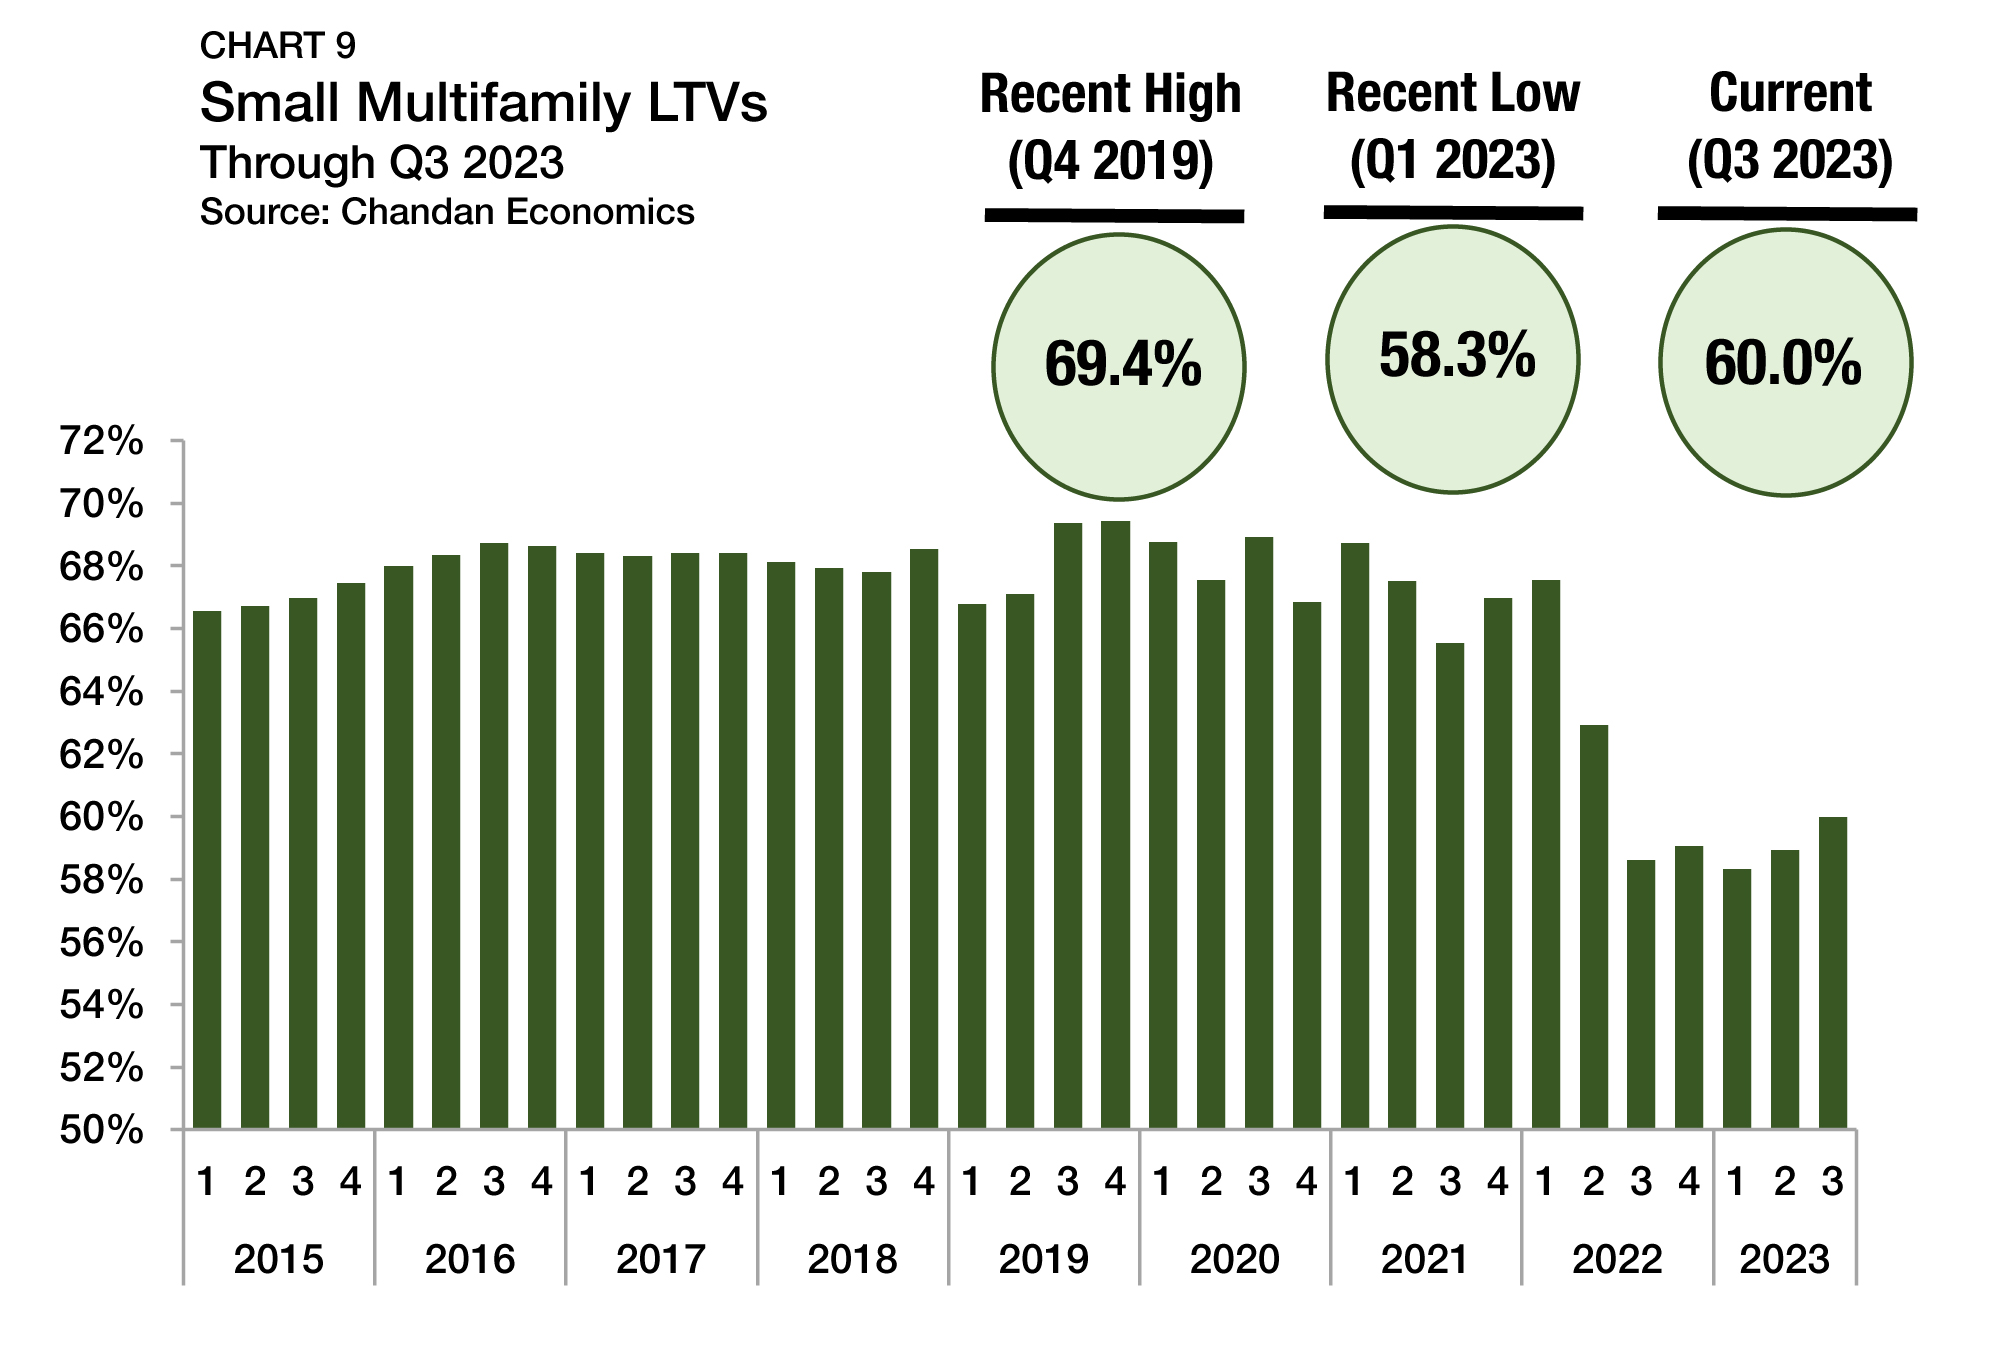
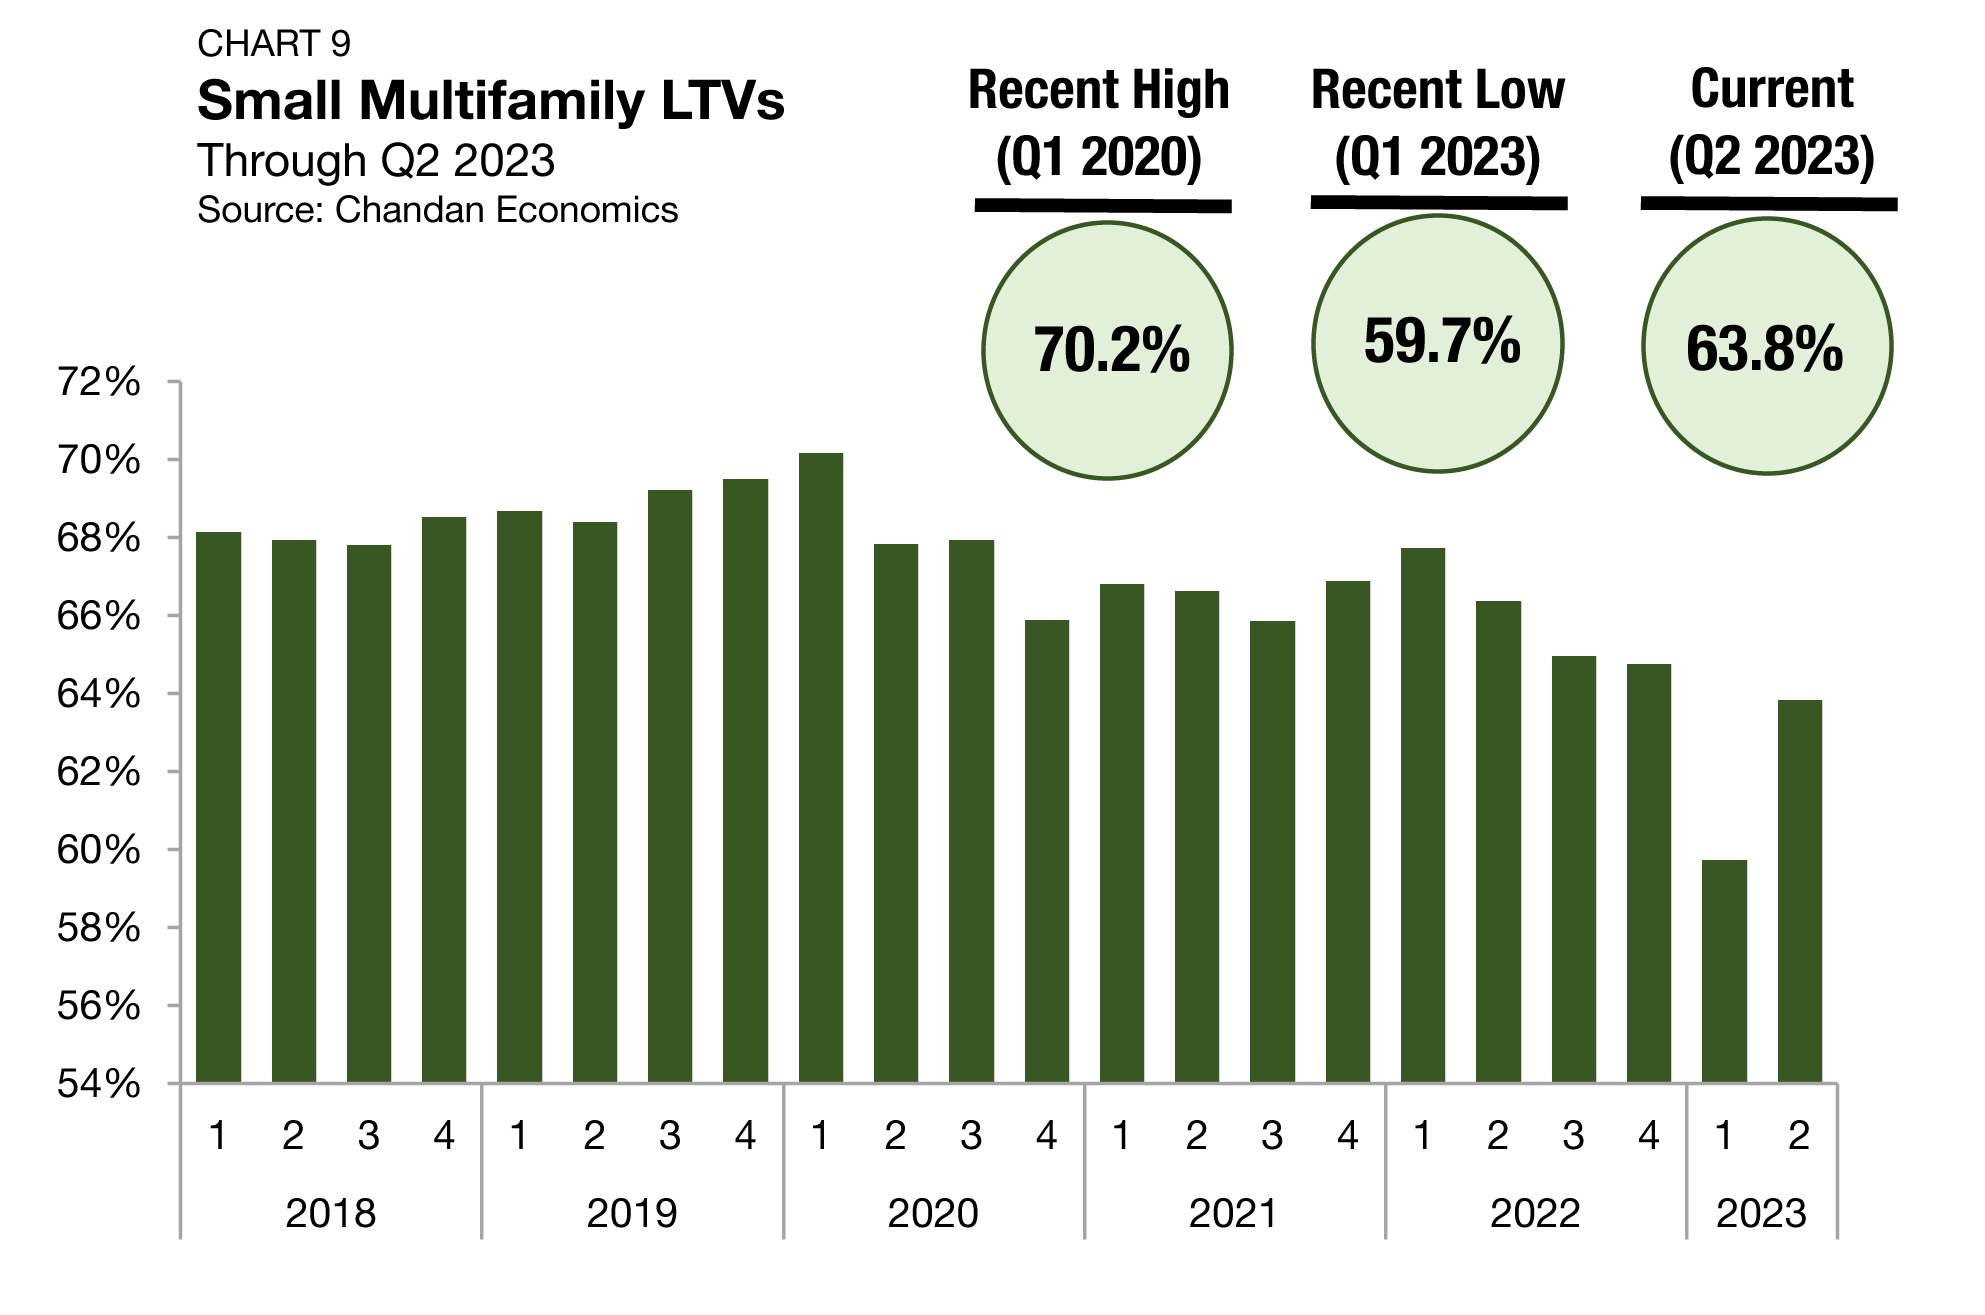
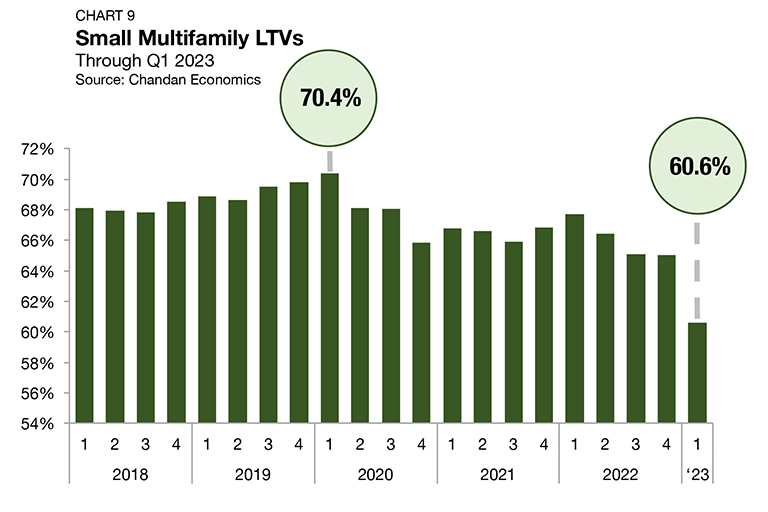
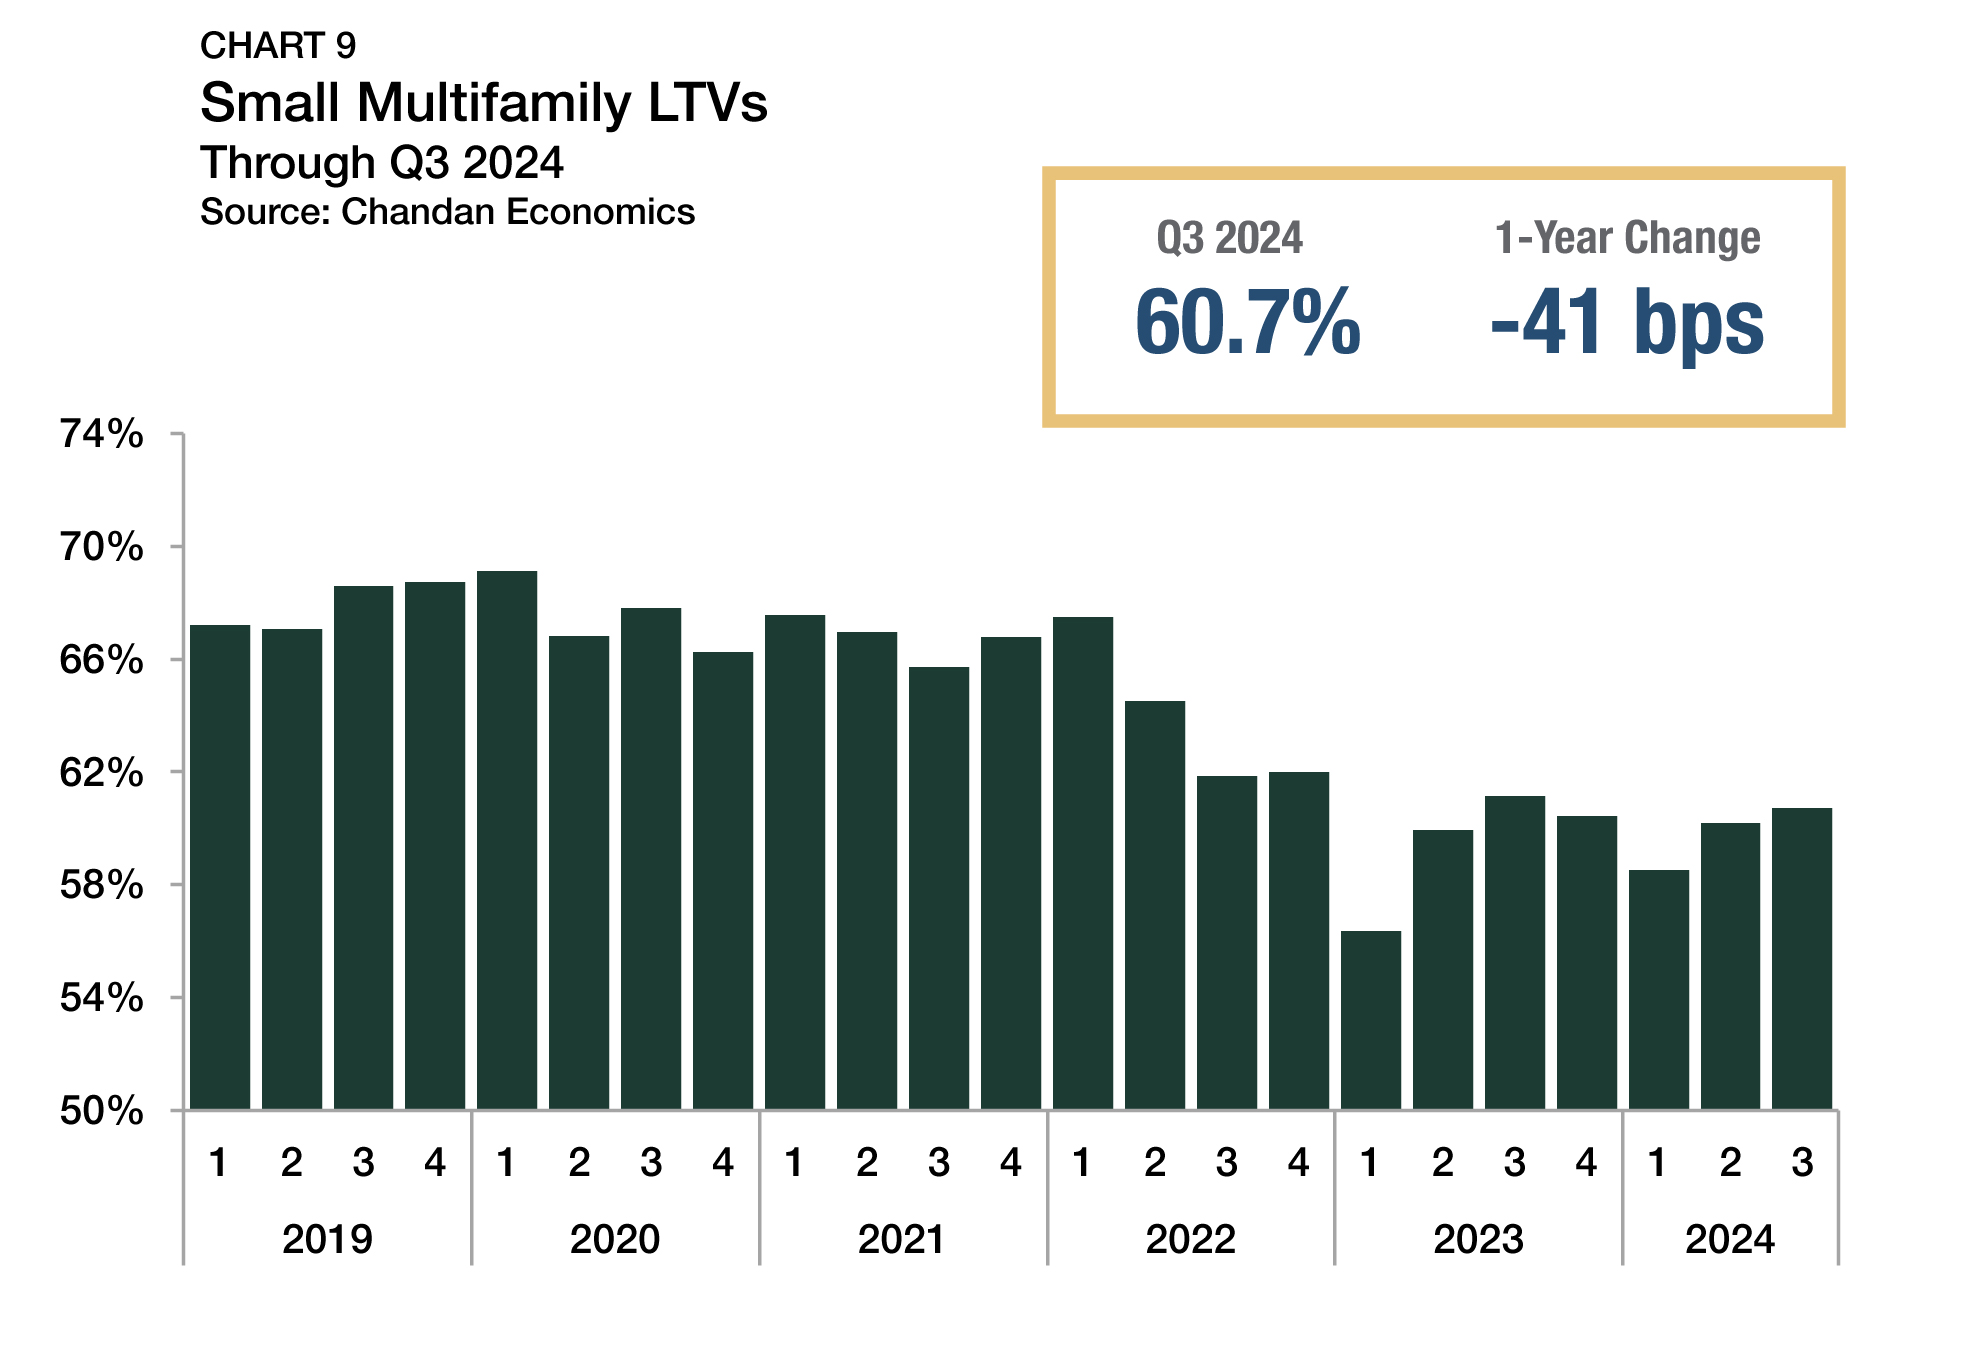
While debt underwriting standards remain tight, there was improvement in the third quarter, with loan-to-value ratios (LTVs) rising and debt yields falling. LTVs increased by 54 bps from the second quarter, settling at 60.7% (Chart 9). The third quarter’s movement followed an increase of 167 bps in the previous quarter. While small multifamily LTVs remain down by 841 bps from a peak in early 2022, they are up 437 bps from their 2023 low point.
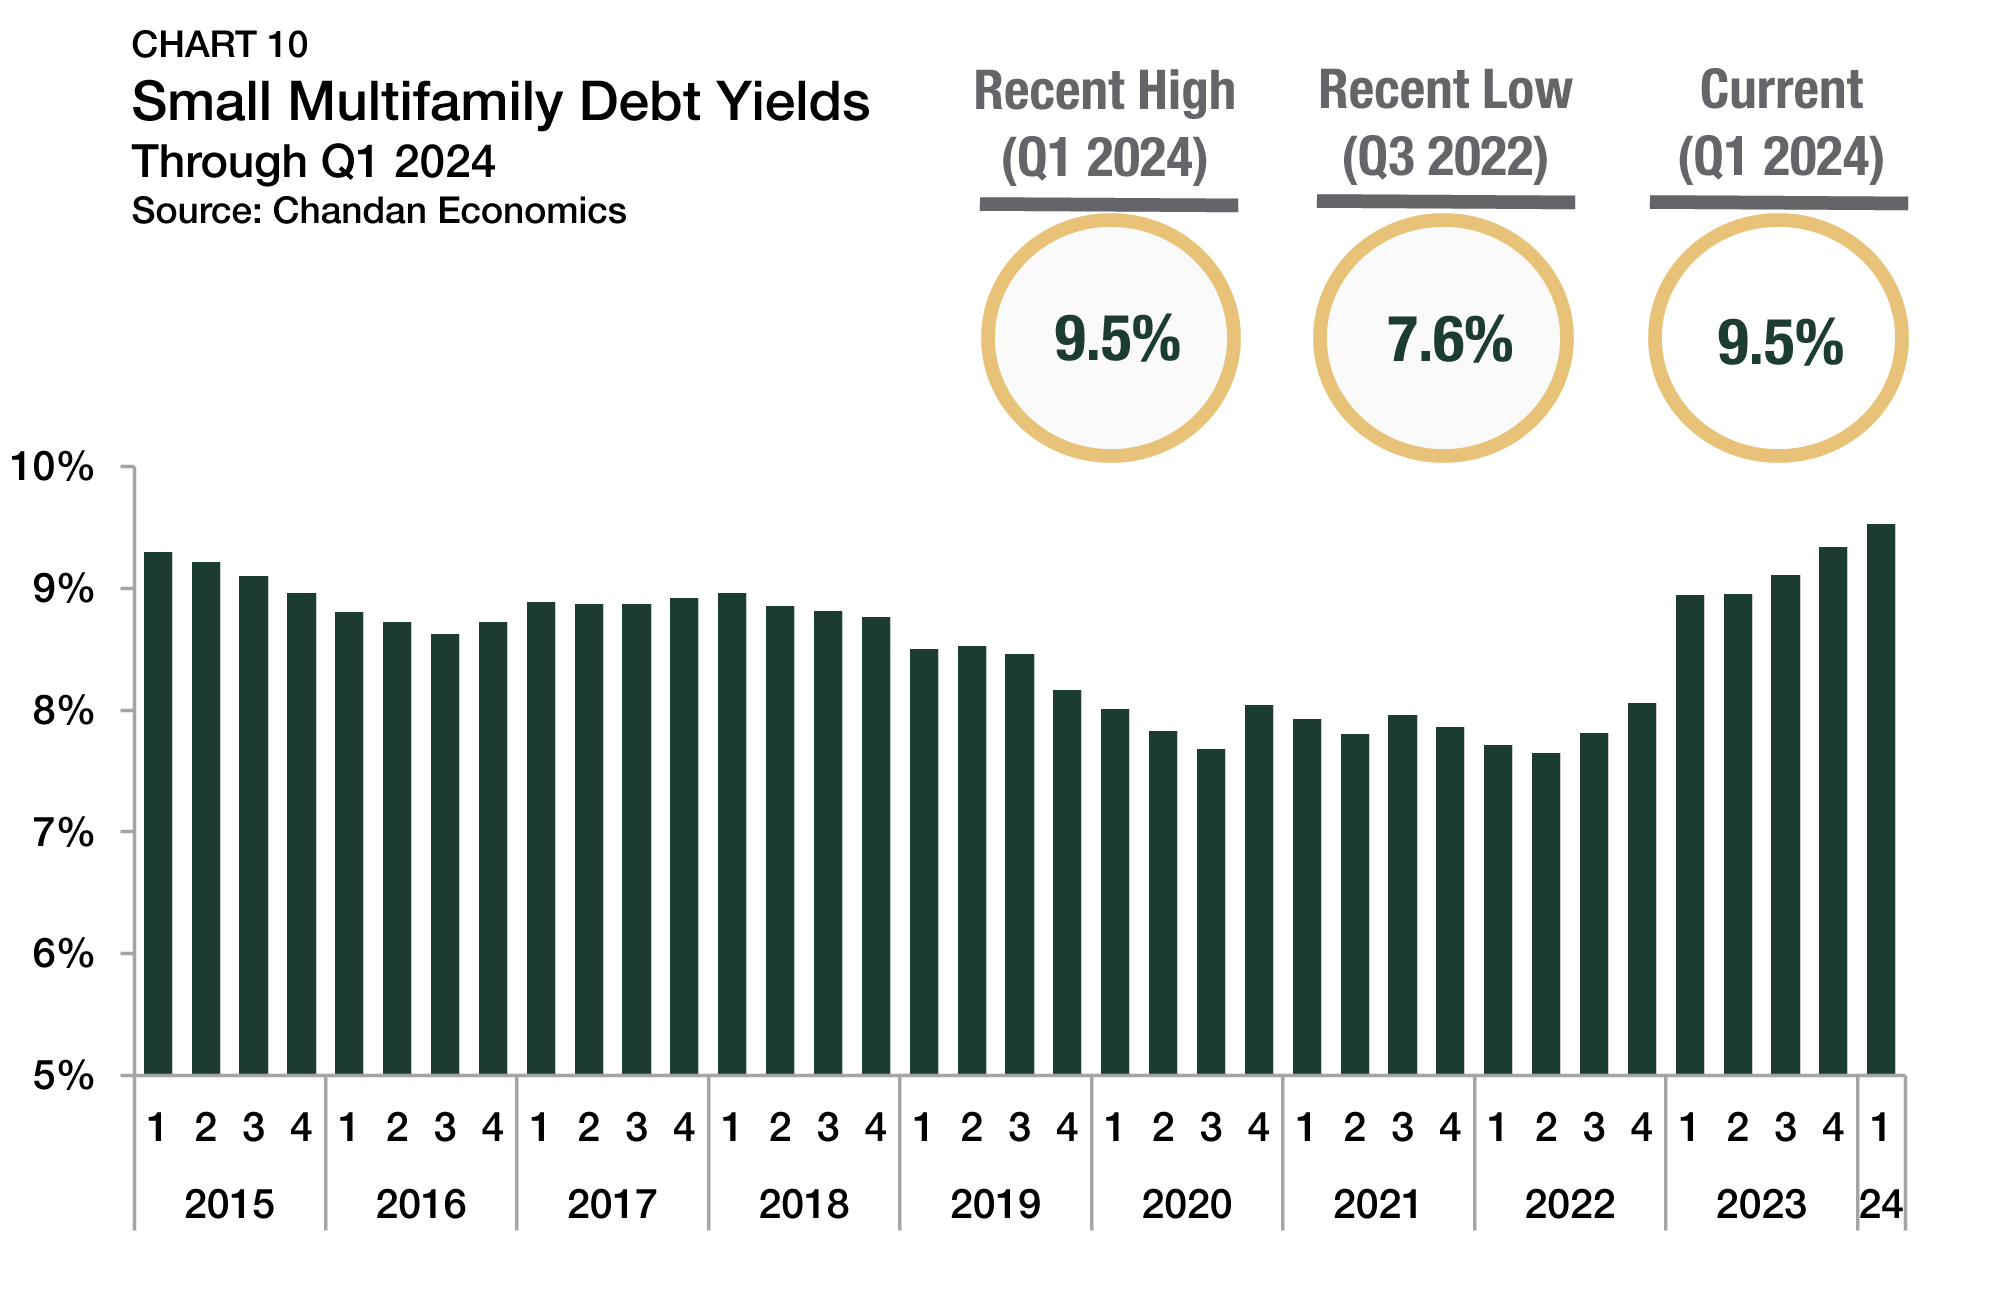
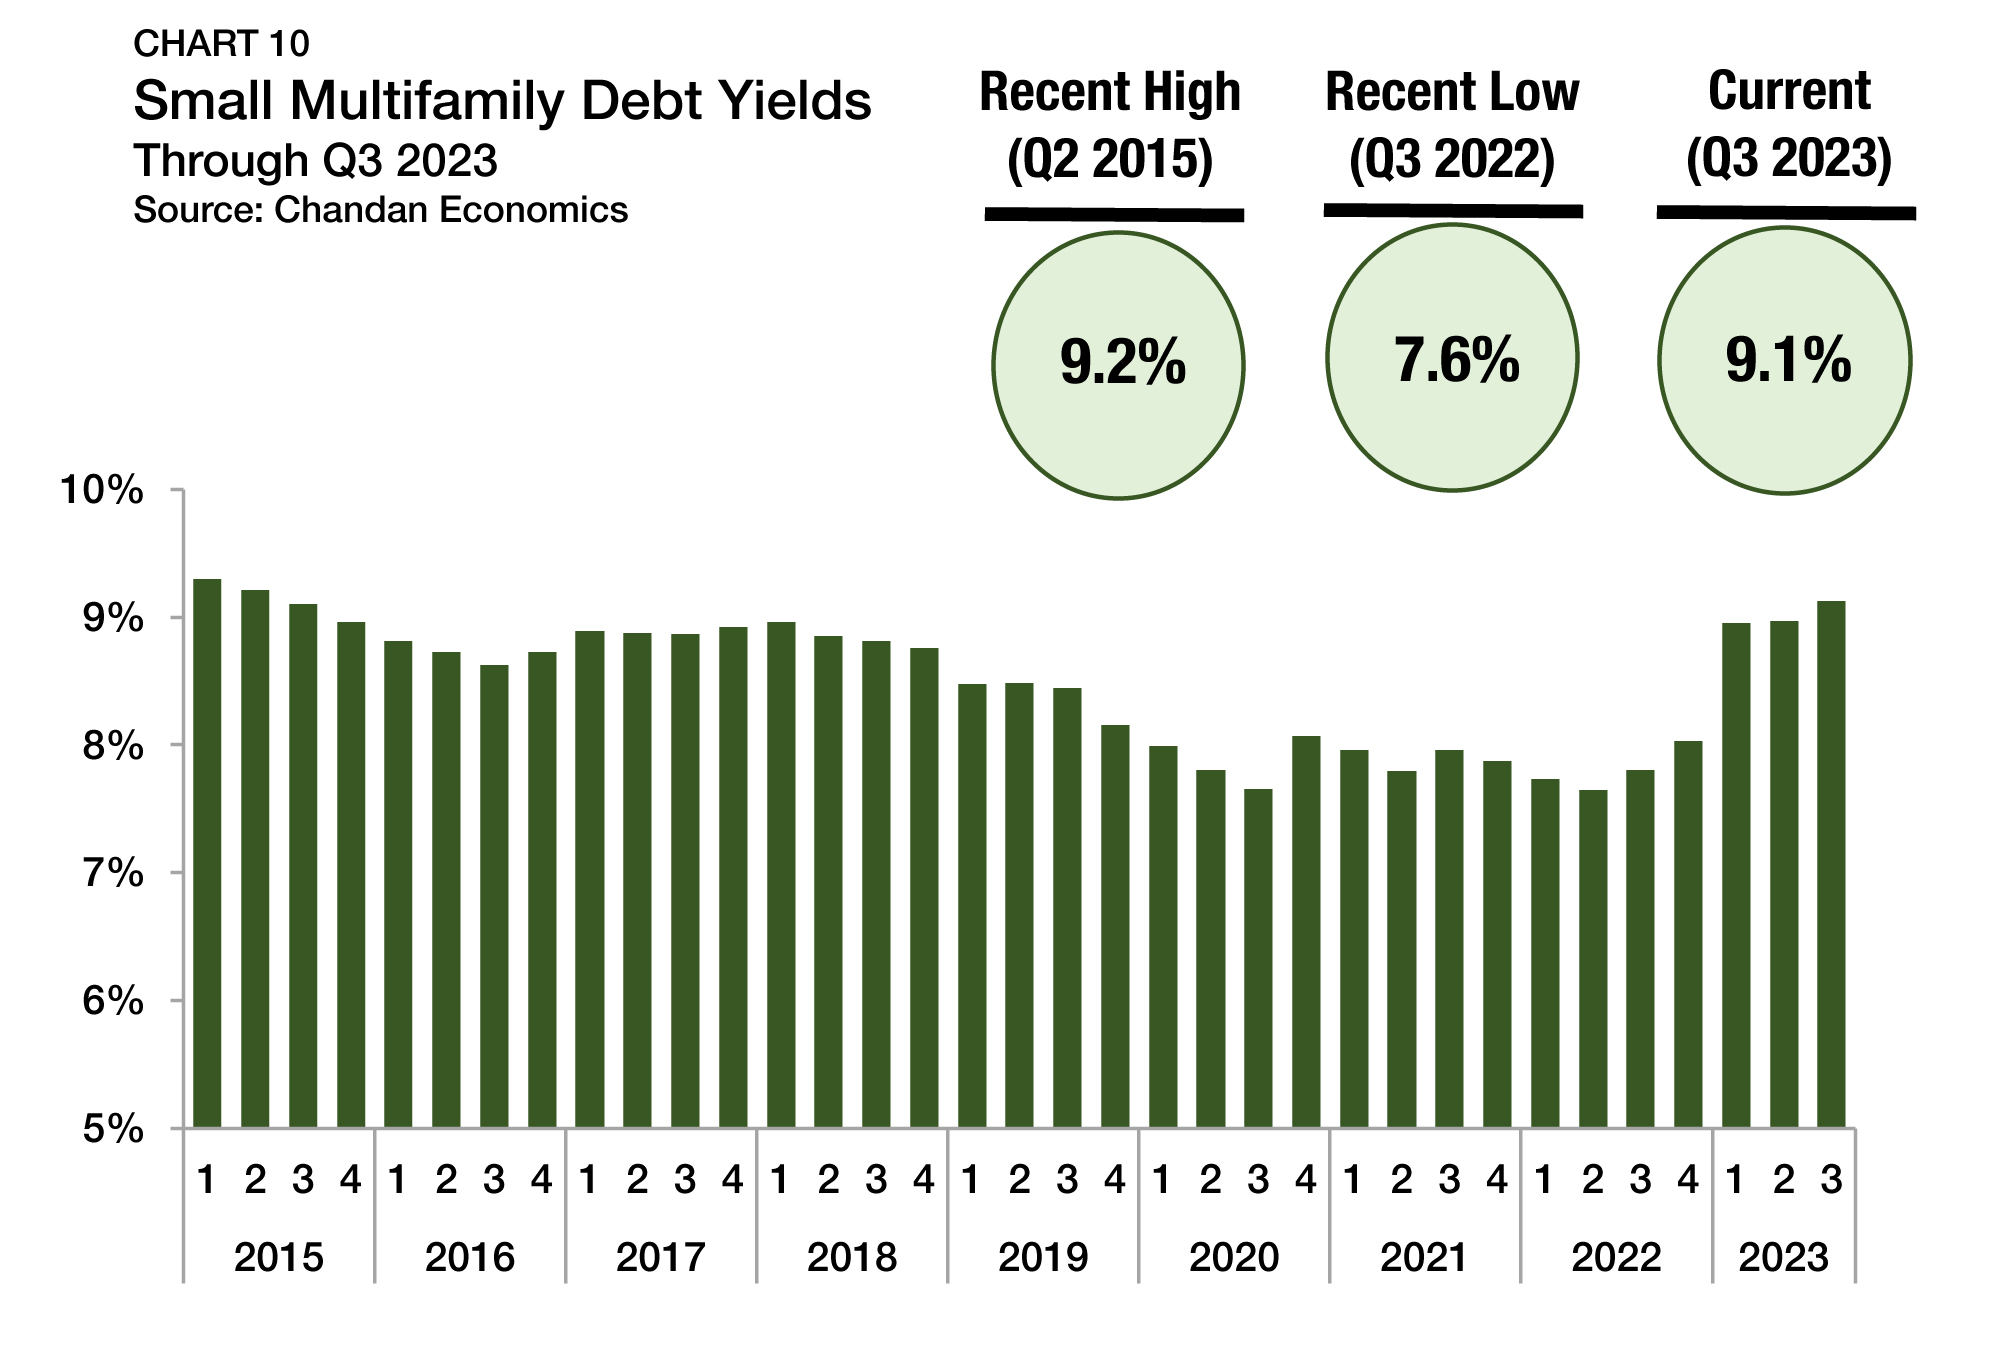
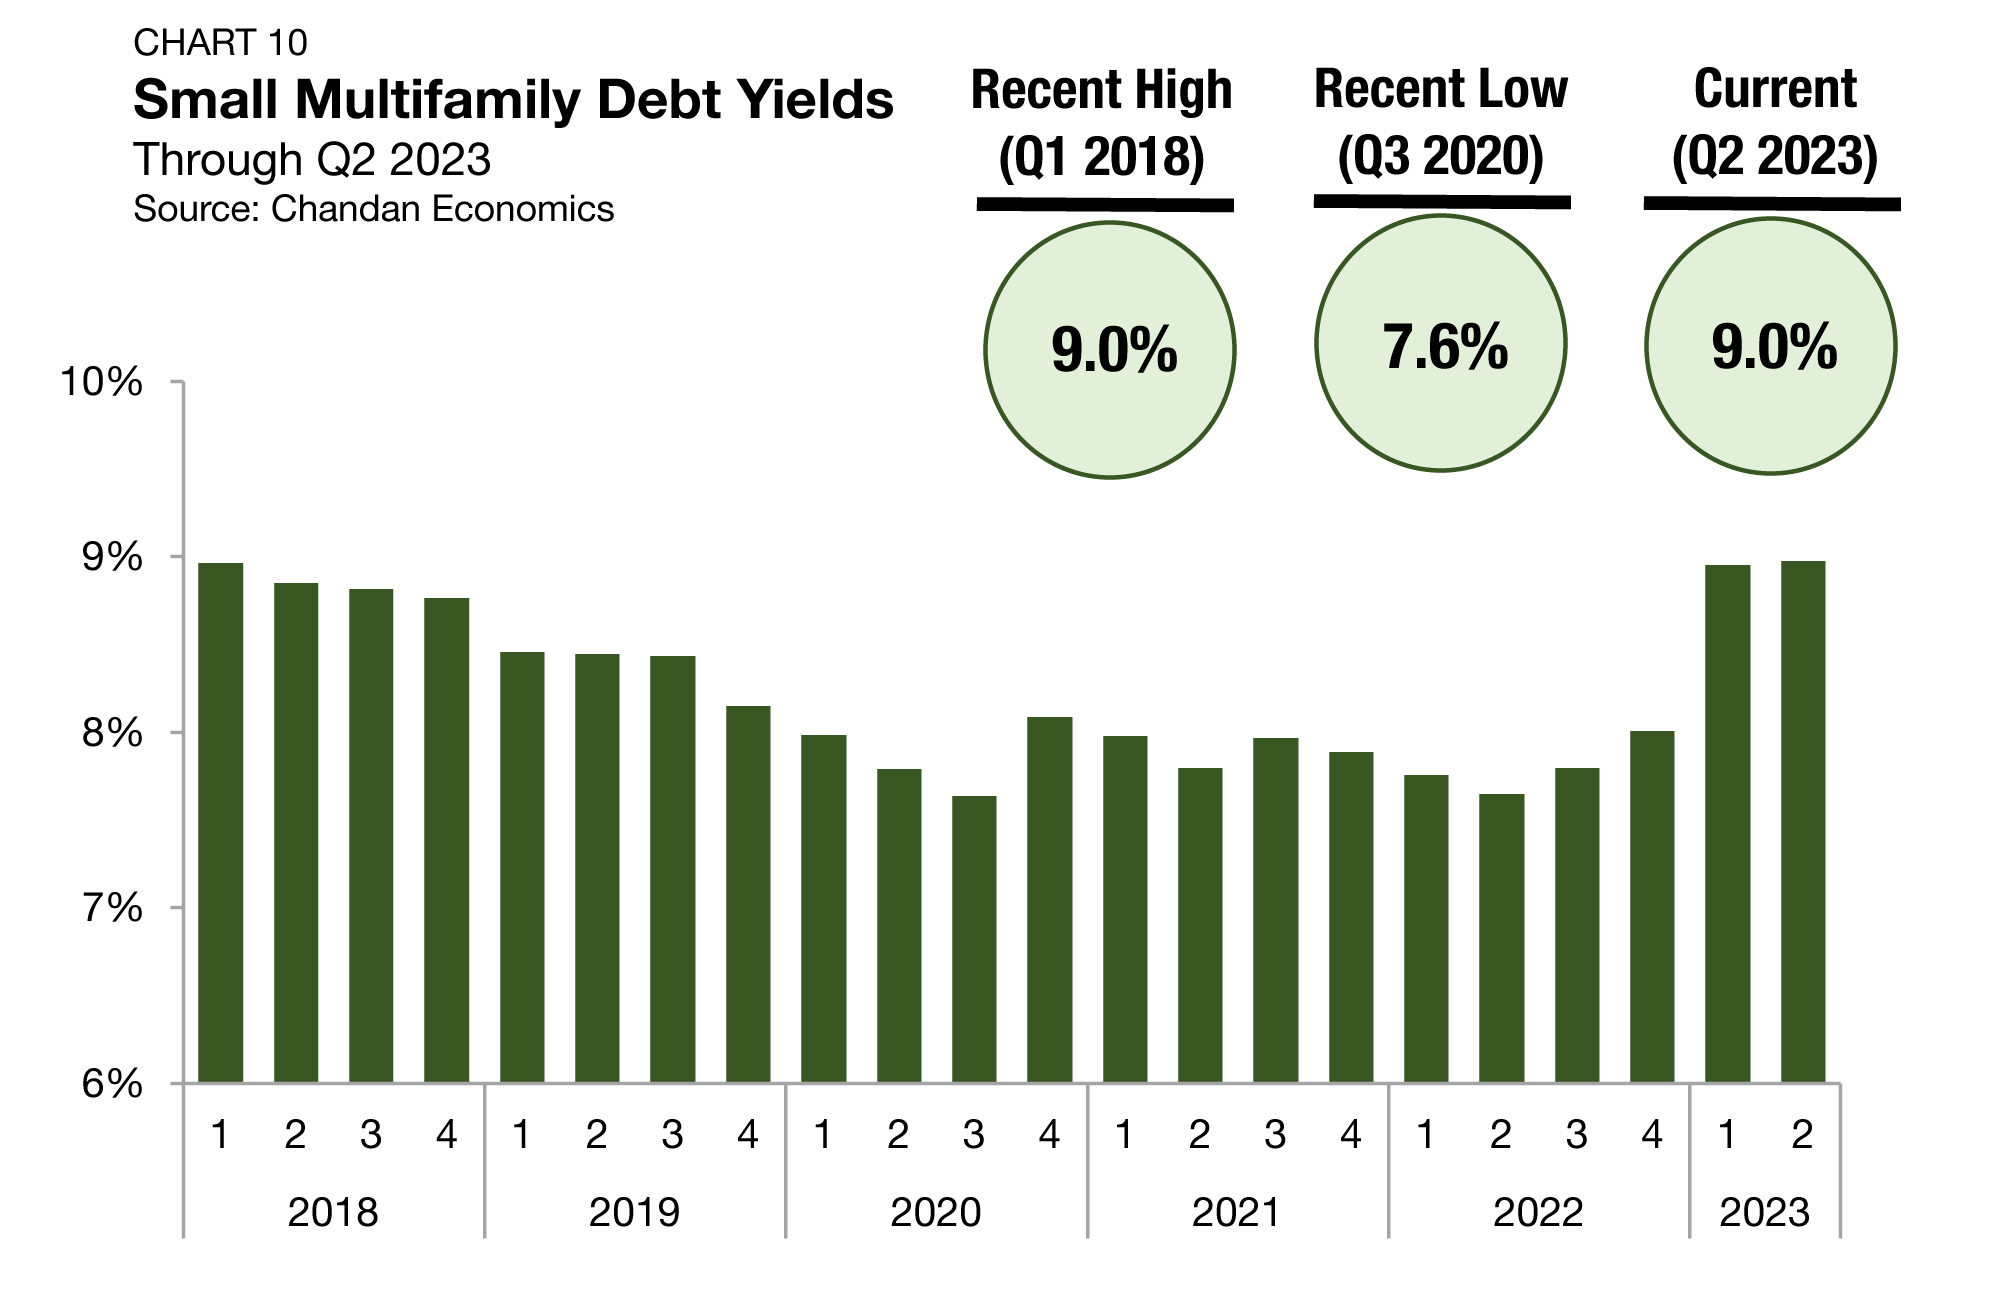
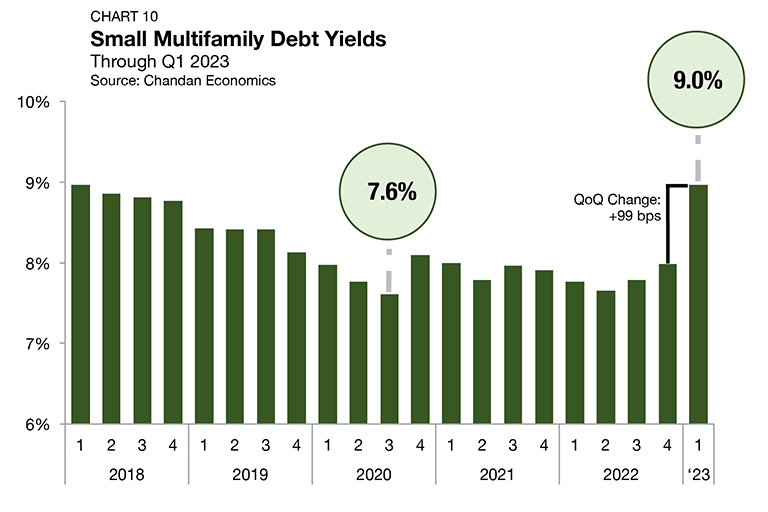
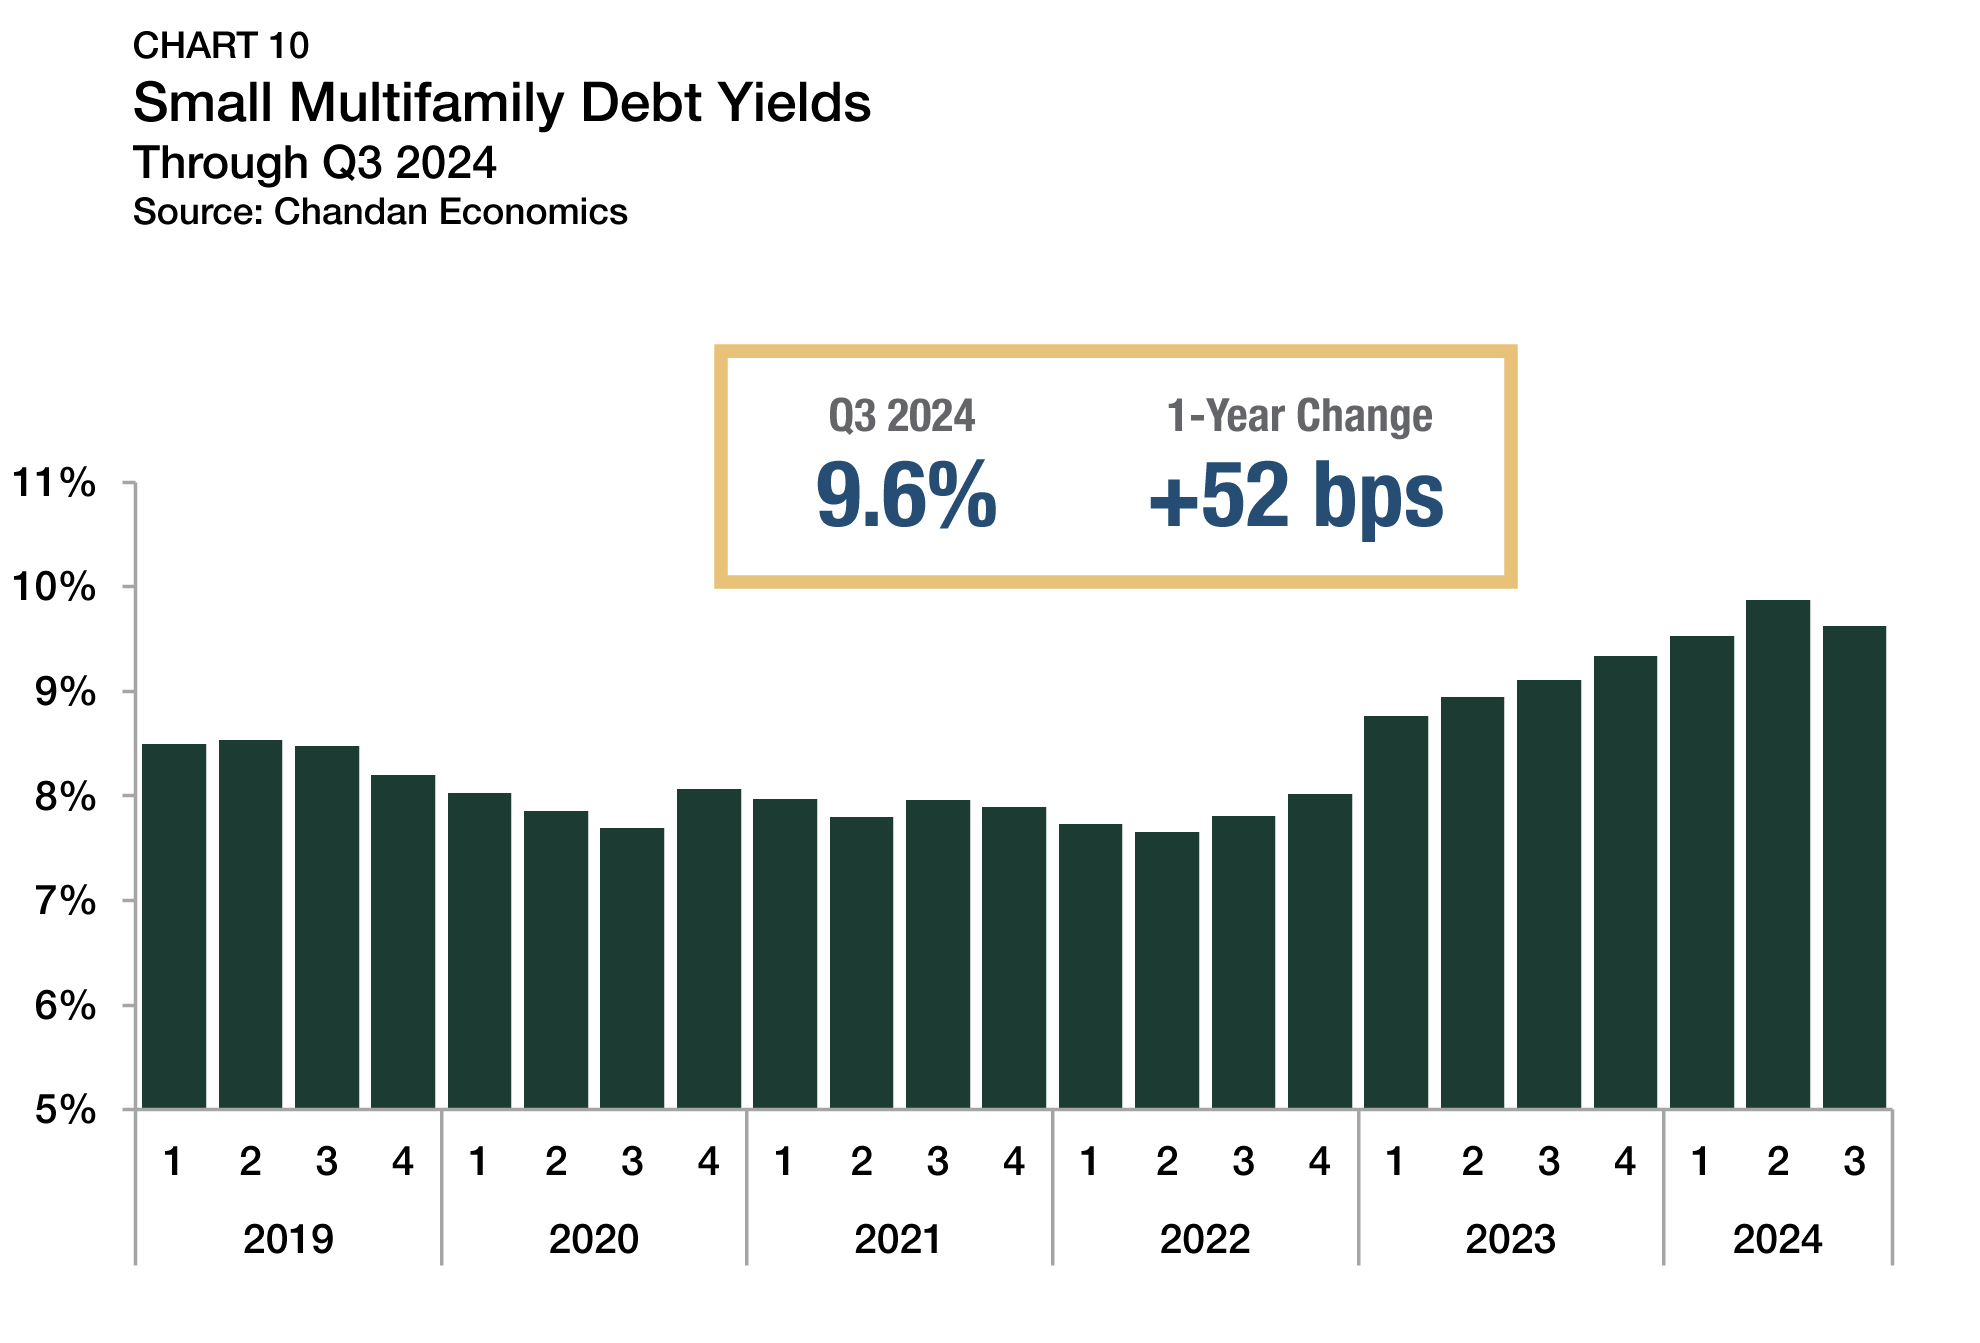
Average debt yields for small multifamily loans fell for the first time in two years during the third quarter of 2024, sliding by 25 bps to settle at 9.6% (Chart 10). The inverse of debt yields, debt per dollar of net operating income (NOI) ended an eight-quarter-streak of declines in the third quarter of 2024. Small multifamily borrowers secured an average of $10.39 in new debt for every $1.00 of property NOI, up $0.27 from the previous quarter.
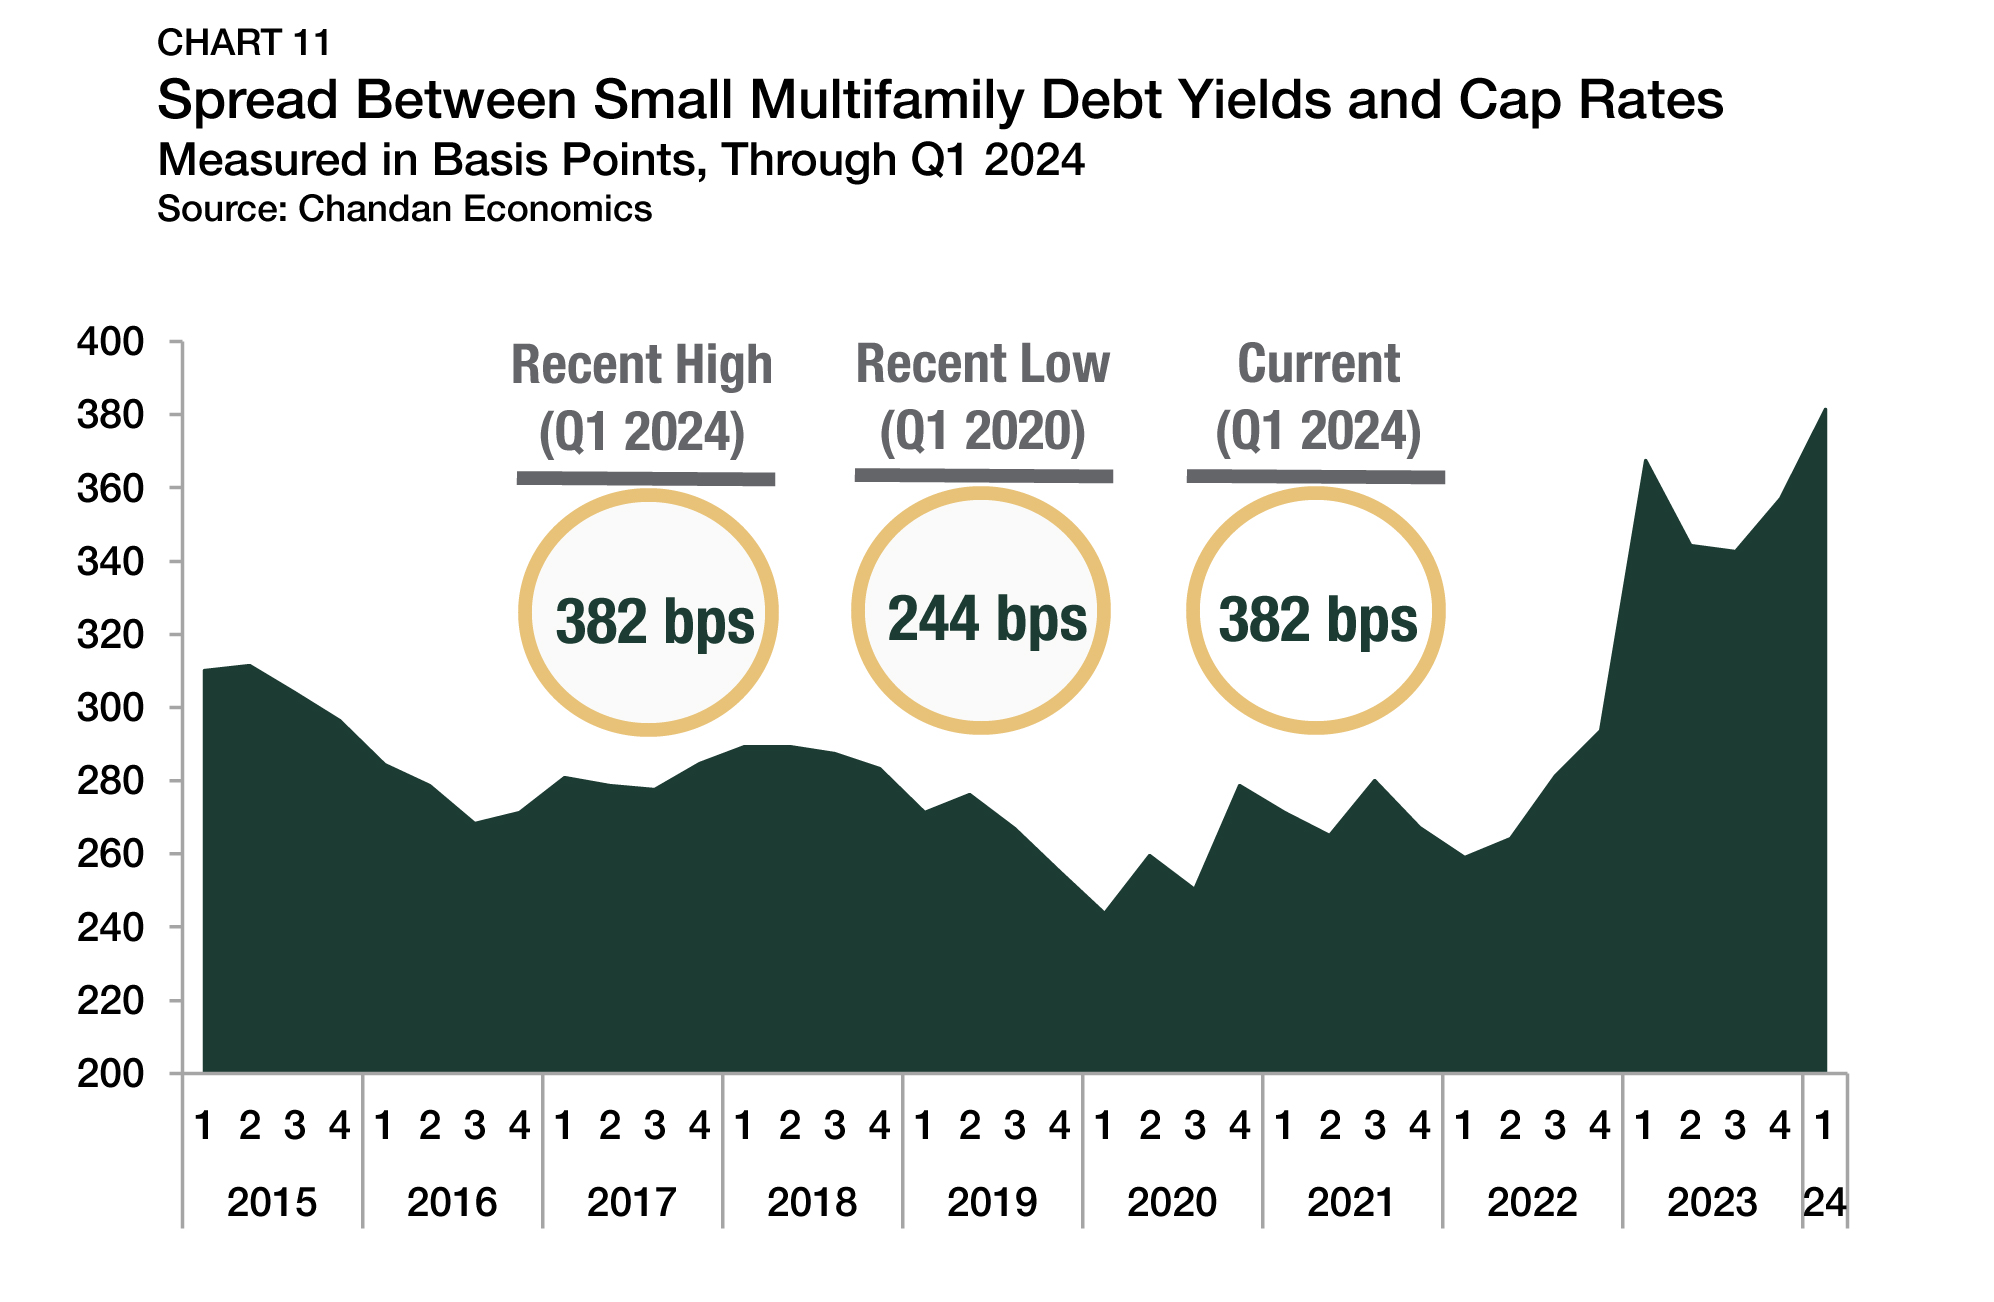
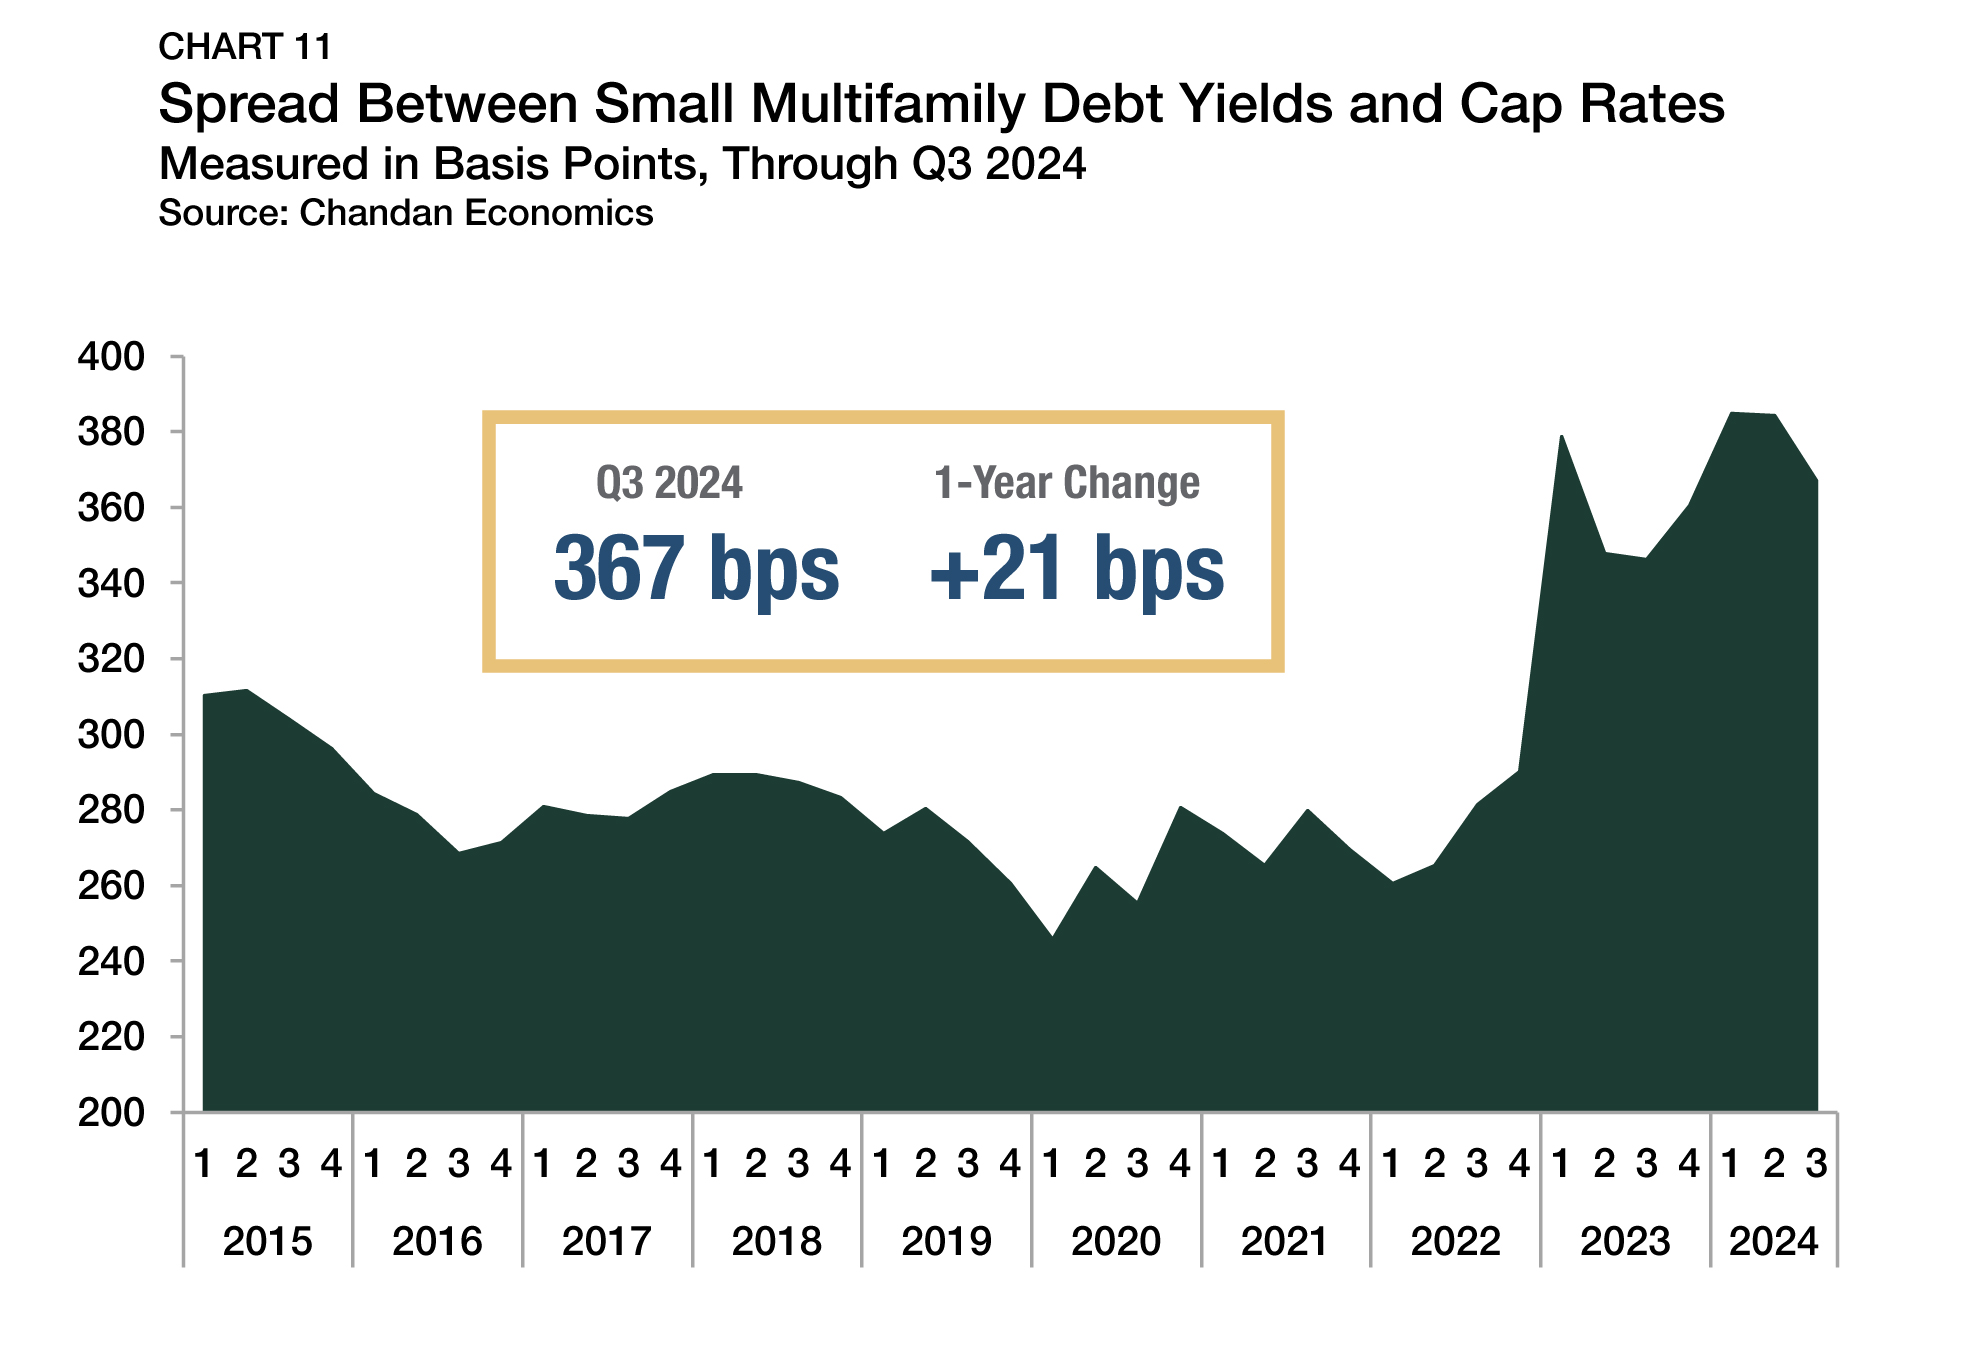
While cap rates and debt yields both fell during the third quarter, debt yields dipped more substantially than cap rates. As a result, the spread between debt yields and cap rates declined to 367 bps (Chart 11). Between 2015 and 2019, the spread between debt yields and cap rates averaged 284 bps. Spreads have remained elevated since then, highlighting that lenders became more risk-averse over the past two years than buyers. However, the spread’s third-quarter decline may signal the start of a reversal of risk aversion among buyers and sellers.
Outlook
So far this year, small multifamily has demonstrated its resiliency and displayed forward momentum in most performance metrics. With interest rates projected to fall considerably, prospects within the subsector are suddenly much brighter. Provided inflation remains under control in the near term, falling capital costs should encourage more interaction between buyers and sellers, accelerating originations activity. No matter how short-term macroeconomic conditions vary, small multifamily will continue to benefit from immense liquidity and strong structural demand, positioning it for continued growth through the end of 2024 and beyond.
For more small multifamily research and insights, visit arbor.com/articles
Disclaimer
This report is intended for general guidance and information purposes only. This report is under no circumstances intended to be used or considered as financial or investment advice, a recommendation or an offer to sell, or a solicitation of any offer to buy any securities or other form of financial asset. Please note that this is not an offer document. The report is not to be considered as investment research or an objective or independent explanation of the matters contained herein and is not prepared in accordance with the regulation regarding investment analysis. The material in the report is obtained from various sources per dating of the report. We have taken reasonable care to ensure that, and to the best of our knowledge, material information contained herein is in accordance with the facts and contains no omission likely to affect its understanding. That said, all content is provided herein “as is” and neither Arbor Realty Trust, Inc. or Chandan Economics, LLC (“the Companies”) nor their affiliated or related entities, nor any person involved in the creation, production and distribution of the content make any warranties, express or implied. The Companies do not make any representations or warranties, express or implied, as to the reliability, usefulness, completeness, accuracy, currency nor represent that use of any information provided herein would not infringe on other third-party rights. The Companies shall not be liable for any direct, indirect or consequential damages to the reader or a third party arising from the use of the information contained herein. There may have been changes in matters which affect the content contained herein and/or the Companies subsequent to the date of this report. Neither the issue nor delivery of this report shall under any circumstance create any implication that the information contained herein is correct as of any time subsequent to the date hereof or that the affairs of the Companies have not since changed. The Companies do not intend, and do not assume any obligation to update or correct the information included in this report. The contents of this report are not to be construed as legal, business, investment or tax advice. Each recipient should consult with its legal, business, investment and tax advisors as to legal, business, investment and tax advice. The information contained herein may be subject to changes without prior notice. This report is only intended for the recipients, and should not be copied or otherwise distributed, in whole or in part, to any other person.