Single-Family Rental Investment Trends Report Q4 2022
SFR Construction Captures Record Market Share as Cap Rates Rise
Key Findings
- Build-to-Rent (BTR) accounts for 6.3% of new single-family construction starts in the past year, a new record high.
- Single-Family Rental (SFR) rent growth on new leases slows sharply as renewal rent pressures maintain their strength.
- Cap rates have started to rise, jumping to 5.6%.
Table of Contents
State of the Market
The SFR sector sits at a crossroads between secular growth and a housing market correction, placing it in uncharted territory.
Across the country, single-family home prices continue to fall. According to the S&P/Case-Shiller U.S. National Home Price Index, prices have fallen an average of 3.6% between June and November 2022. While SFR assets are not immune from downside housing market pressures, there are countercyclical features of the sector that are helping it to withstand the current climate — namely, an influx of rental demand from otherwise would-be buyers. High mortgage interest rates have made buying a home in today’s market more expensive. As a result, Realtor.com reports that renting a home is currently more affordable than buying one in 45 of the 50 largest U.S. markets.
How debt and equity investors are pricing risk in the current interest rate environment continues to shift, with debt yields and cap rates both rising for SFRs. A slowdown in rent gains is well underway, with a reversion to historical patterns of growth appearing likely — especially as occupancy rates continue to hold at healthy levels. If all else remains equal, SFR will maintain exposure to the cyclical disruption brought on by the housing market’s softness and rising interest rates, even though its structural growth outlook remains positive and unchanged.
Performance Metrics
CMBS Issuance
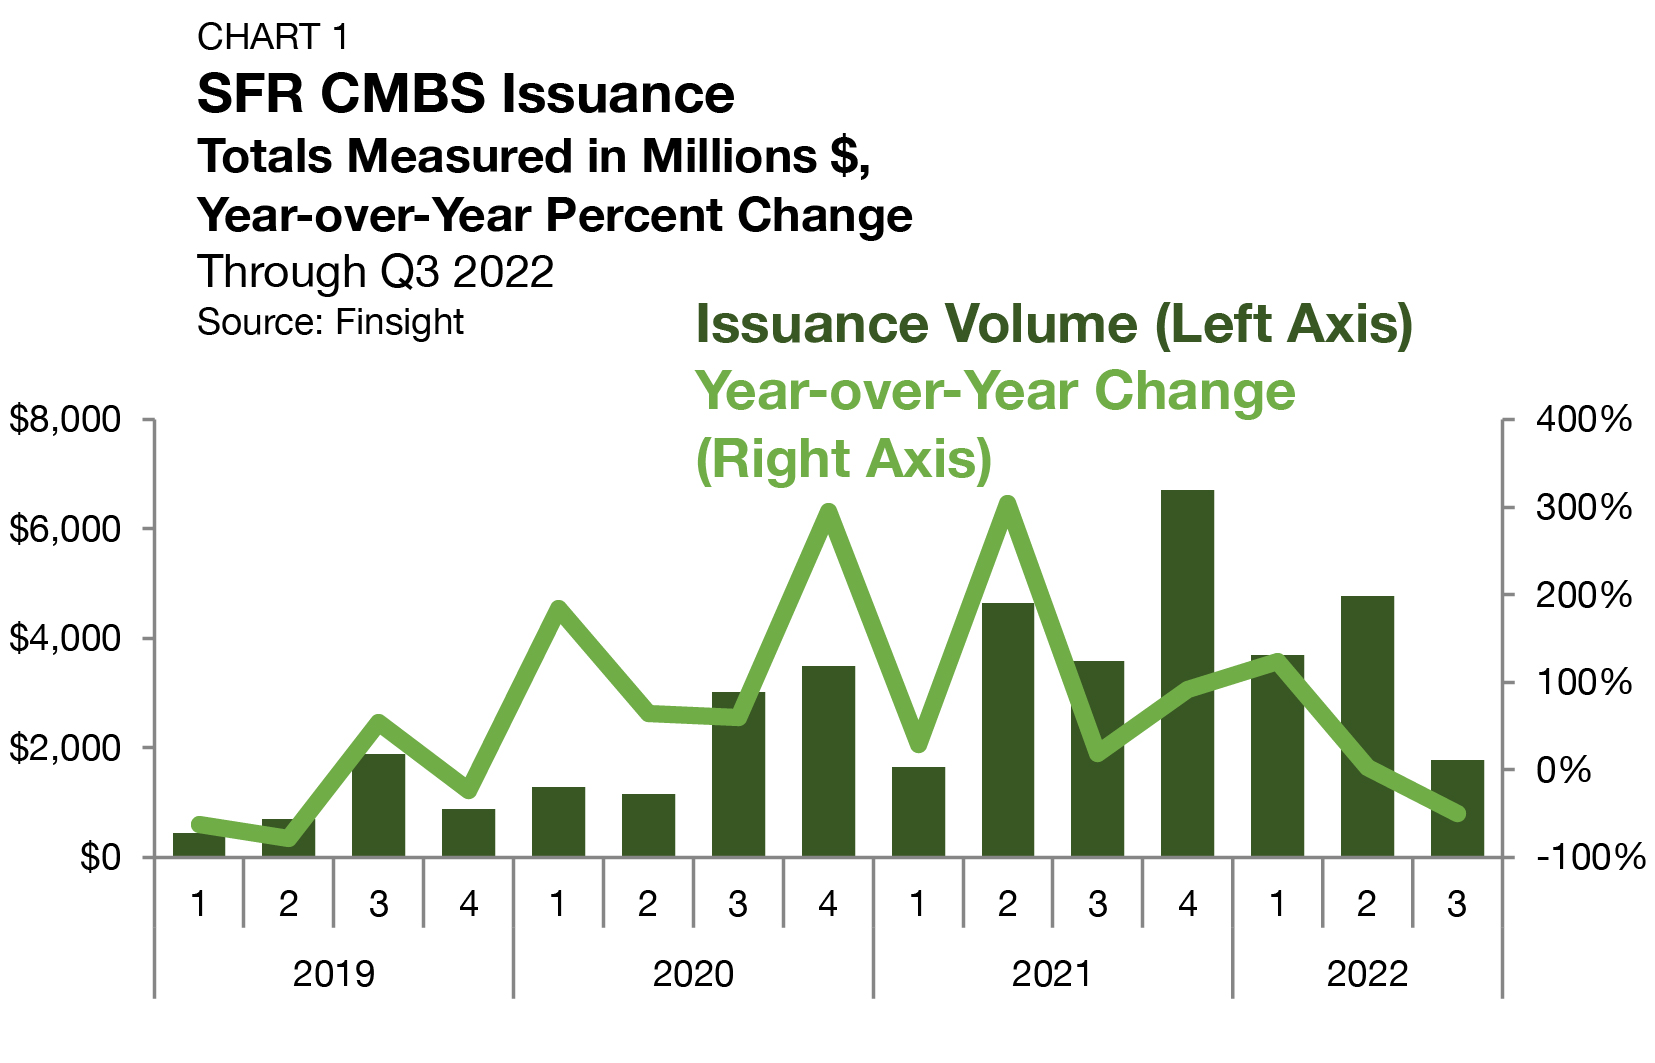
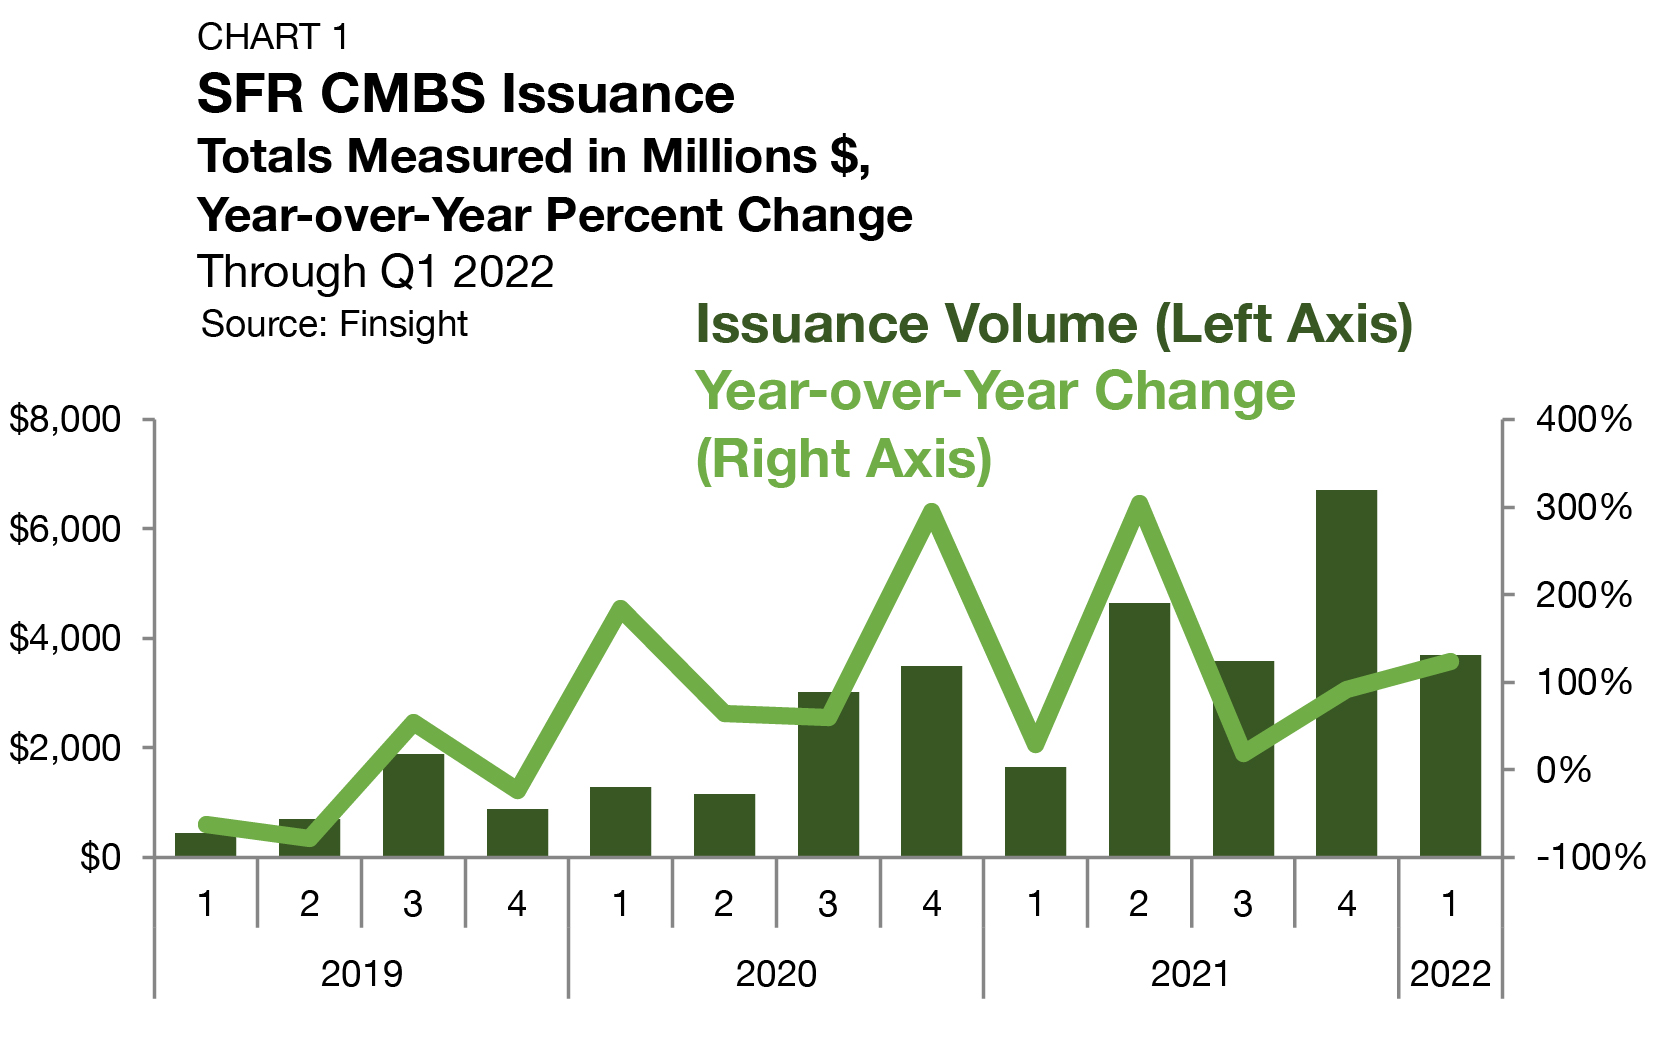
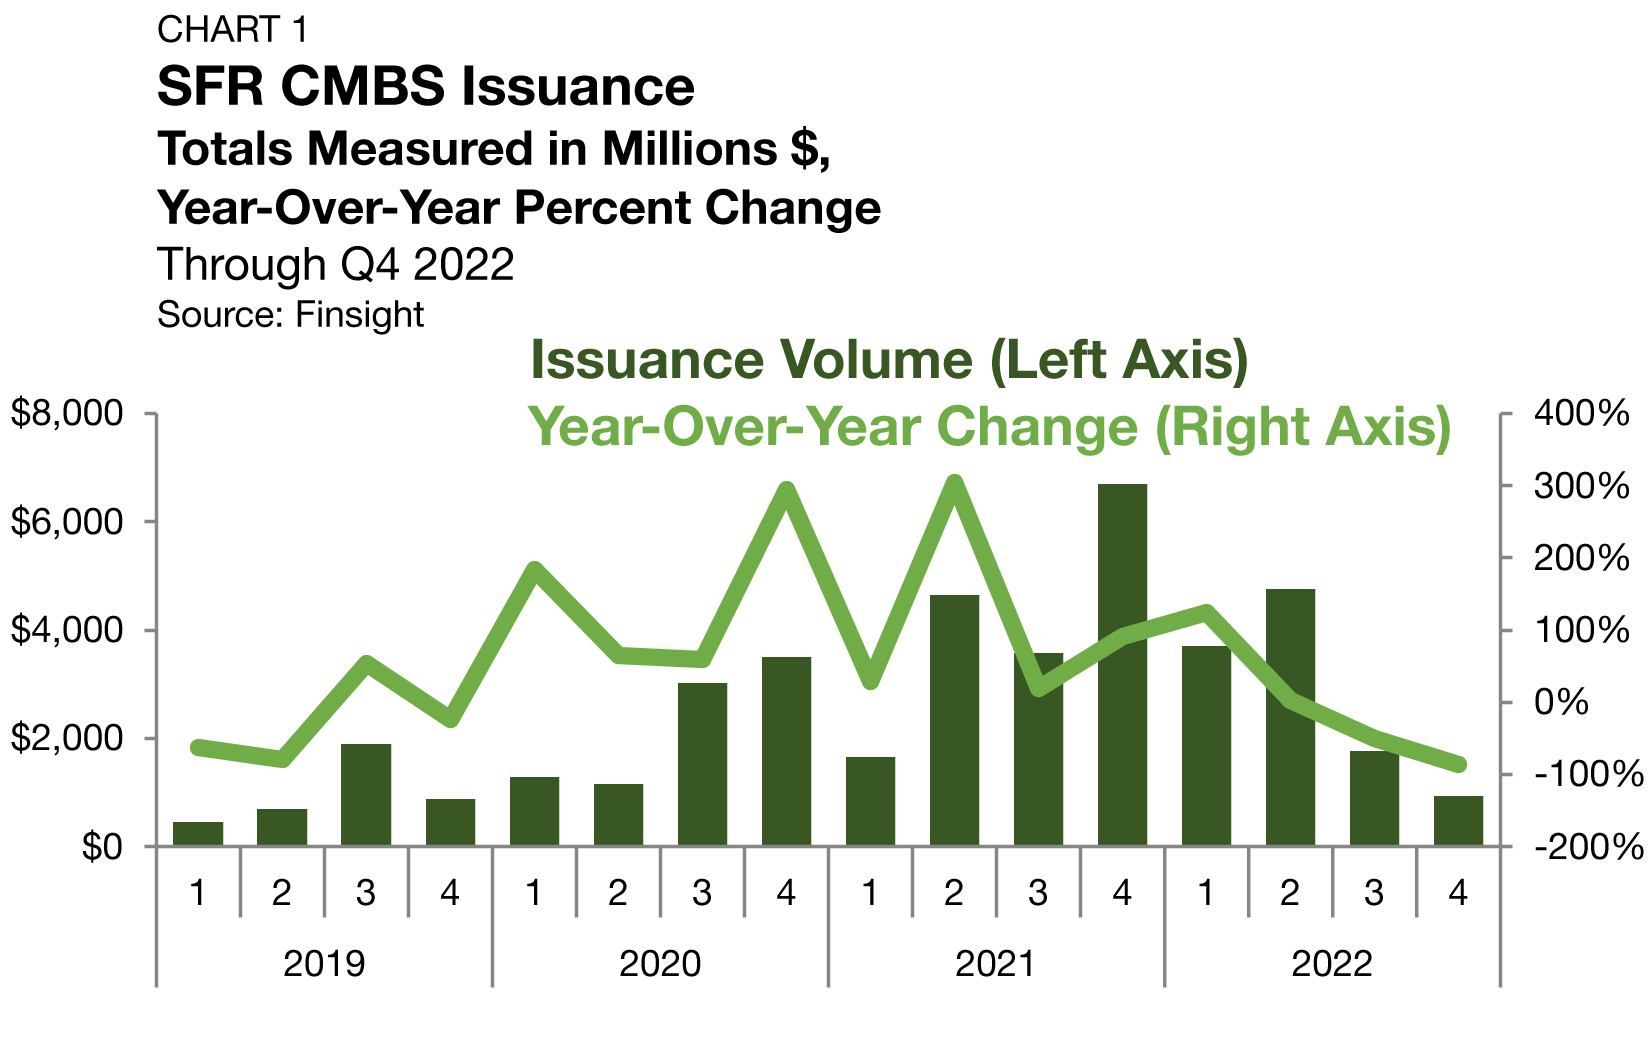
In the CMBS market, the single-family rental issuance has slowed substantially. According to Finsight, single-family rental CMBS issuance totaled just $939 million in the fourth quarter of 2022 — the lowest quarterly amount since 2019 (Chart 1). While SFR CMBS deal activity finished the year totaling $11.2 billion, the second-highest annual volume on record, more than three-quarters of issuances came in the first half of 2022.
Originations by Purpose
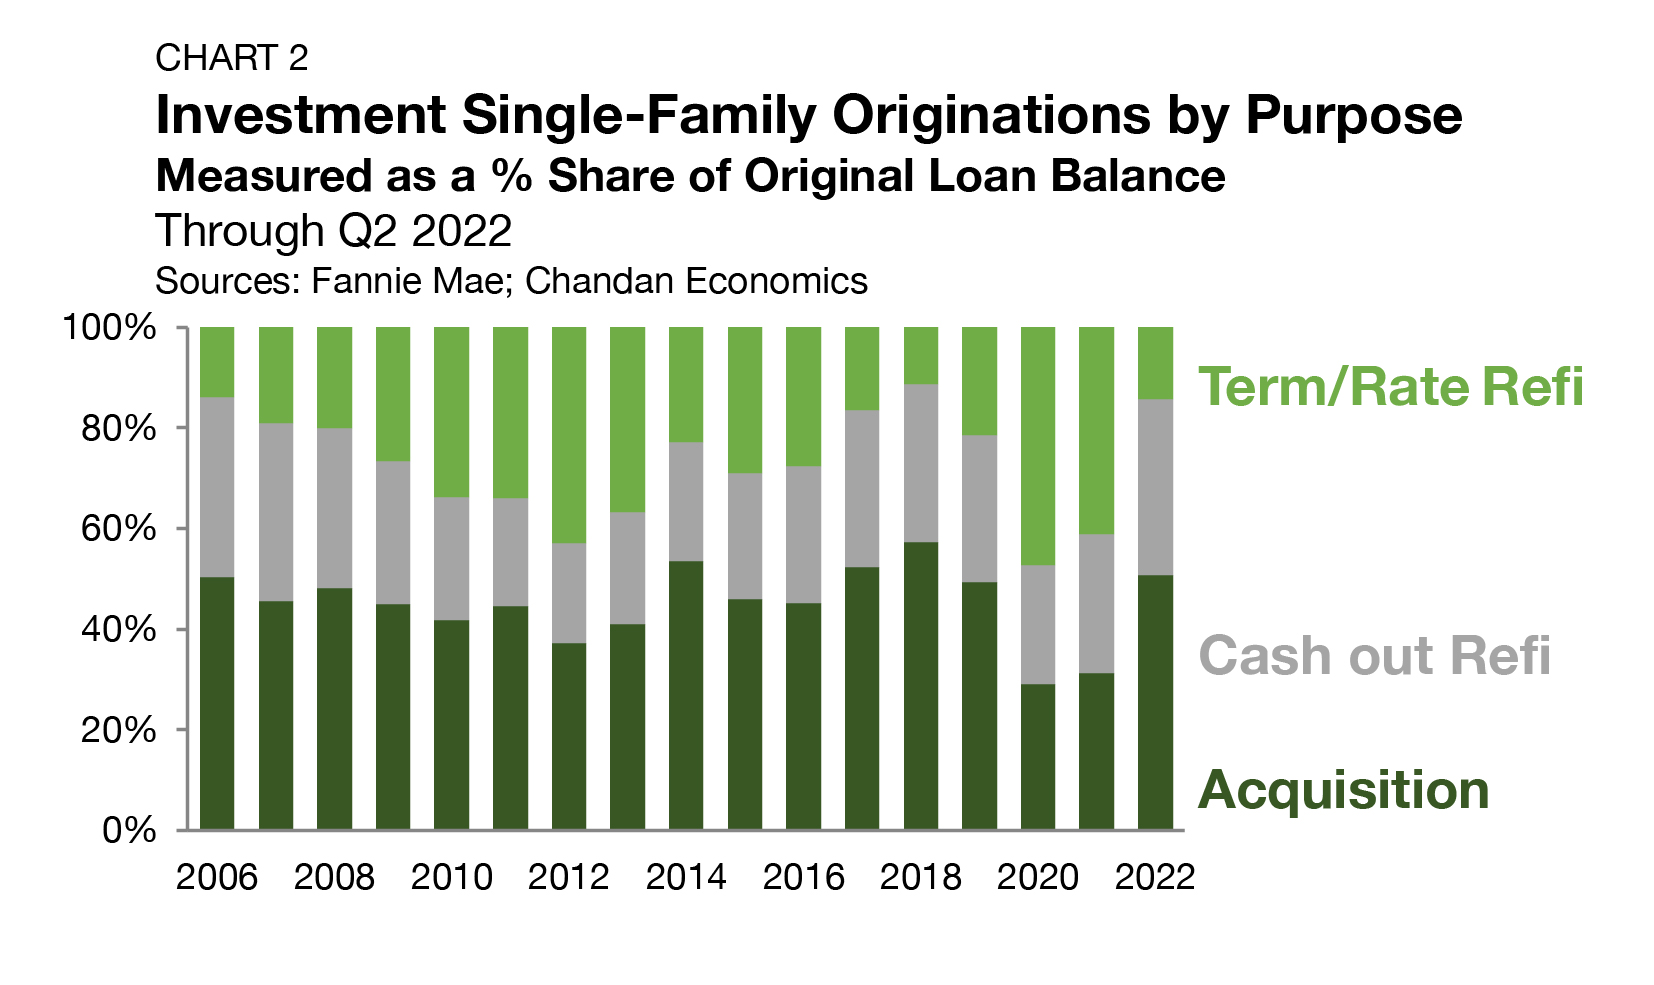
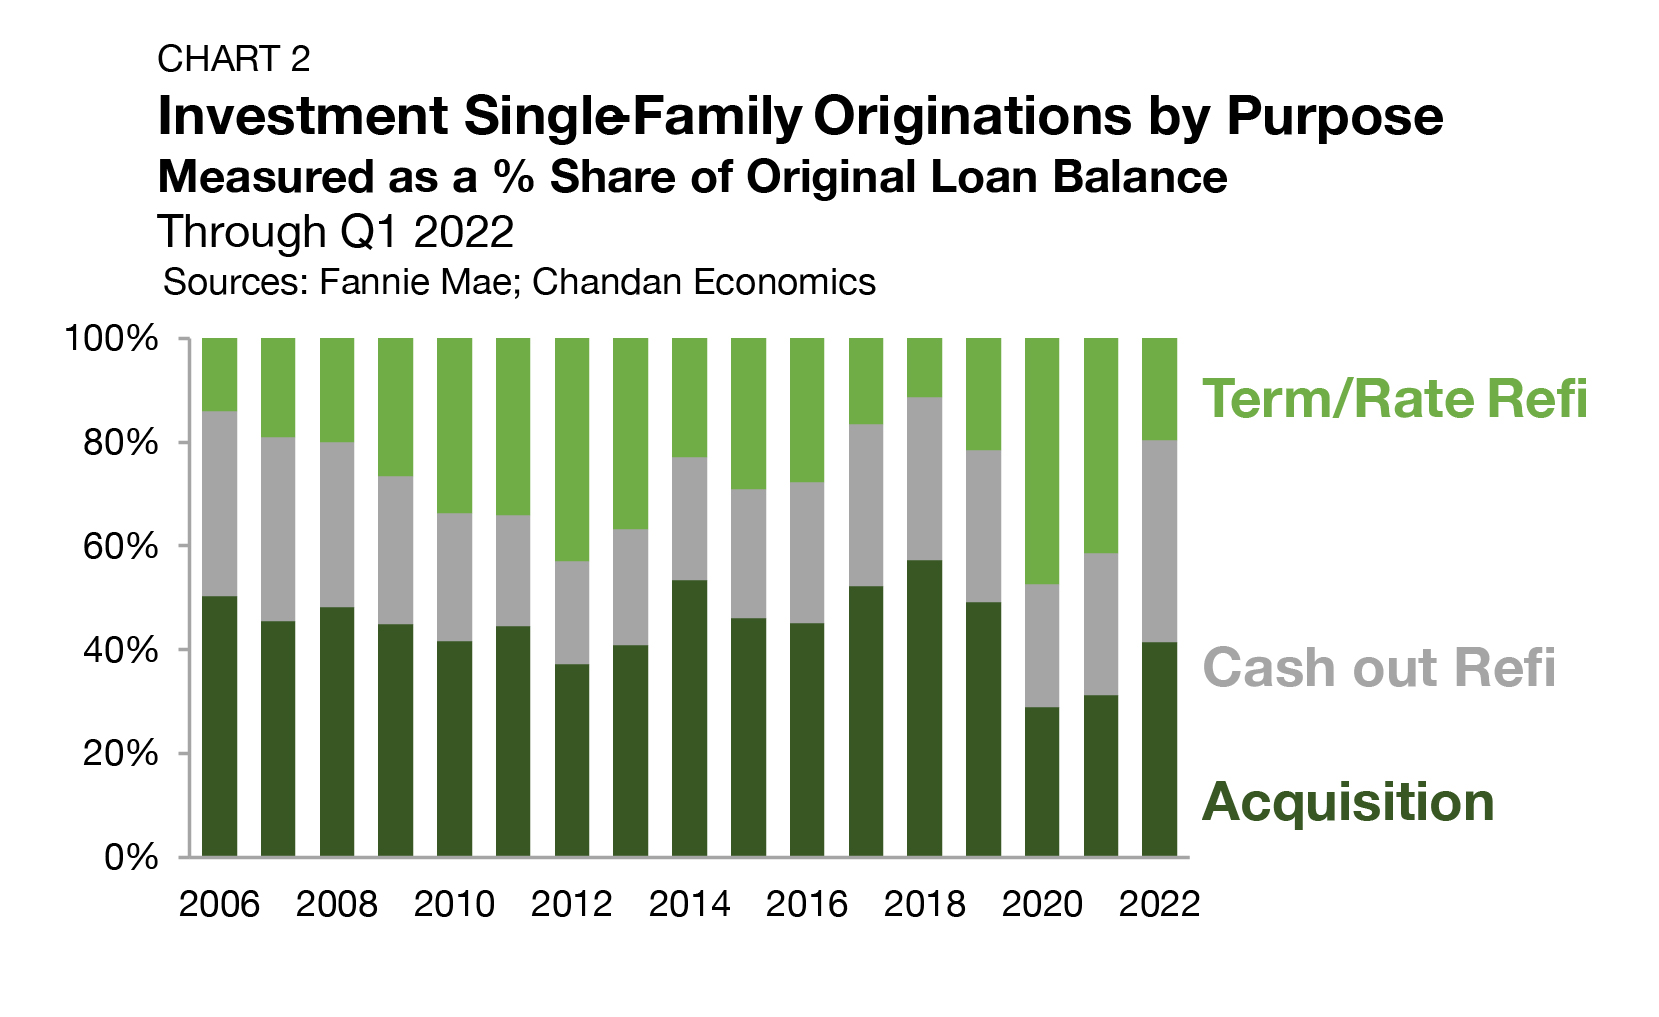
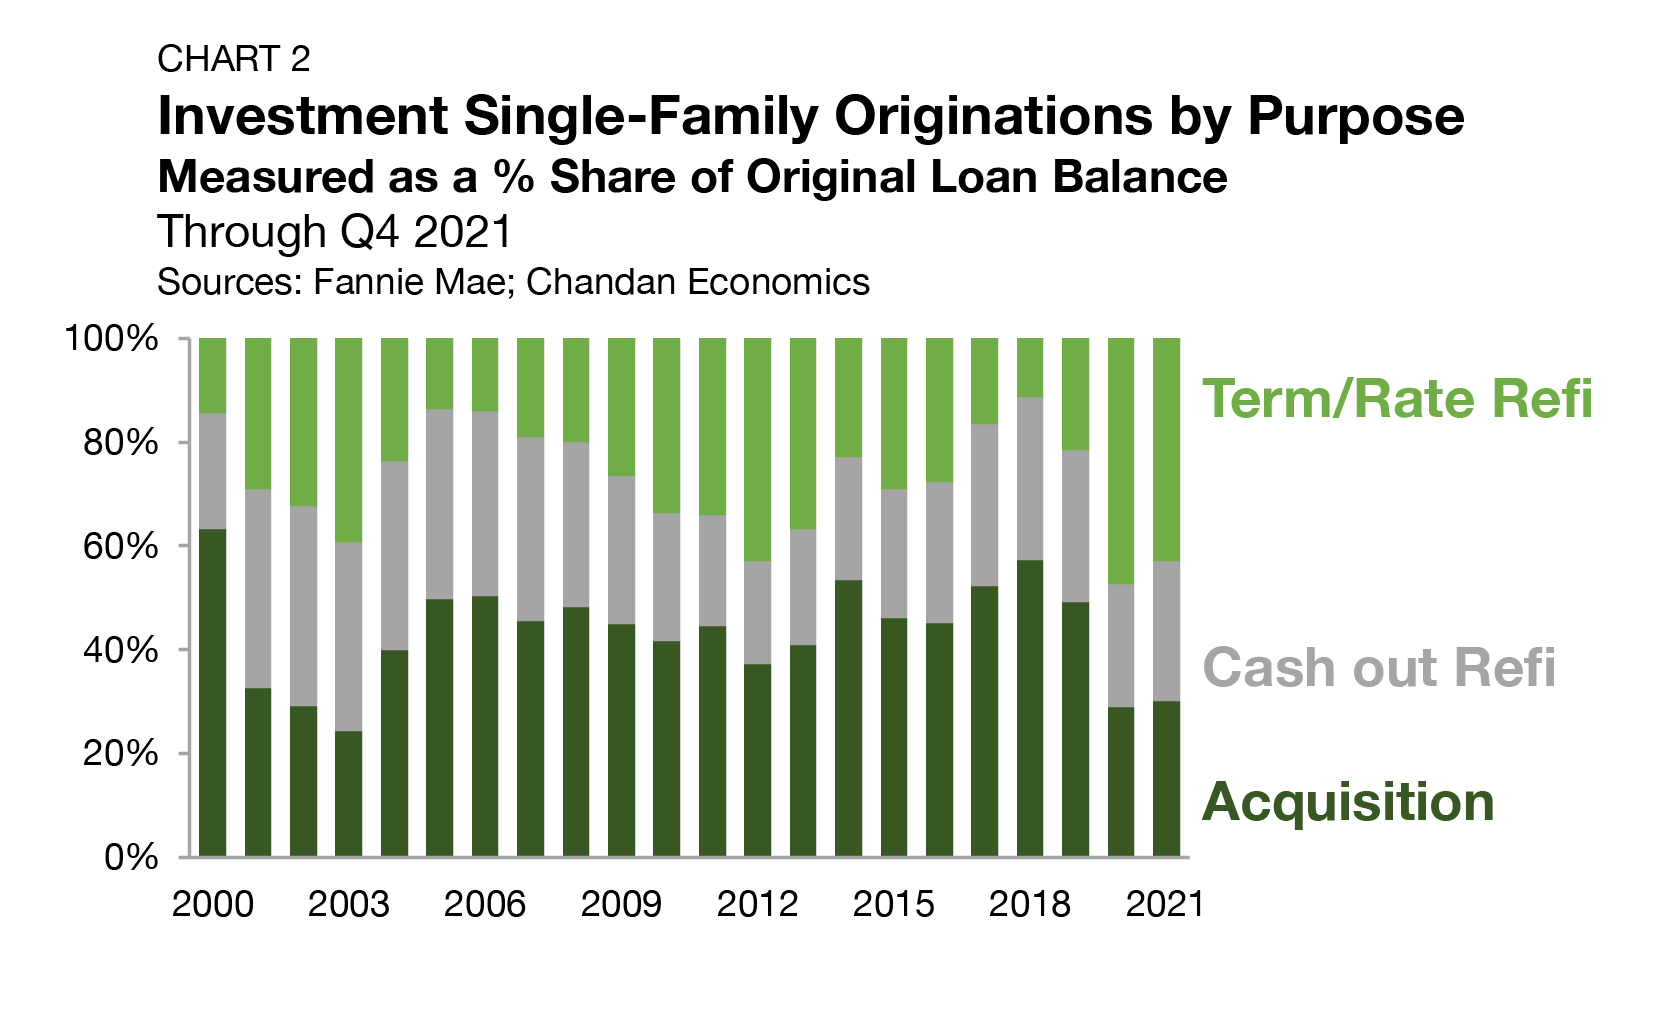
Loans for purchasing, not refinancing, account for the majority (56.0%) of originations to single-family investors in 2022 for the first time since 2018, according to Fannie Mae (Chart 2).
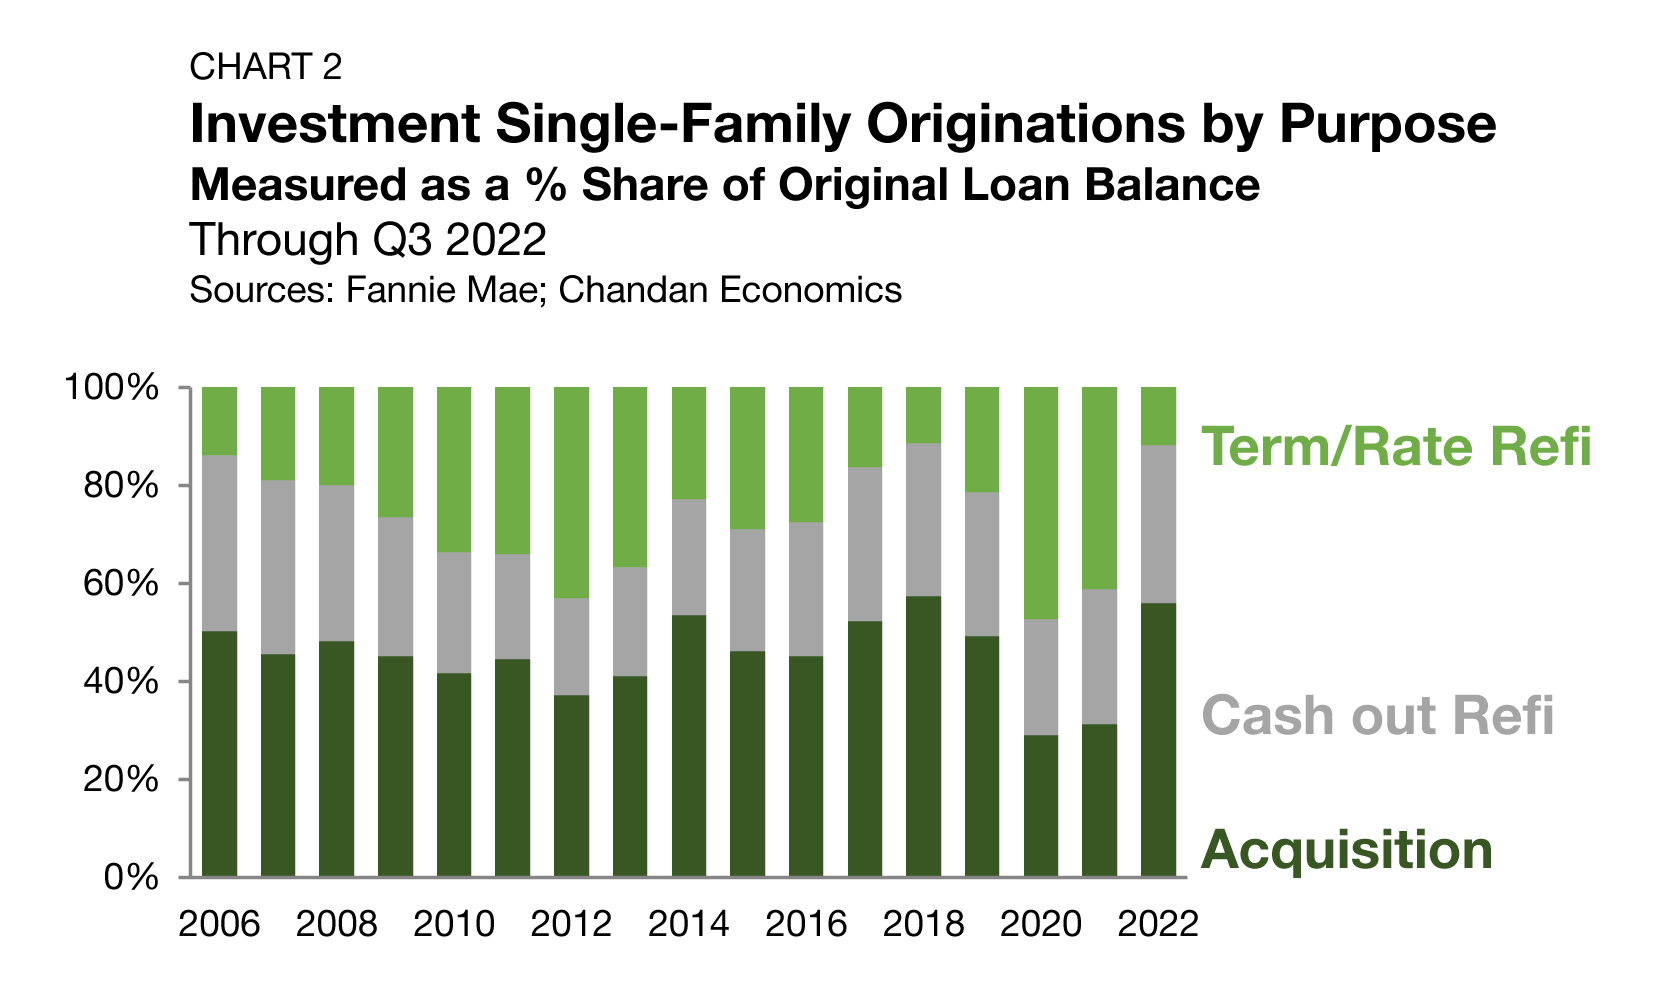
The market shifted through 2022, driven by the Federal Reserve’s monetary tightening cycle. As of the beginning of February 2023, the Fed has moved up its benchmark Federal Funds rate eight times in the past year, rising 450 bps. The impact of the Fed’s tightening cycle on interest rates has been dramatic, including on mortgage interest rates, which have held above 6% since September 2022.
The rise in borrowing costs has meant that fewer existing SFR owners would benefit from refinancing their existing mortgages. Term/rate refinancings, which accounted for 47.3% and 41.2% of originations in 2020 and 2021, respectively, have fallen to 11.9% in 2022. Meanwhile, cash-out refinancings have continued to hold up this year, despite the impact of higher borrowing costs. Through the third quarter of 2022, cash-outs have accounted for 32.1% of SFR lending activity. Often, for smaller investors, accrued equity in existing properties represents the capital needed for a down payment on another.
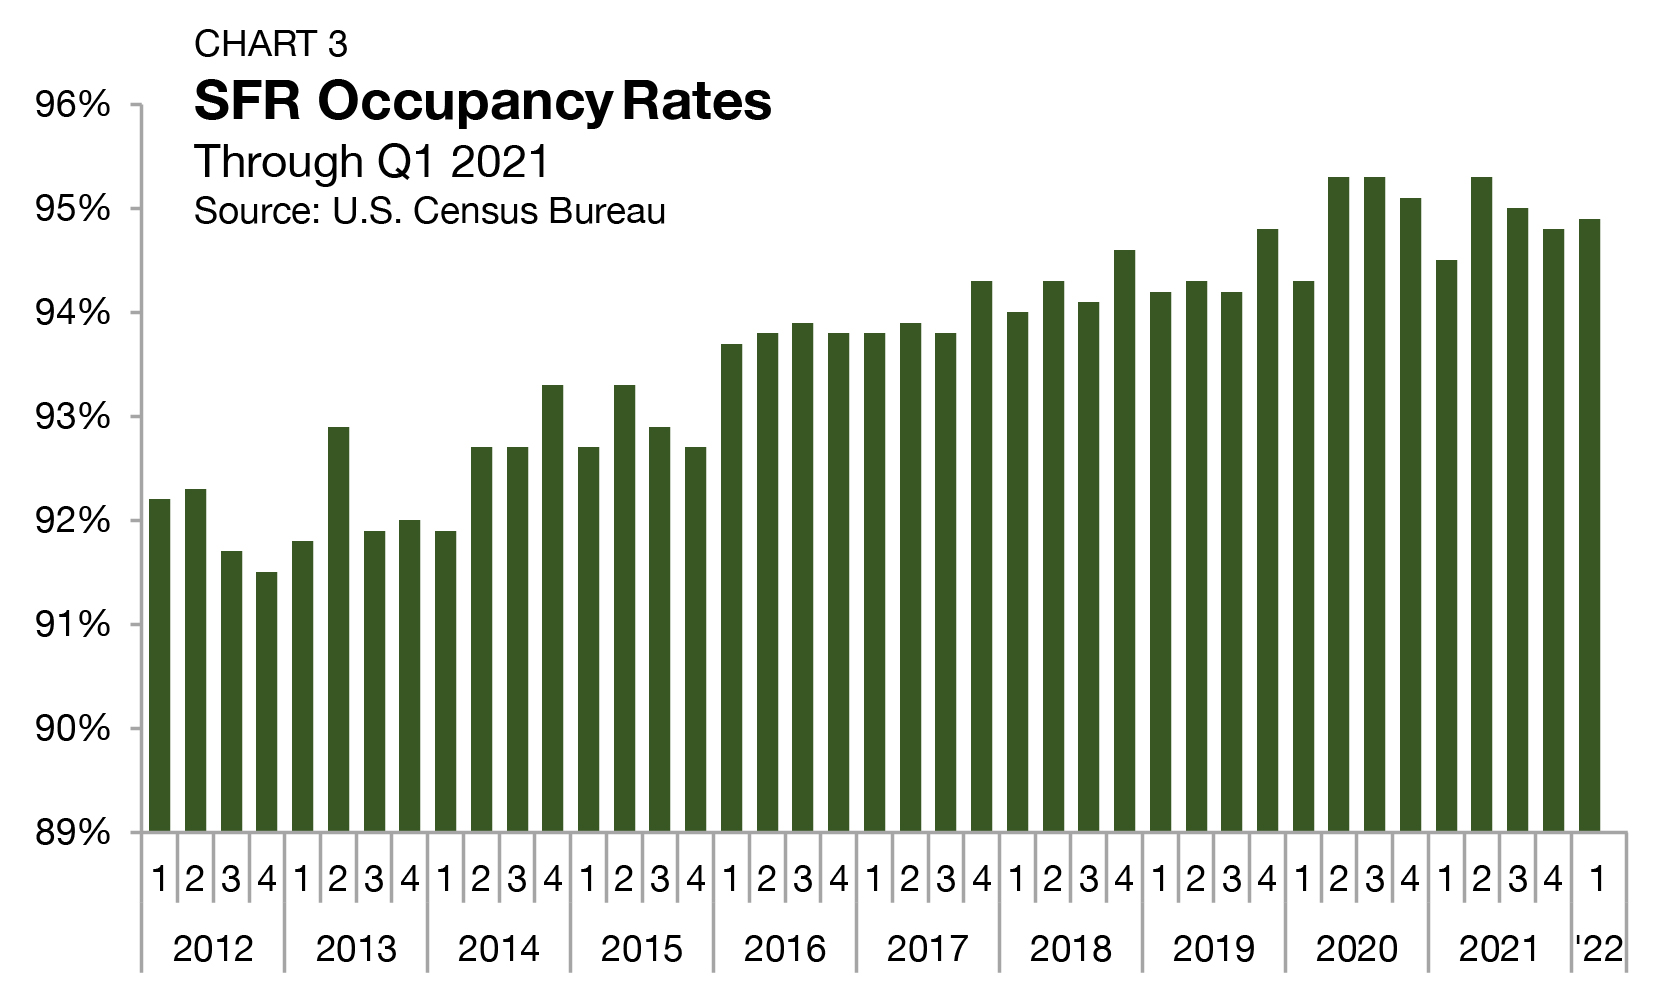
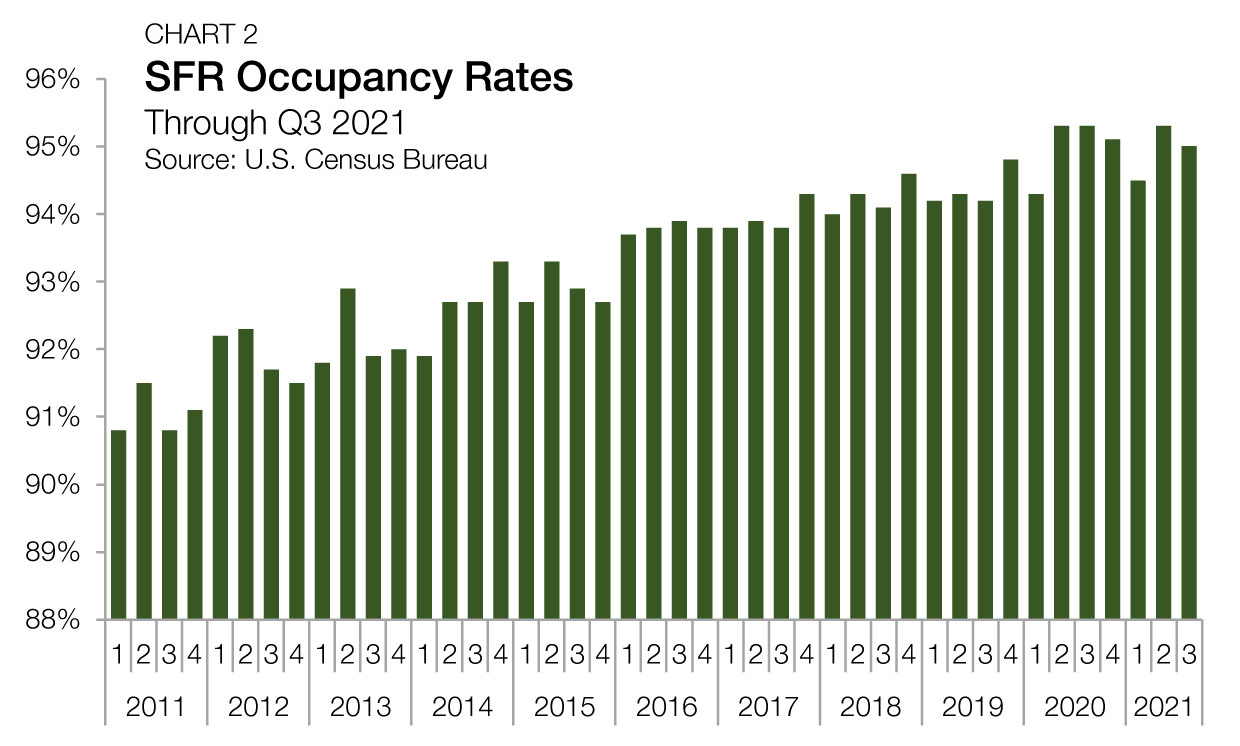
Occupancy
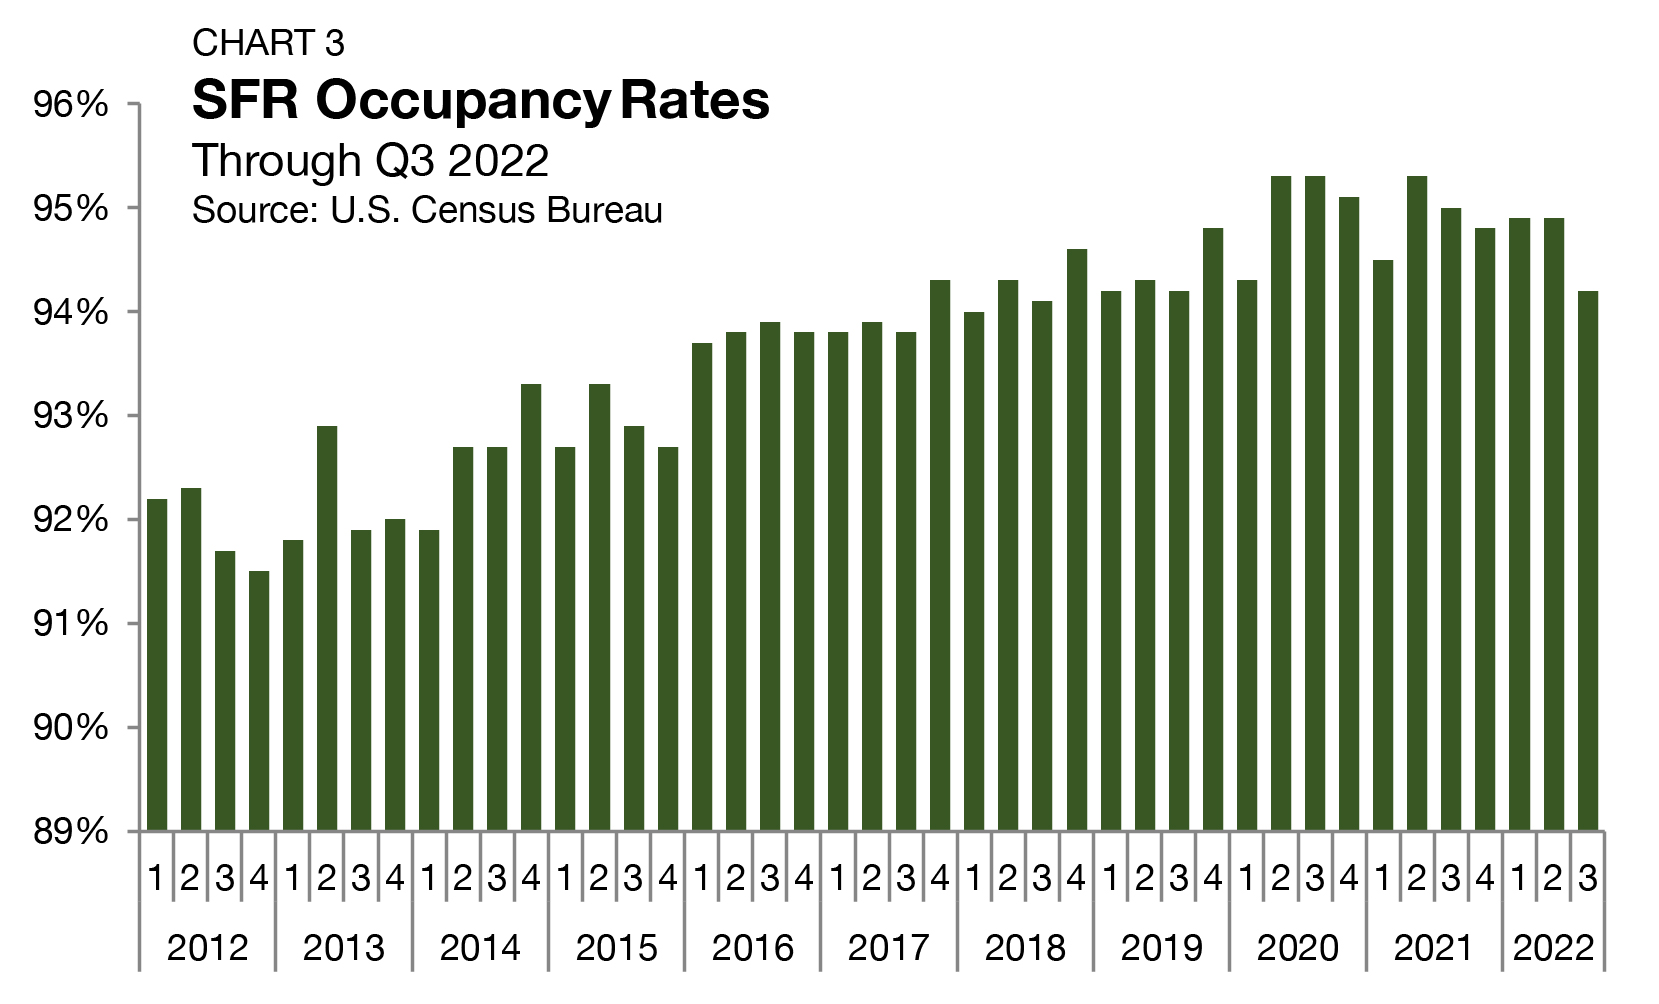
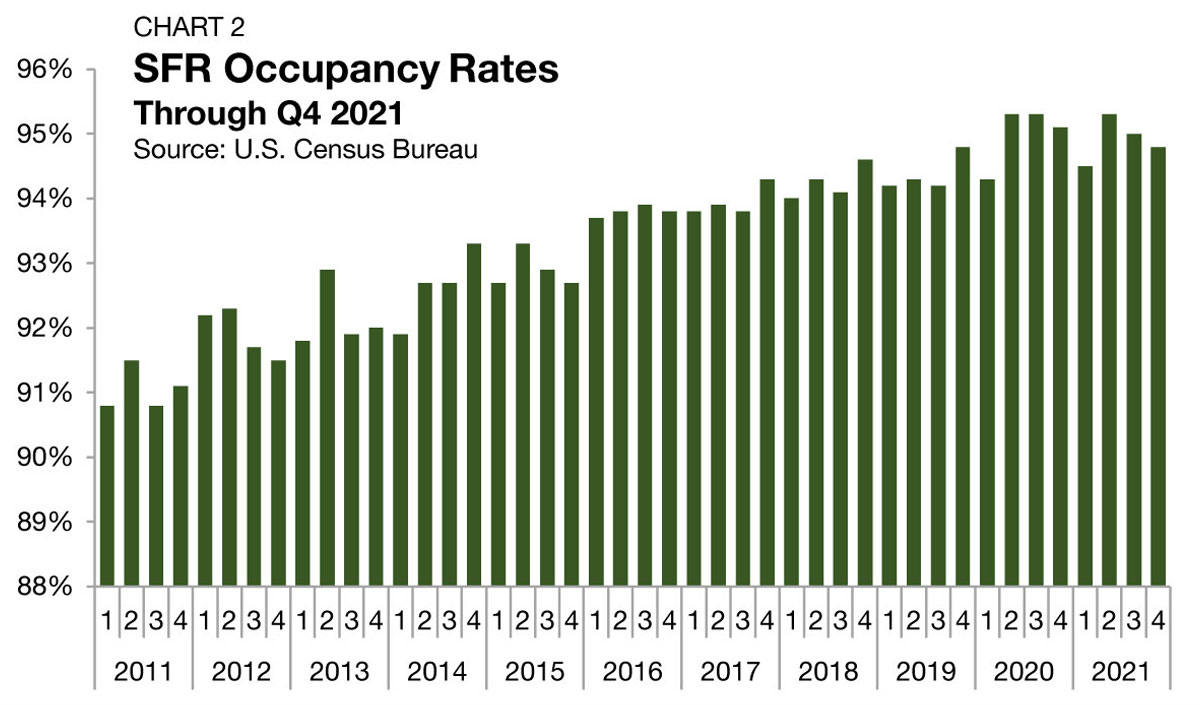
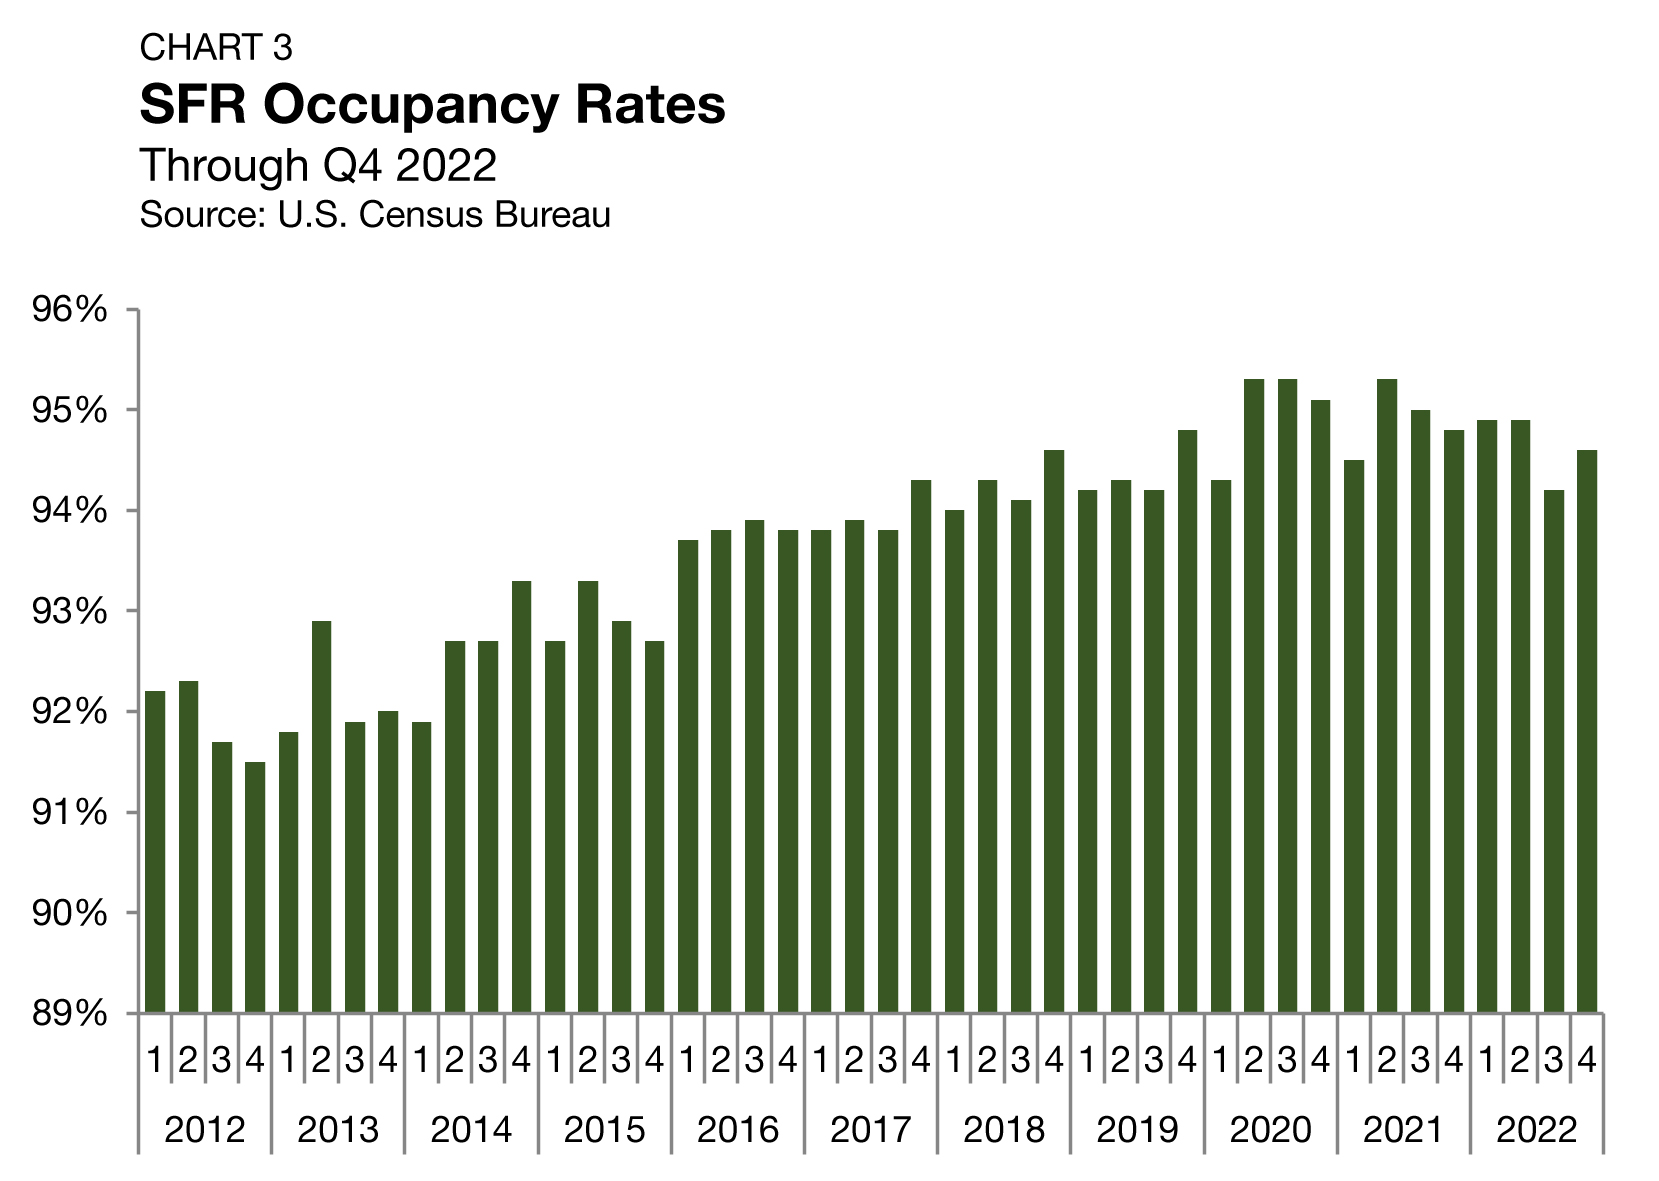
As measured by the U.S. Census Bureau, occupancy rates across all SFRs averaged 94.6% in the fourth quarter of 2022, improving by 40 bps from the previous quarter (Chart 3). The Census Bureau data aligns well with similar data from private sources. DBRS Morningstar reported the SFR vacancy rate as 94.1% in November 2022.
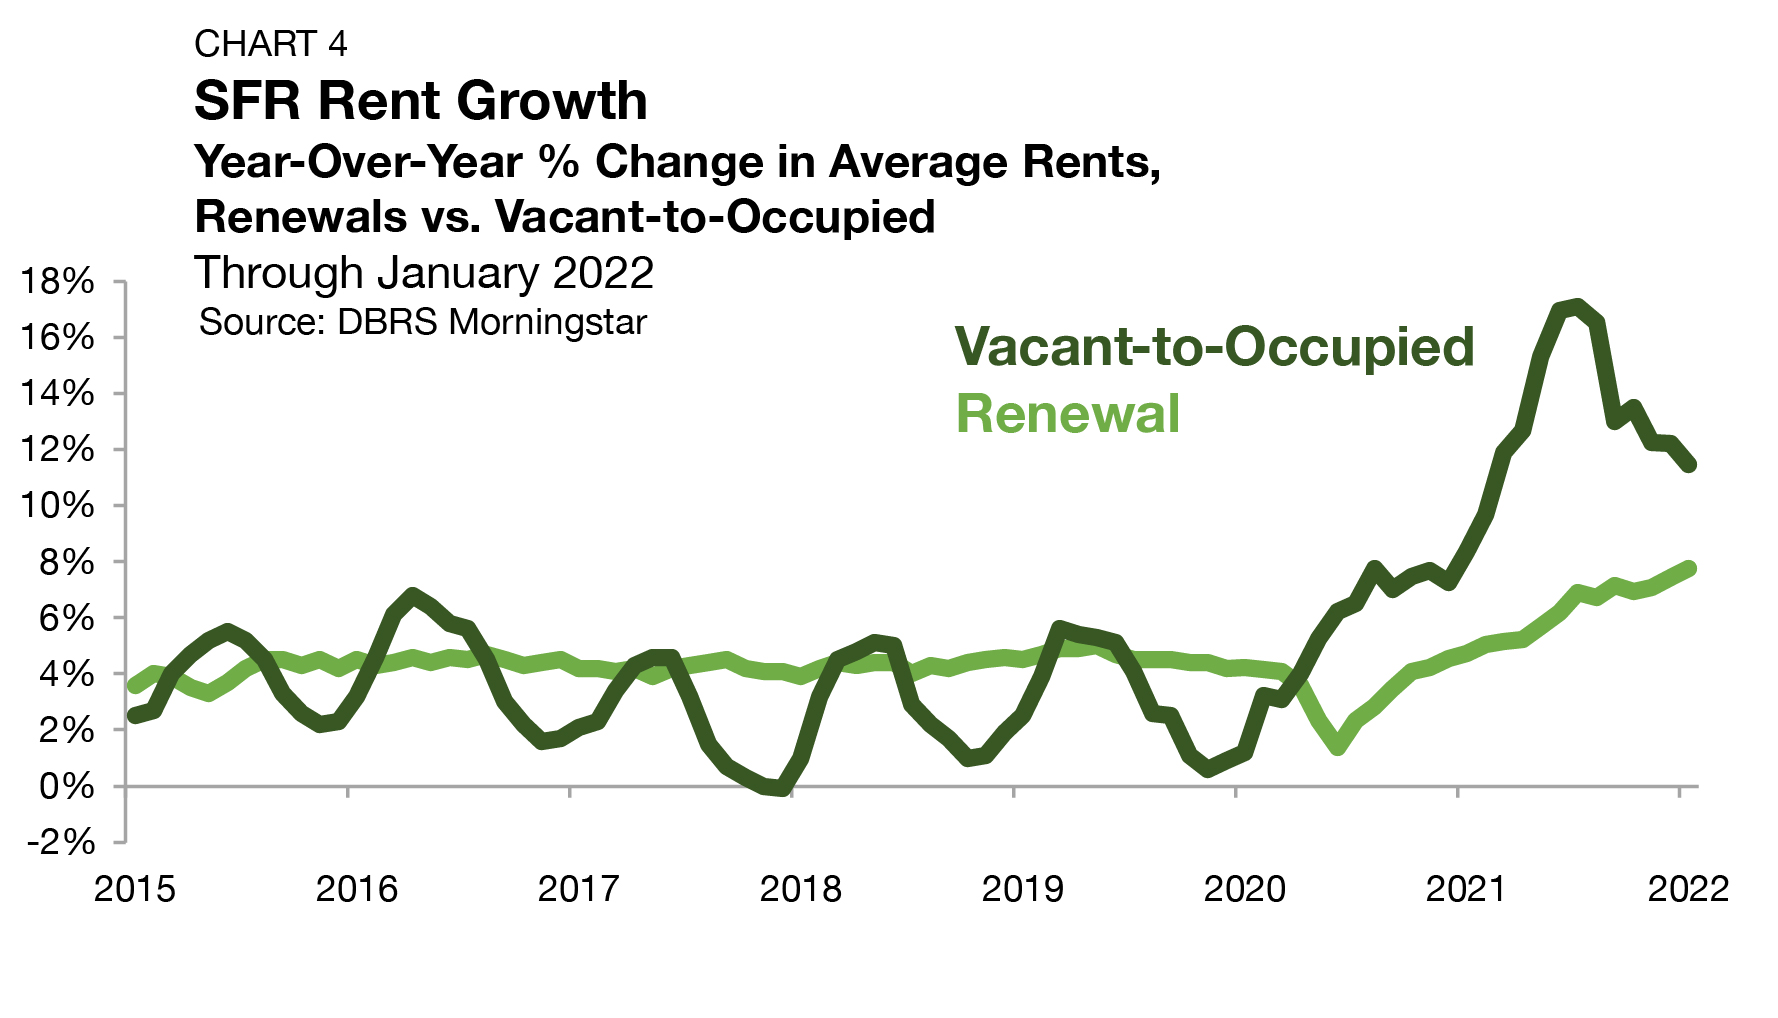
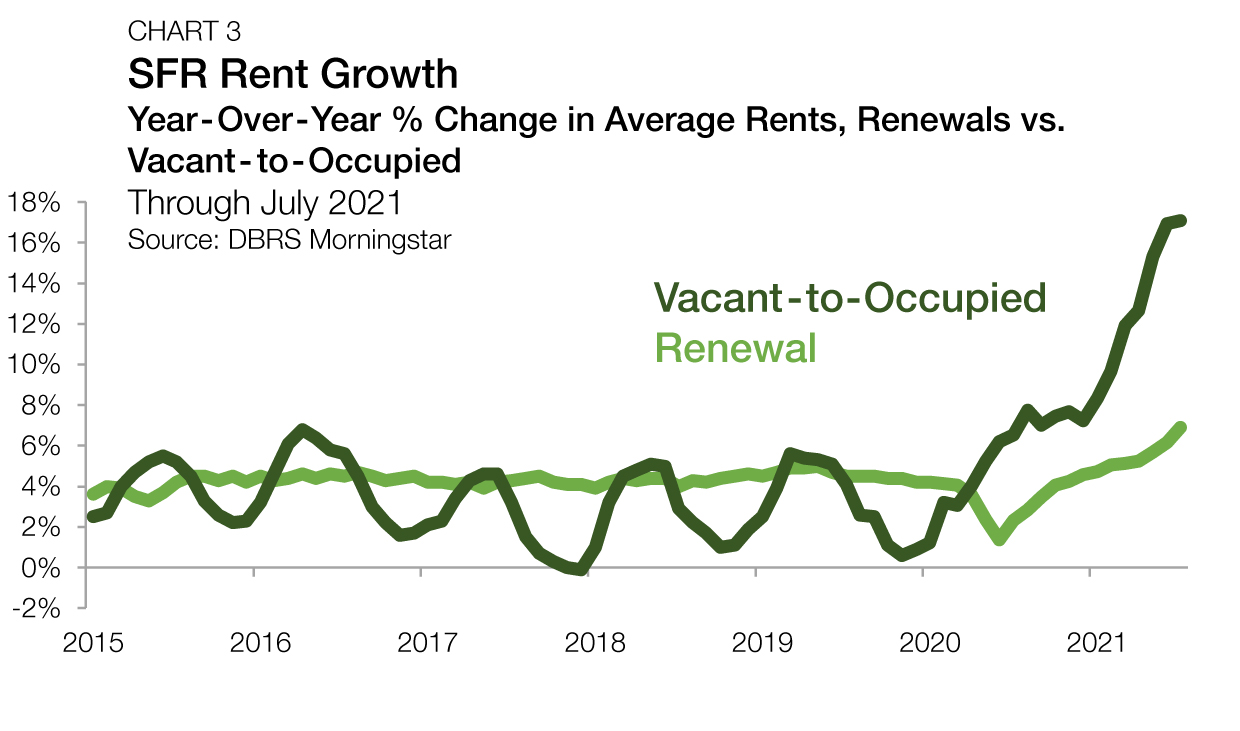
Rent Growth
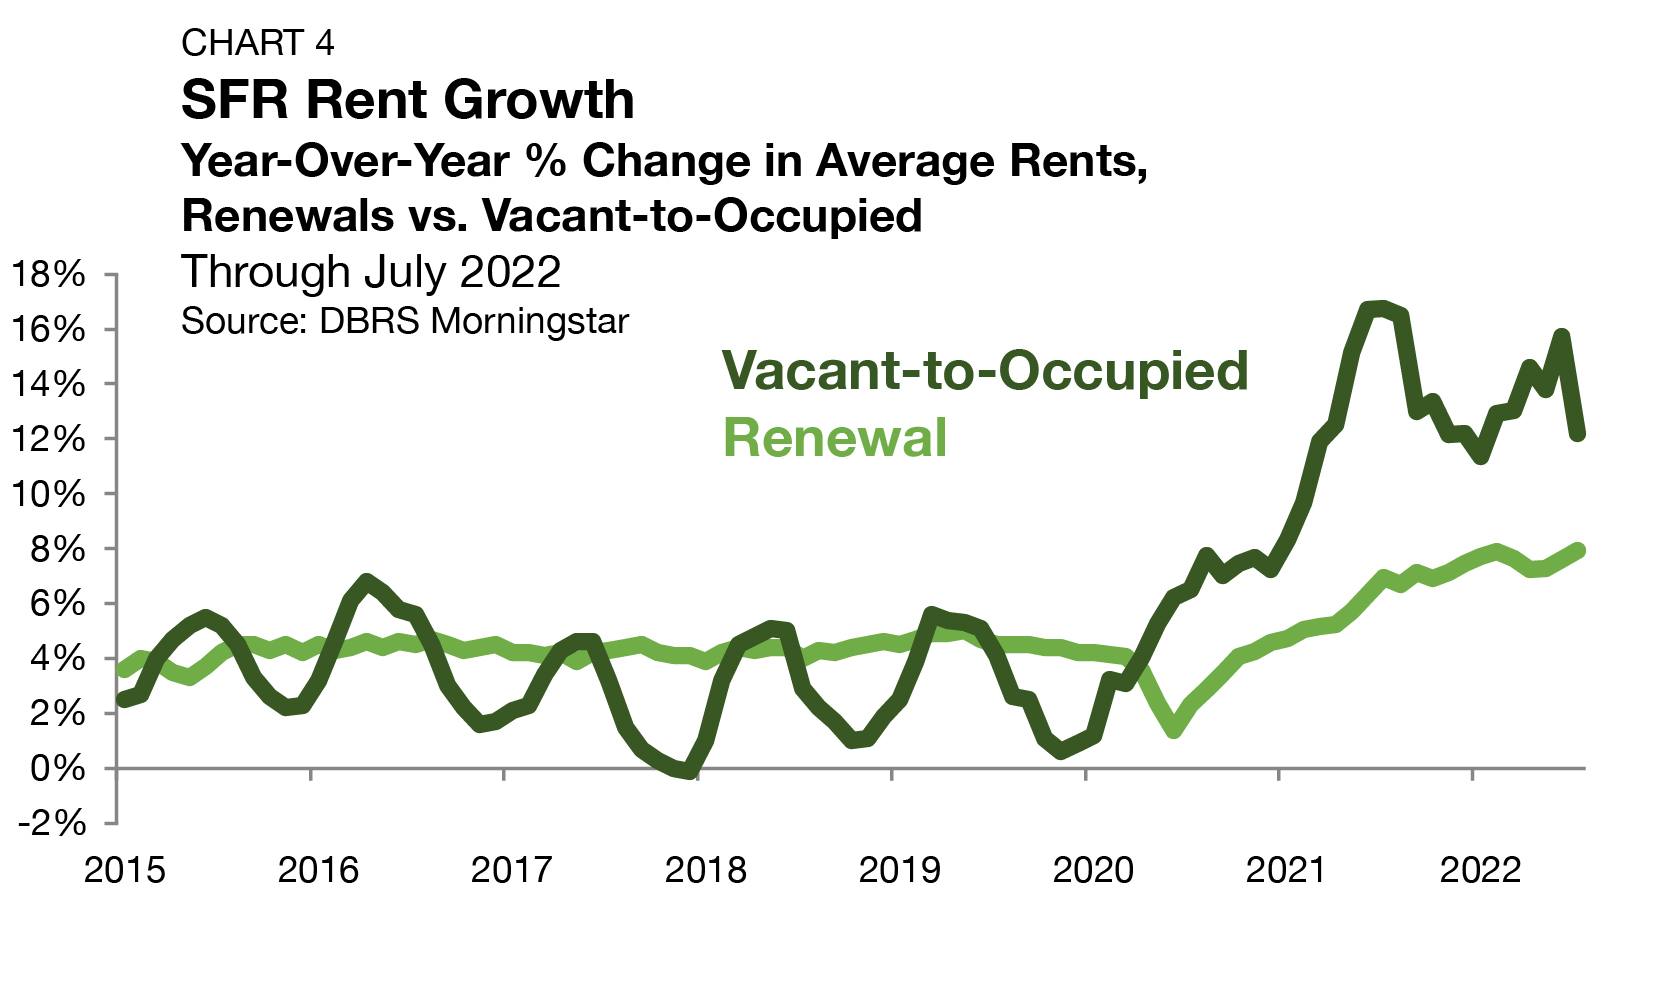
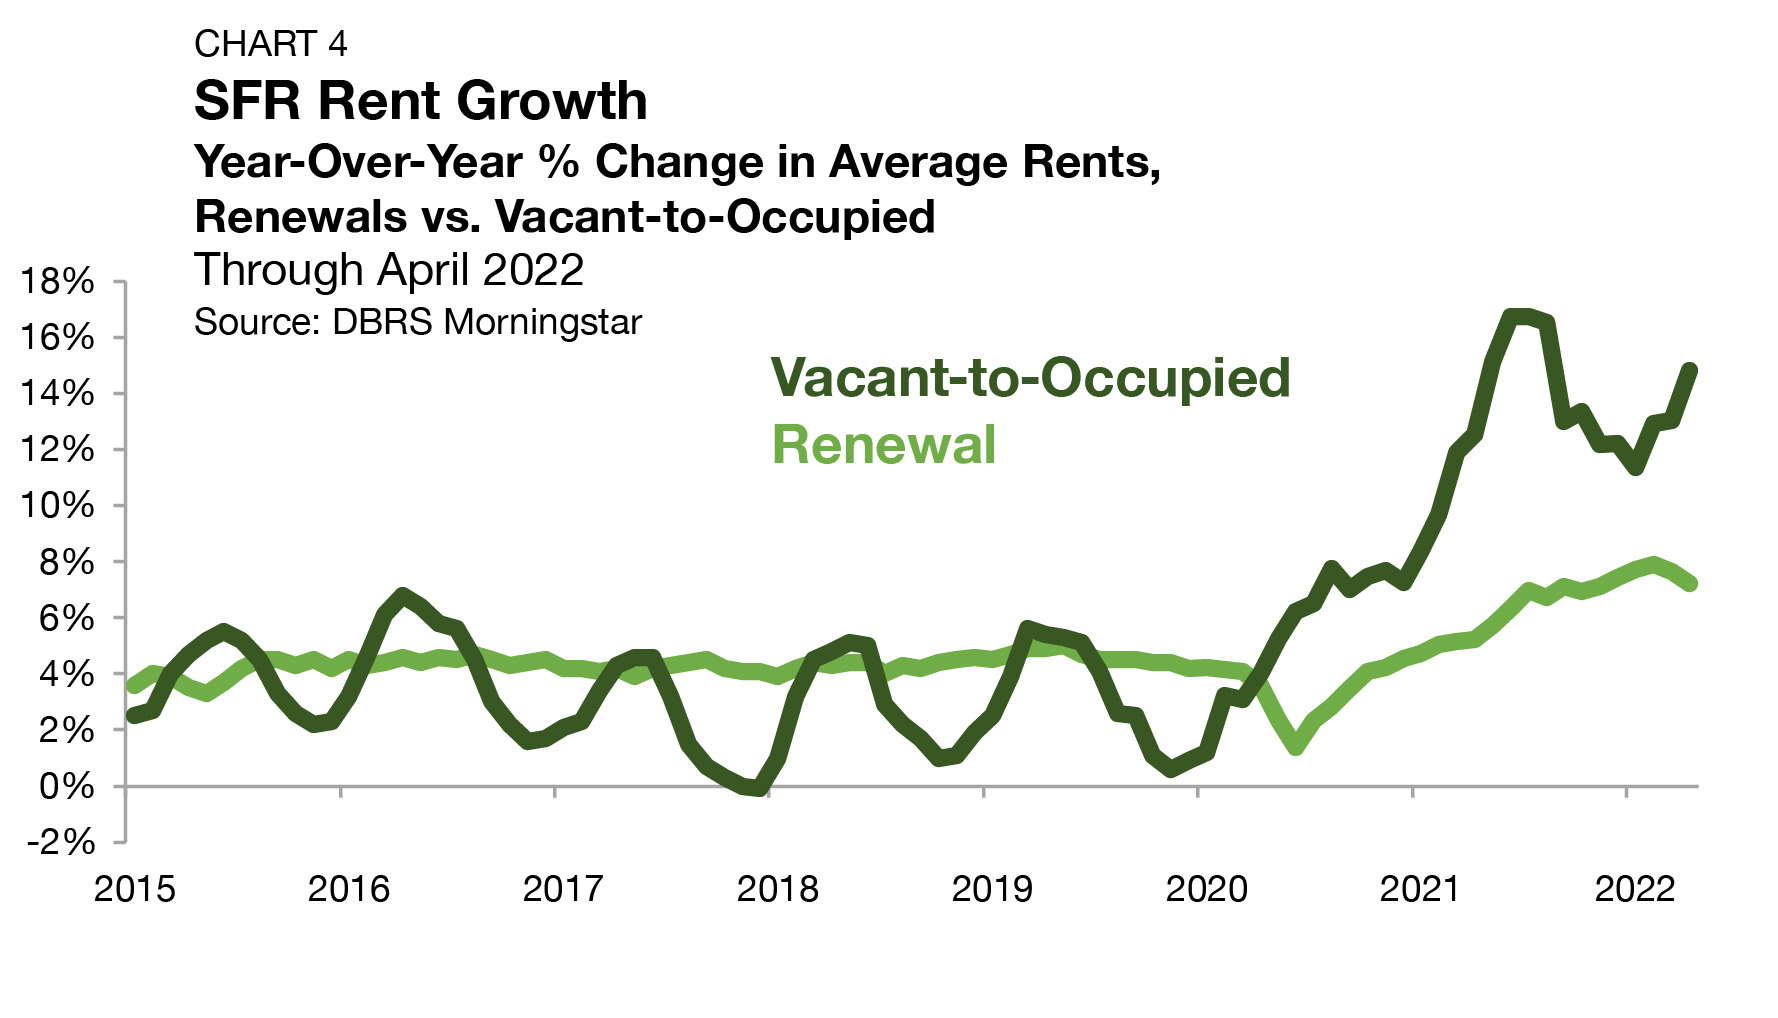
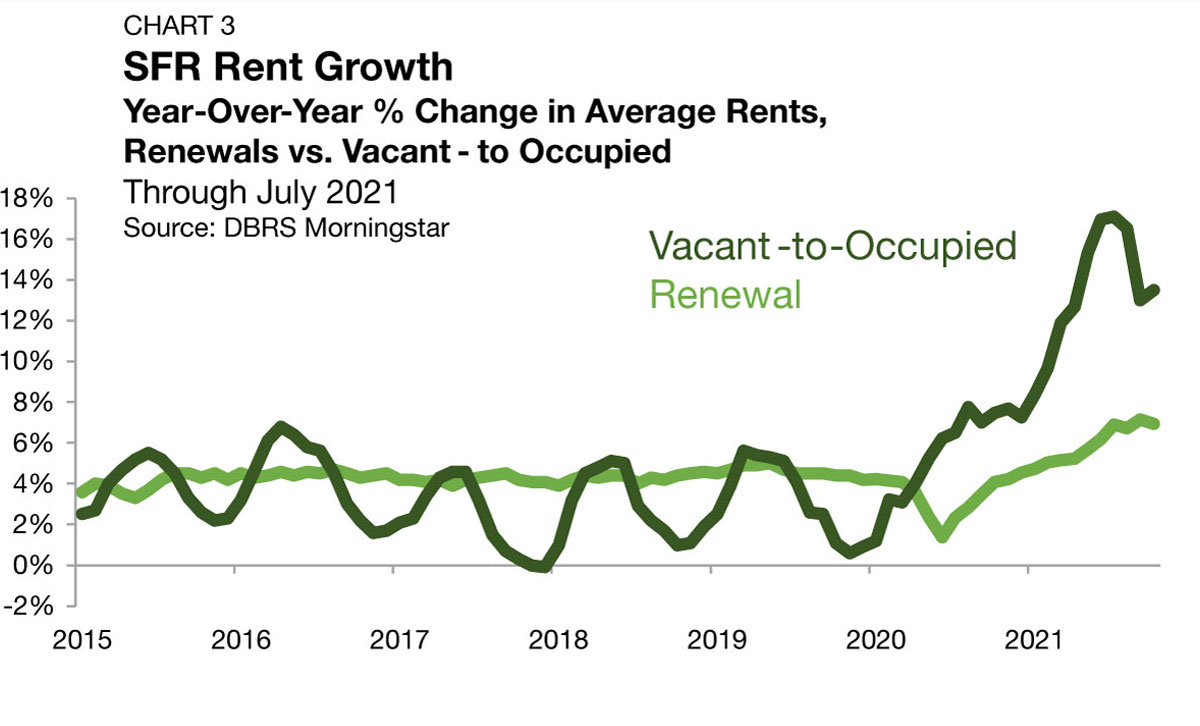
Vacant-to-occupied (V2O) annual rent growth has cratered in recent months, according to DBRS Morningstar. Between March 2021 and August 2022, V2O annual rent growth stood above 10% for 18 consecutive months (Chart 4). Fast forward to October 2022, annual V2O rent growth has decelerated to just 5.3% — its lowest level since May 2020. After an unprecedented run of historically robust V2O rent growth, recent data indicate that the slowdown is well underway.
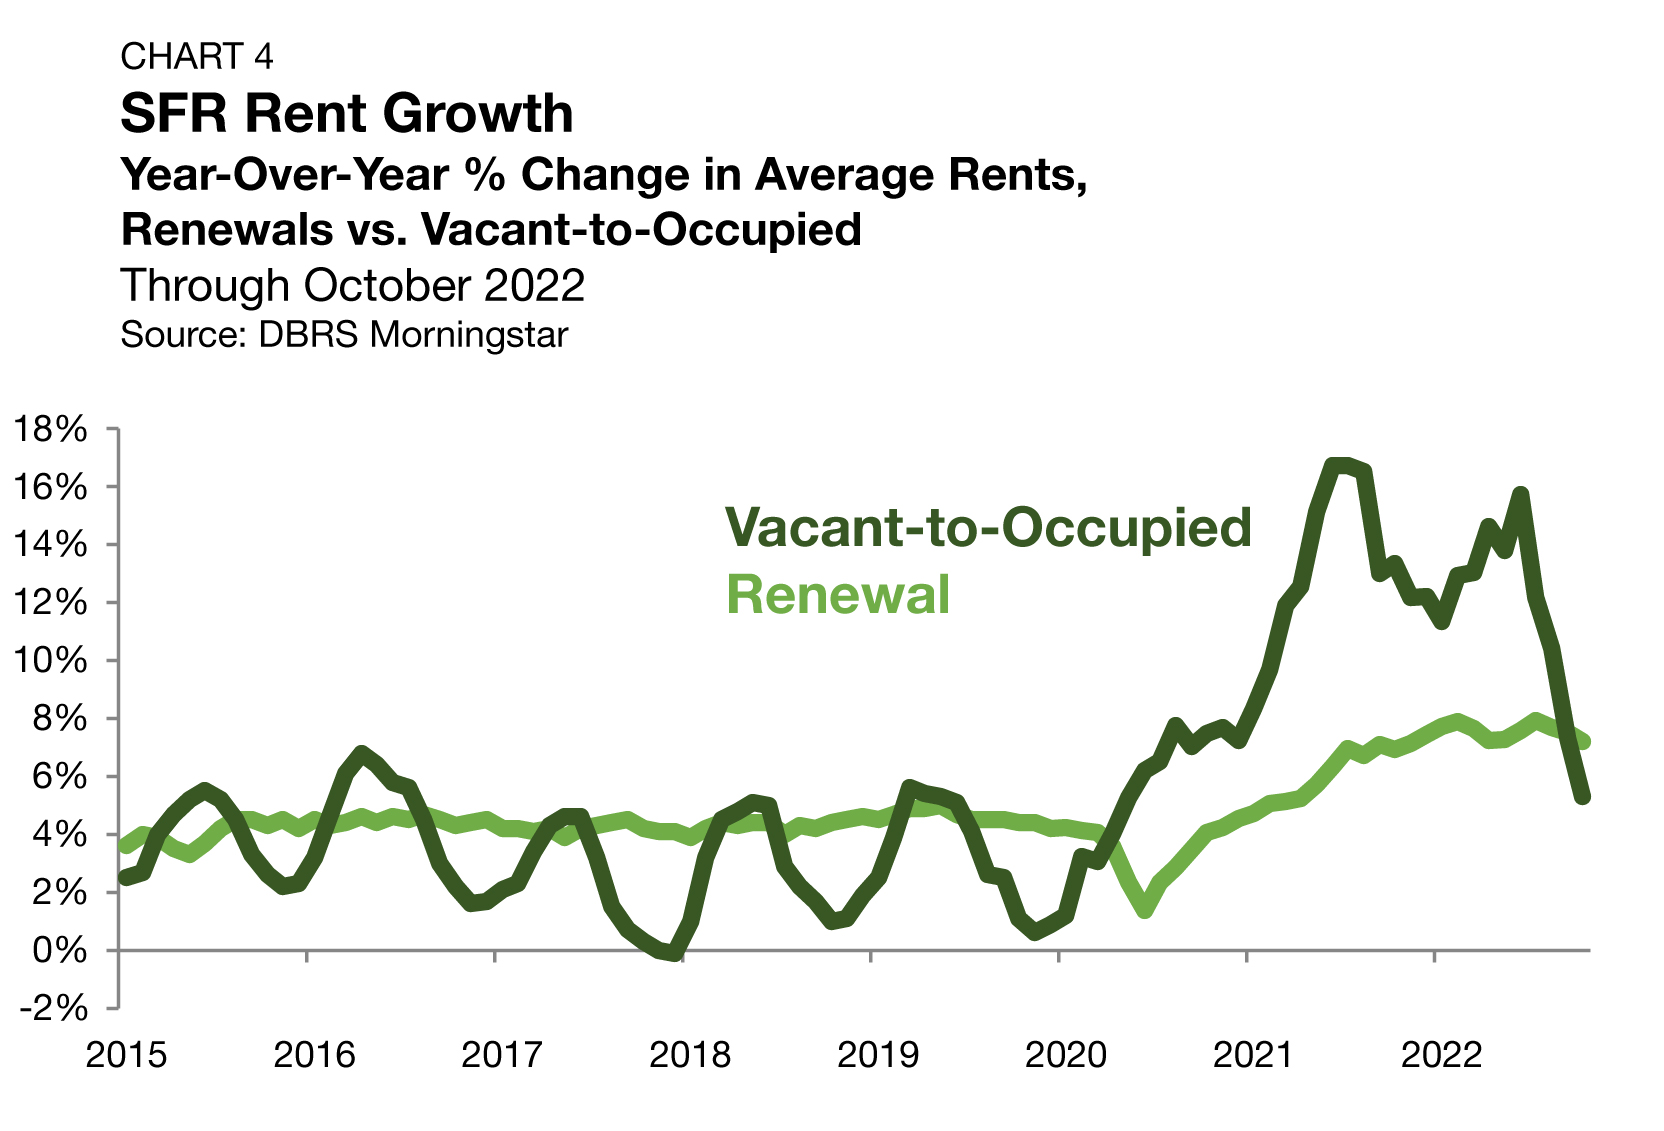
Rent growth for lease renewals has started to slow, albeit far more gently. After hitting an all-time high of 7.9% in July 2022, lease renewal rent growth has slid for three consecutive months through October, landing at 7.2%. While it is coming down, the pace remains well above normal. Between 2015 and 2019, SFR renewal rent growth consistently ranged between 3.3% and 5.0%. Since February 2021, the rate has topped 5.0% in 21 consecutive months, marking an unrivaled period of sustained gains. Even as the growth rate is poised to slow, it will likely remain at higher-than-normal levels for several months as the resetting of market rents experienced by new lease signers in the past year will influence the prices paid by renewing tenants.
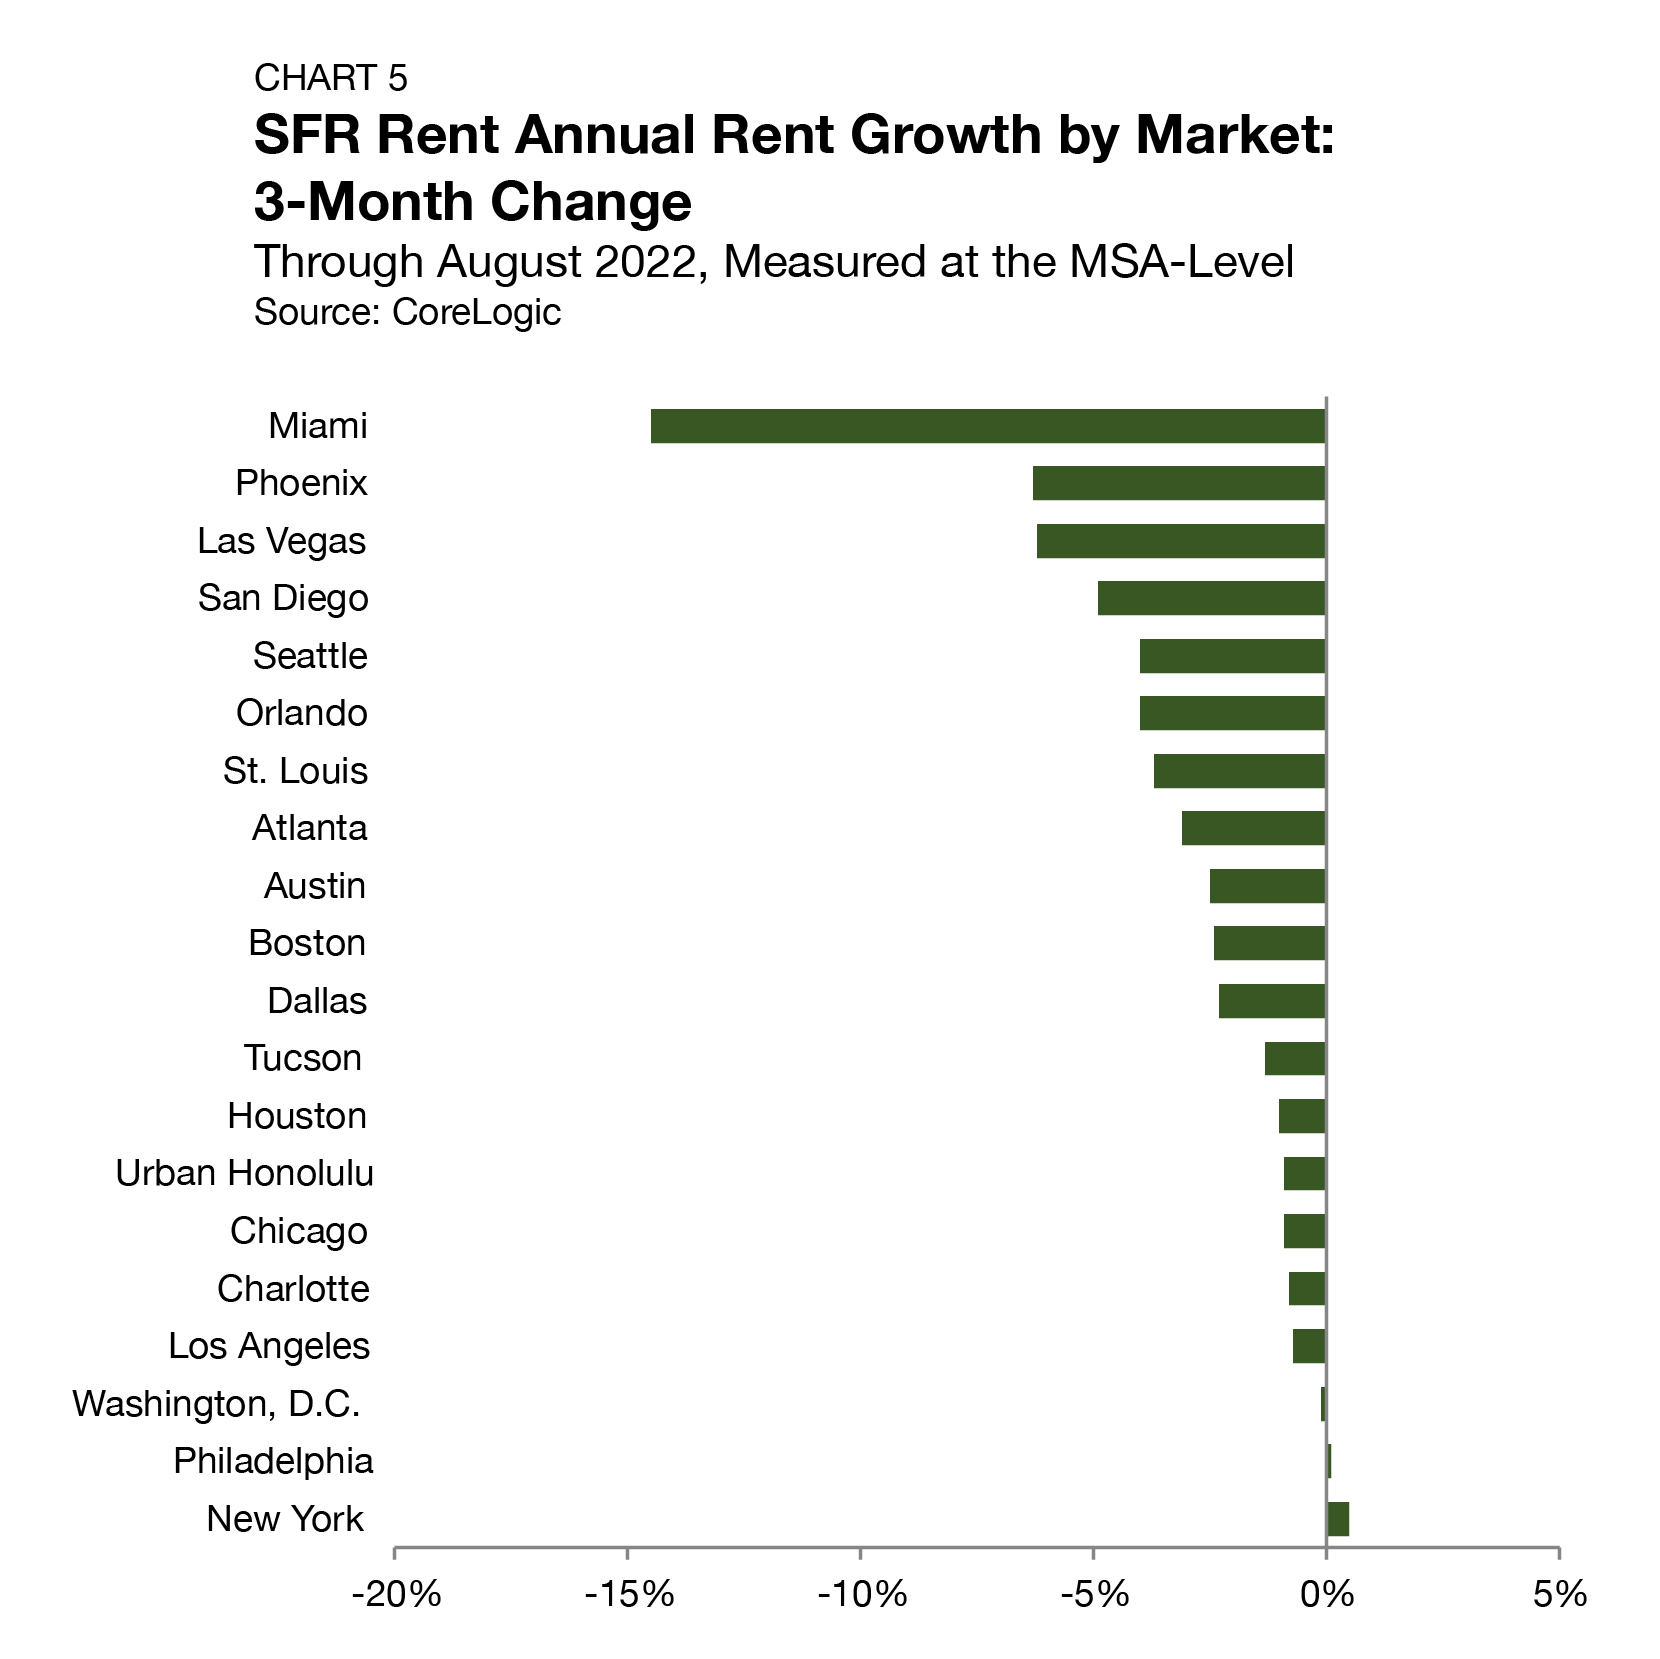
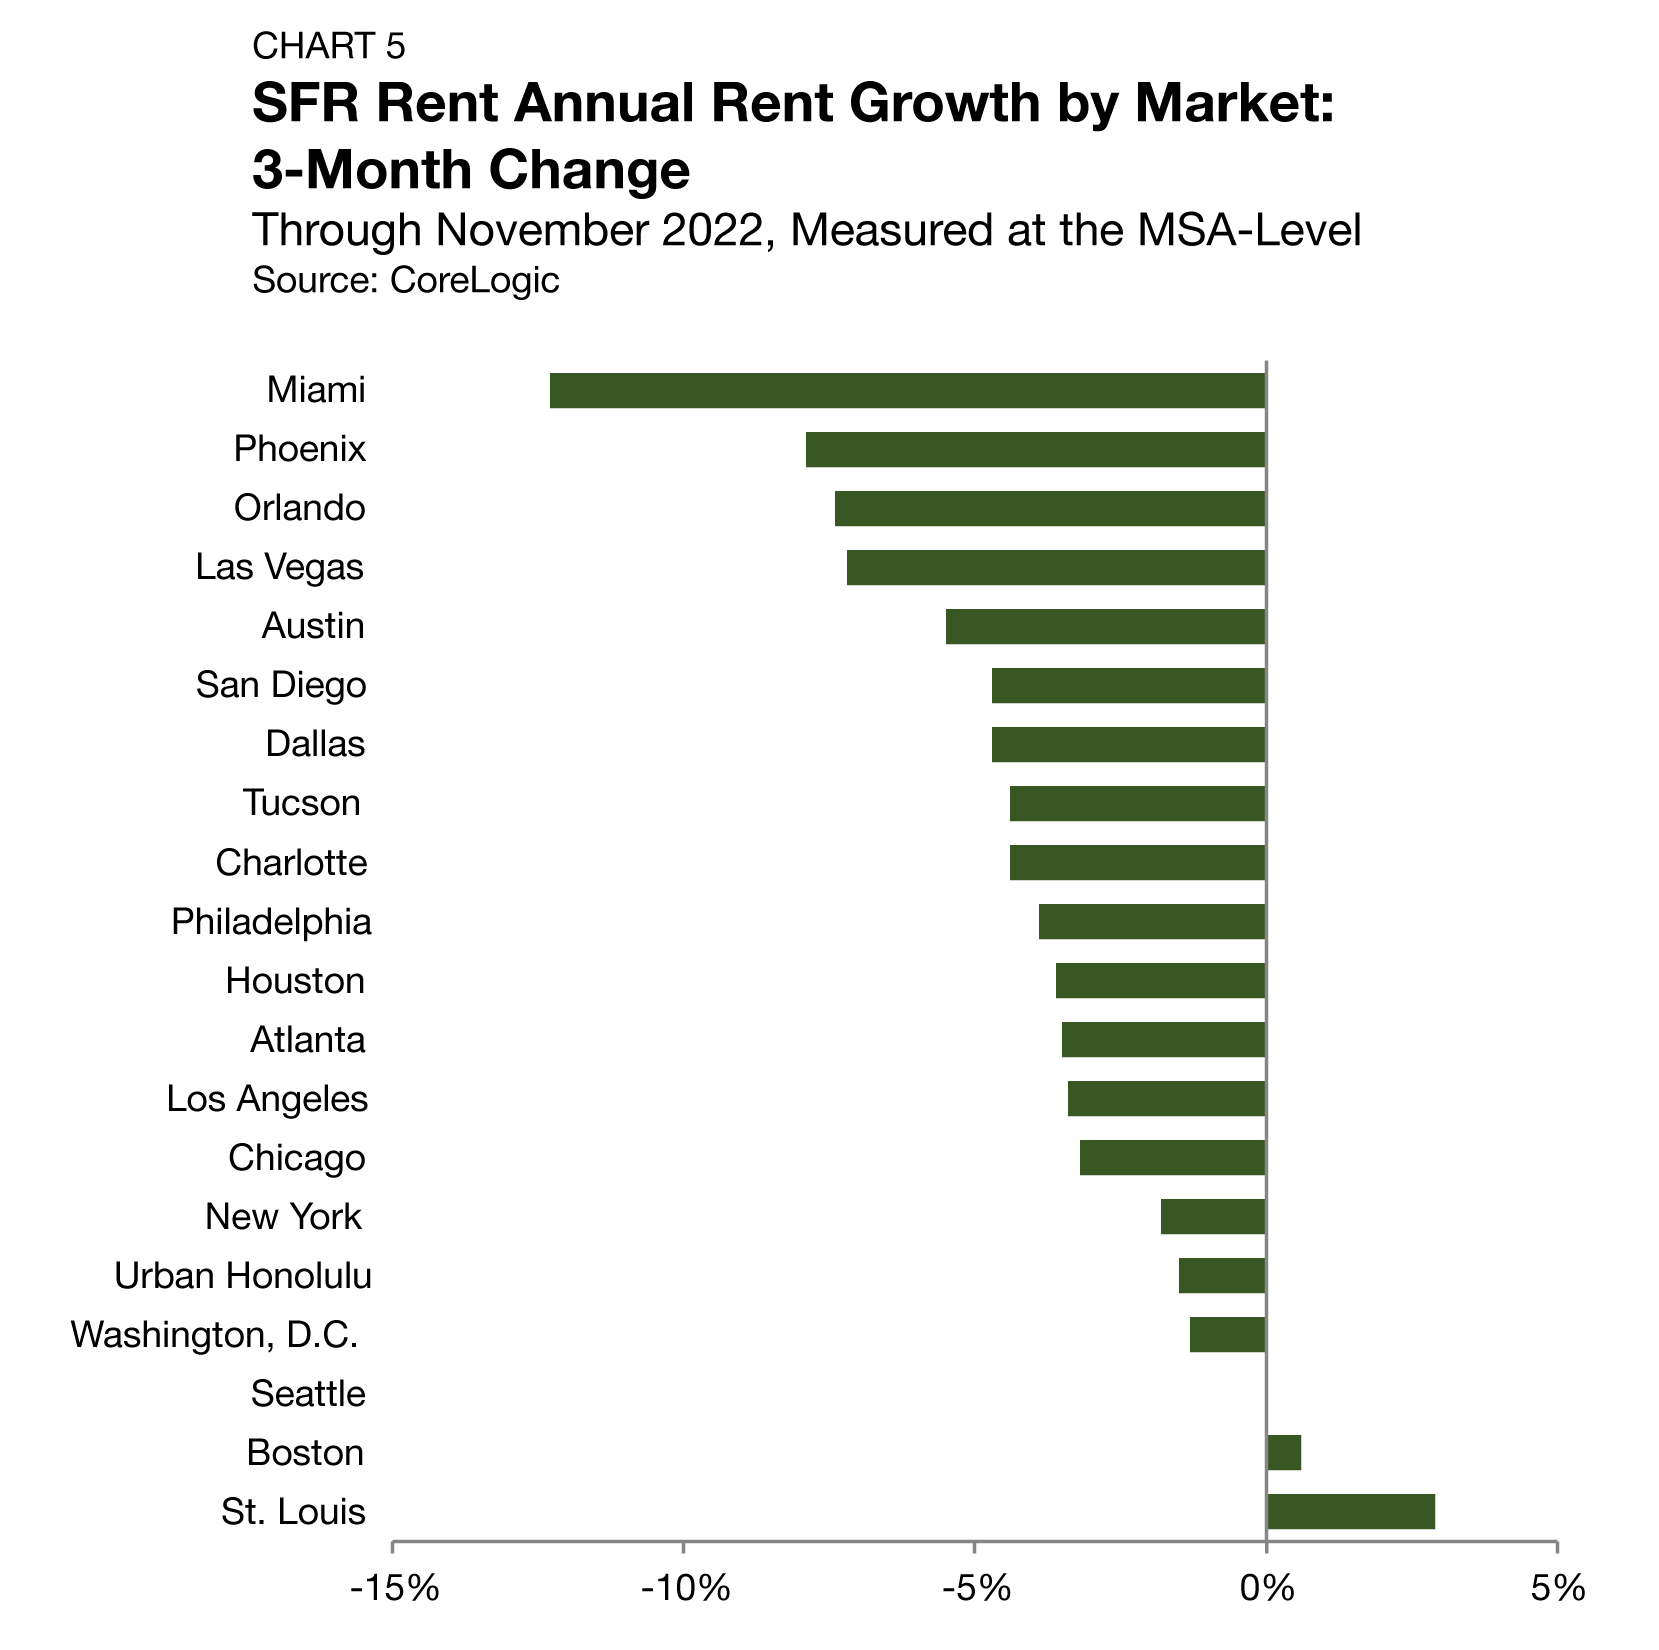
Looking at annual rent growth at the market level, metros in the Sun Belt are seeing some of the sharpest slowdowns in the country. According to CoreLogic’s Single-Family Rent Index (SFRI), Miami and Orlando, two Florida hotspots that continued to see some of the highest annual growth totals in the country through November (12.7% and 13.4%, respectively), are now also seeing a rapid reversion. Compared to three months earlier, Miami’s annual SFR rent growth rate has slowed by 12.3 percentage points. Meanwhile, Orlando has seen its growth rate slow by 7.4 percentage points (Chart 5). Of the 20 markets tracked by CoreLogic, only two (Boston and St. Louis) posted higher annual growth totals in November than three months earlier.
Rent Collections
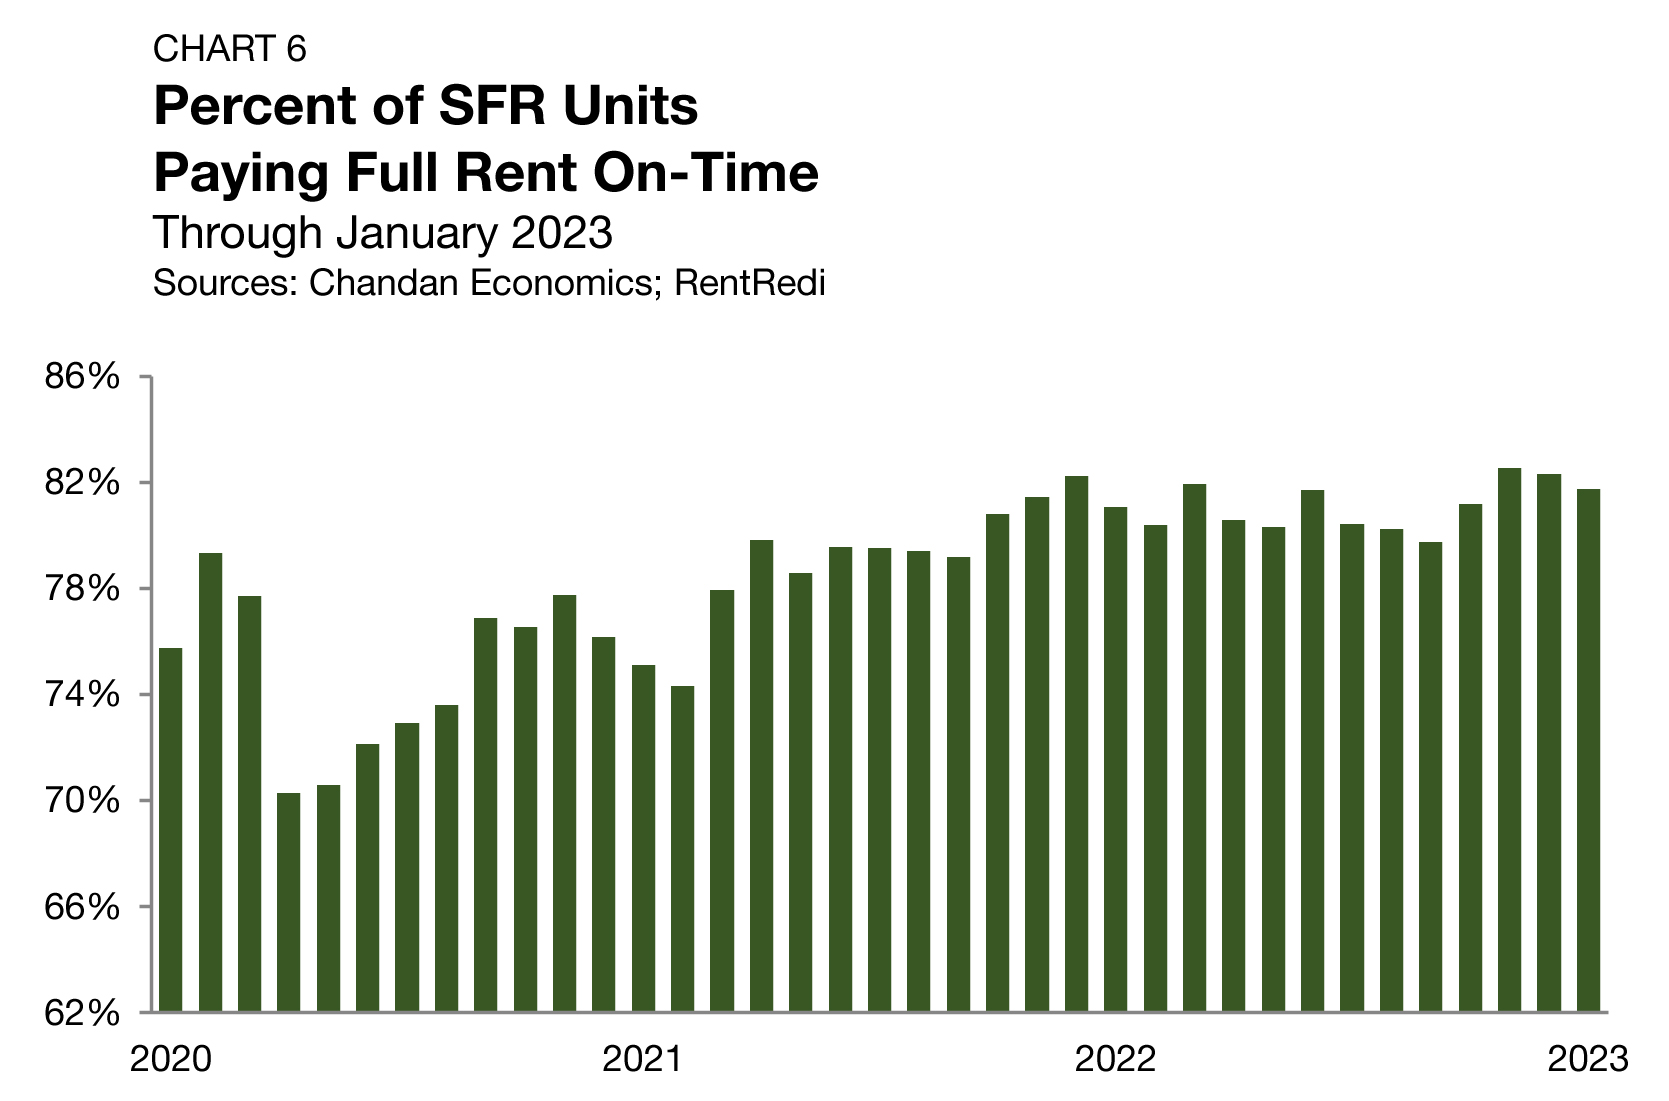
On-time rent payments in SFR properties remain at healthy levels, according to the Independent Landlord Rental Performance Report. In January 2023, an estimated 81.8% of units paid their full rent on time (Chart 6). These on-time payment rates fell as low as 70.6% during 2020 as pandemic-related financial distress was widespread. However, rent collection performance has gradually recovered. For the first time since the onset of the pandemic, on-time payment rates have now held above 81% for four consecutive months, a sign of SFR households’ financial wellness.
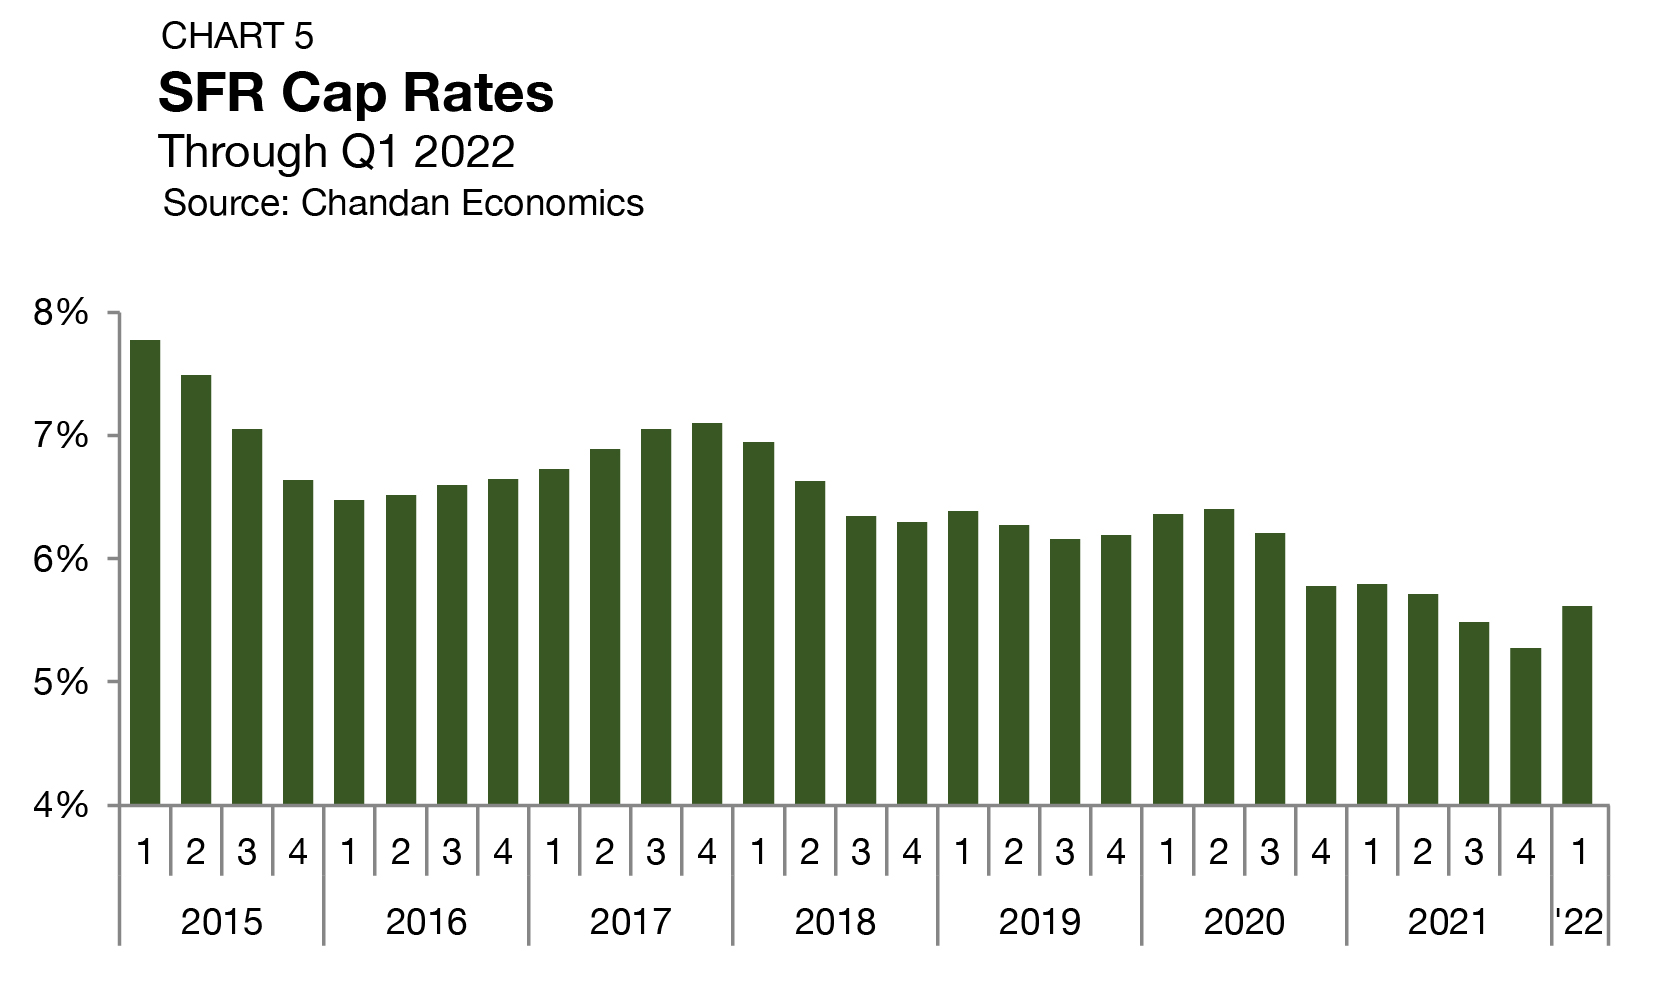
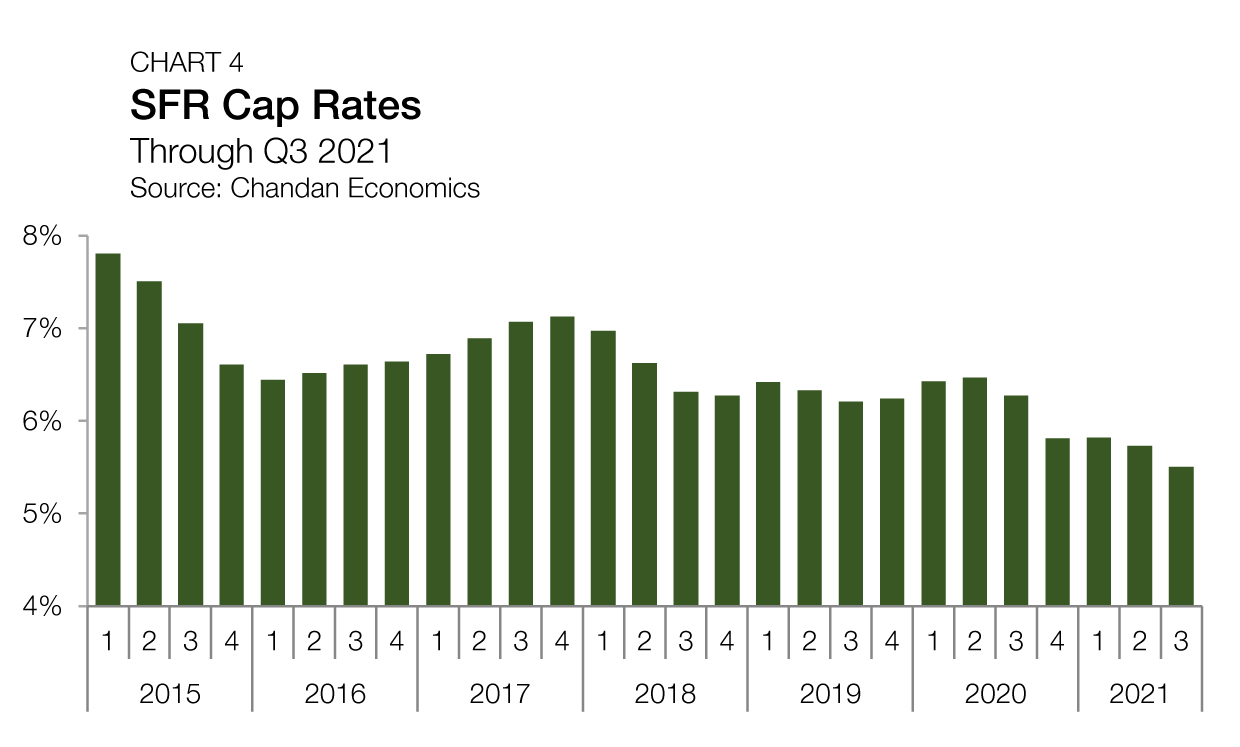
Cap Rates
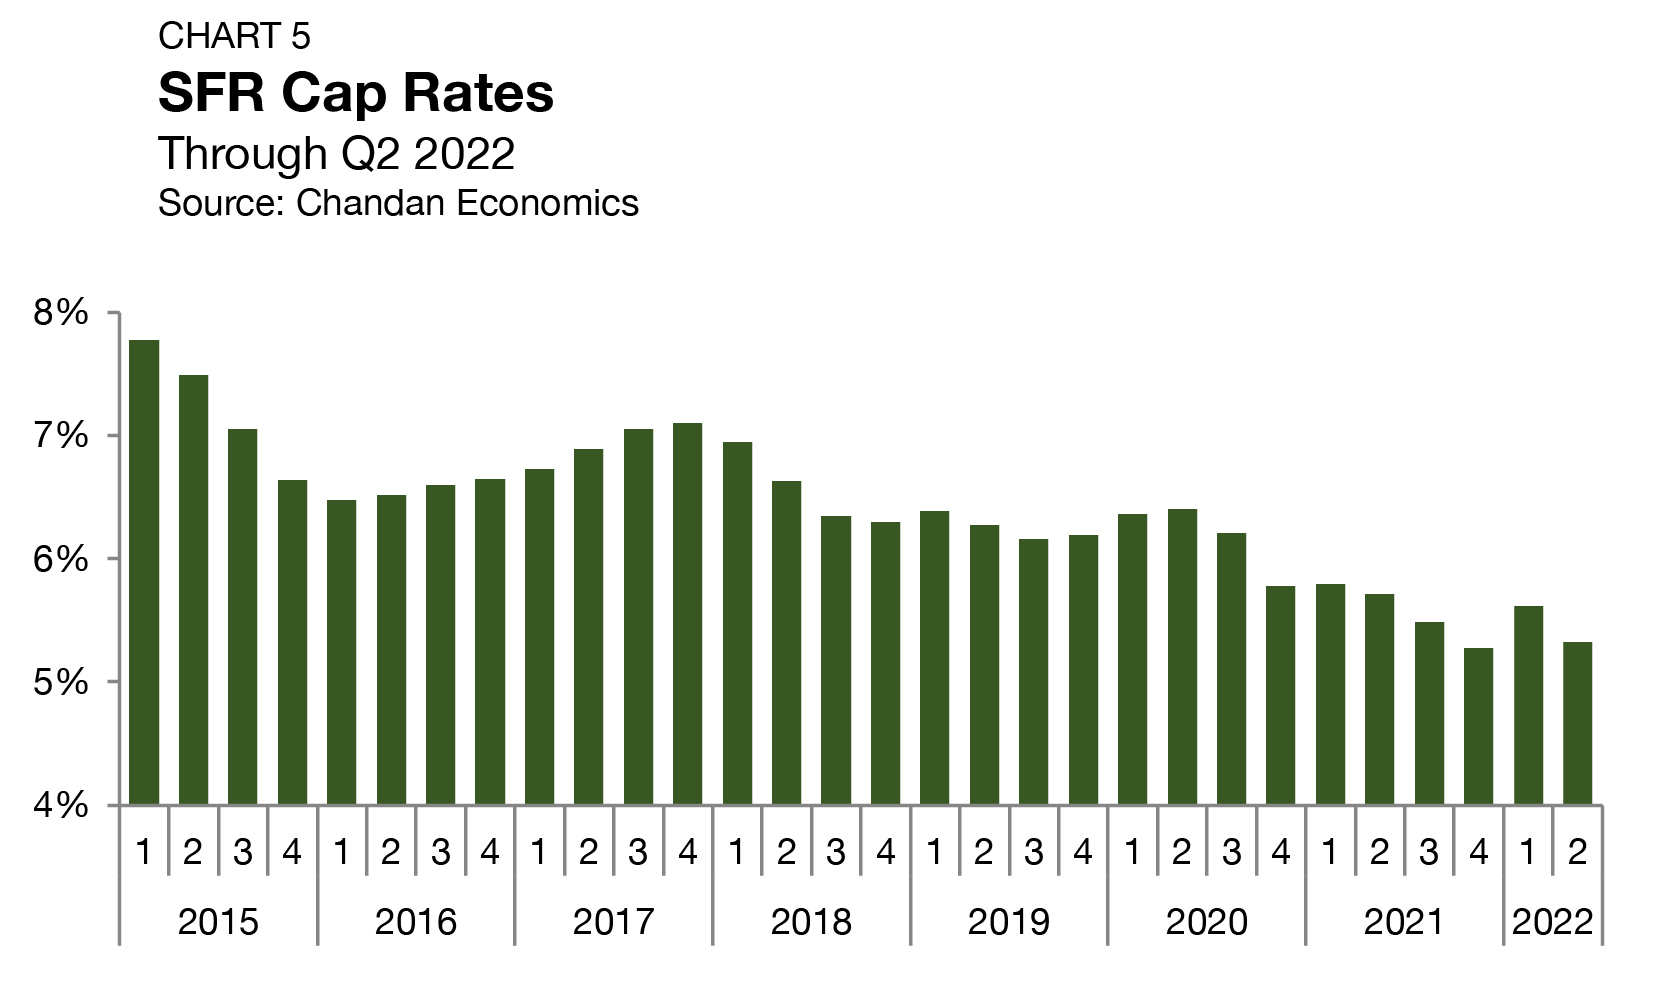
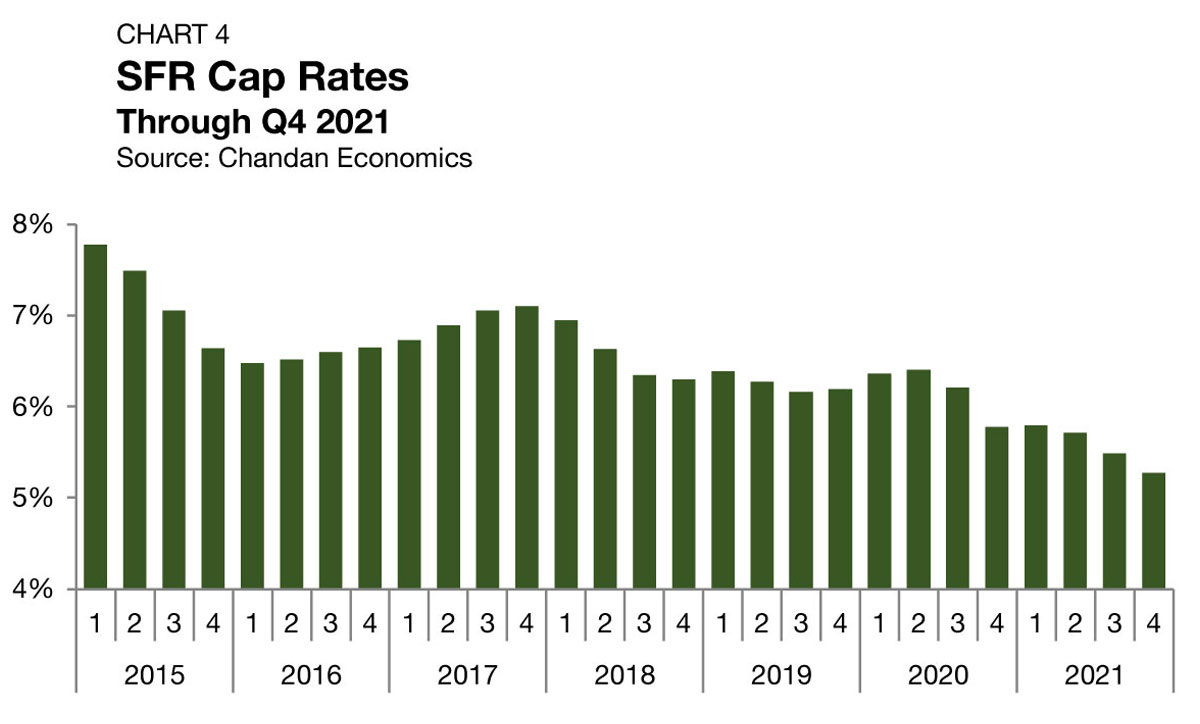
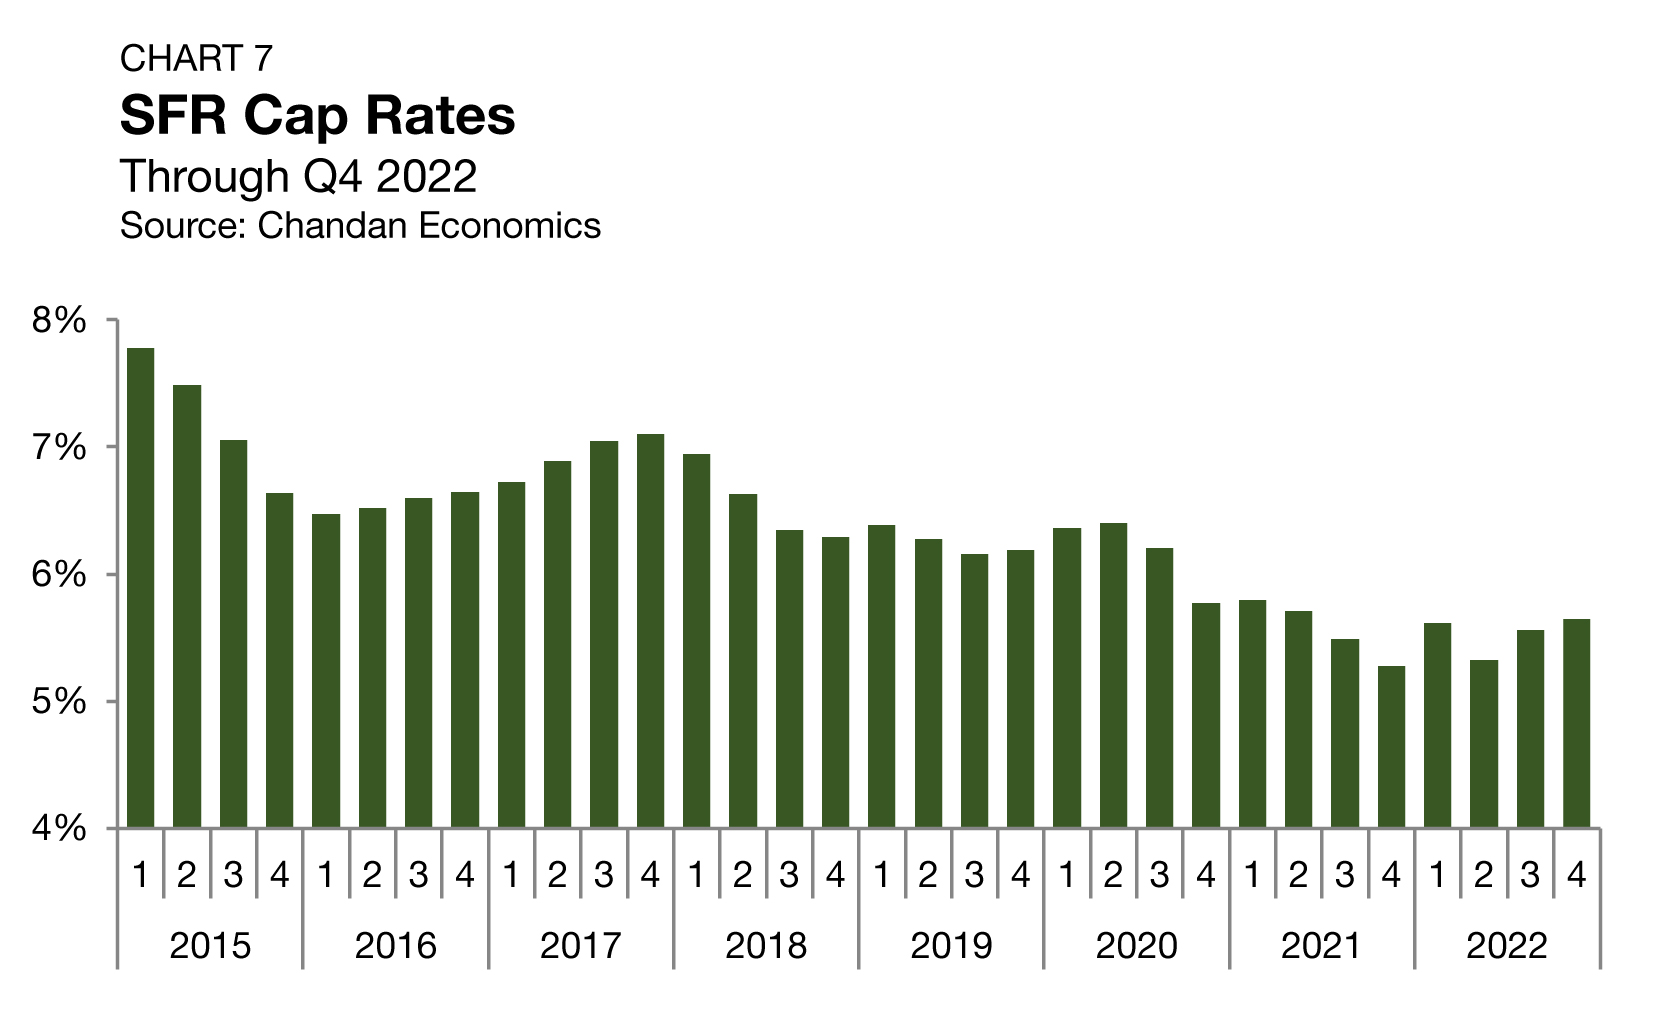
SFR cap rates continued to tick up in the fourth quarter, moving up by another 8 bps, and landing at a rounded 5.6% (Chart 7).1 This was following a 24 bps increase during the previous quarter. Cap rates compressed during the pandemic and its aftermath as single-family home prices appreciated at record-setting rates. As home prices inflected, the impact on cap rates is starting to move in reverse.
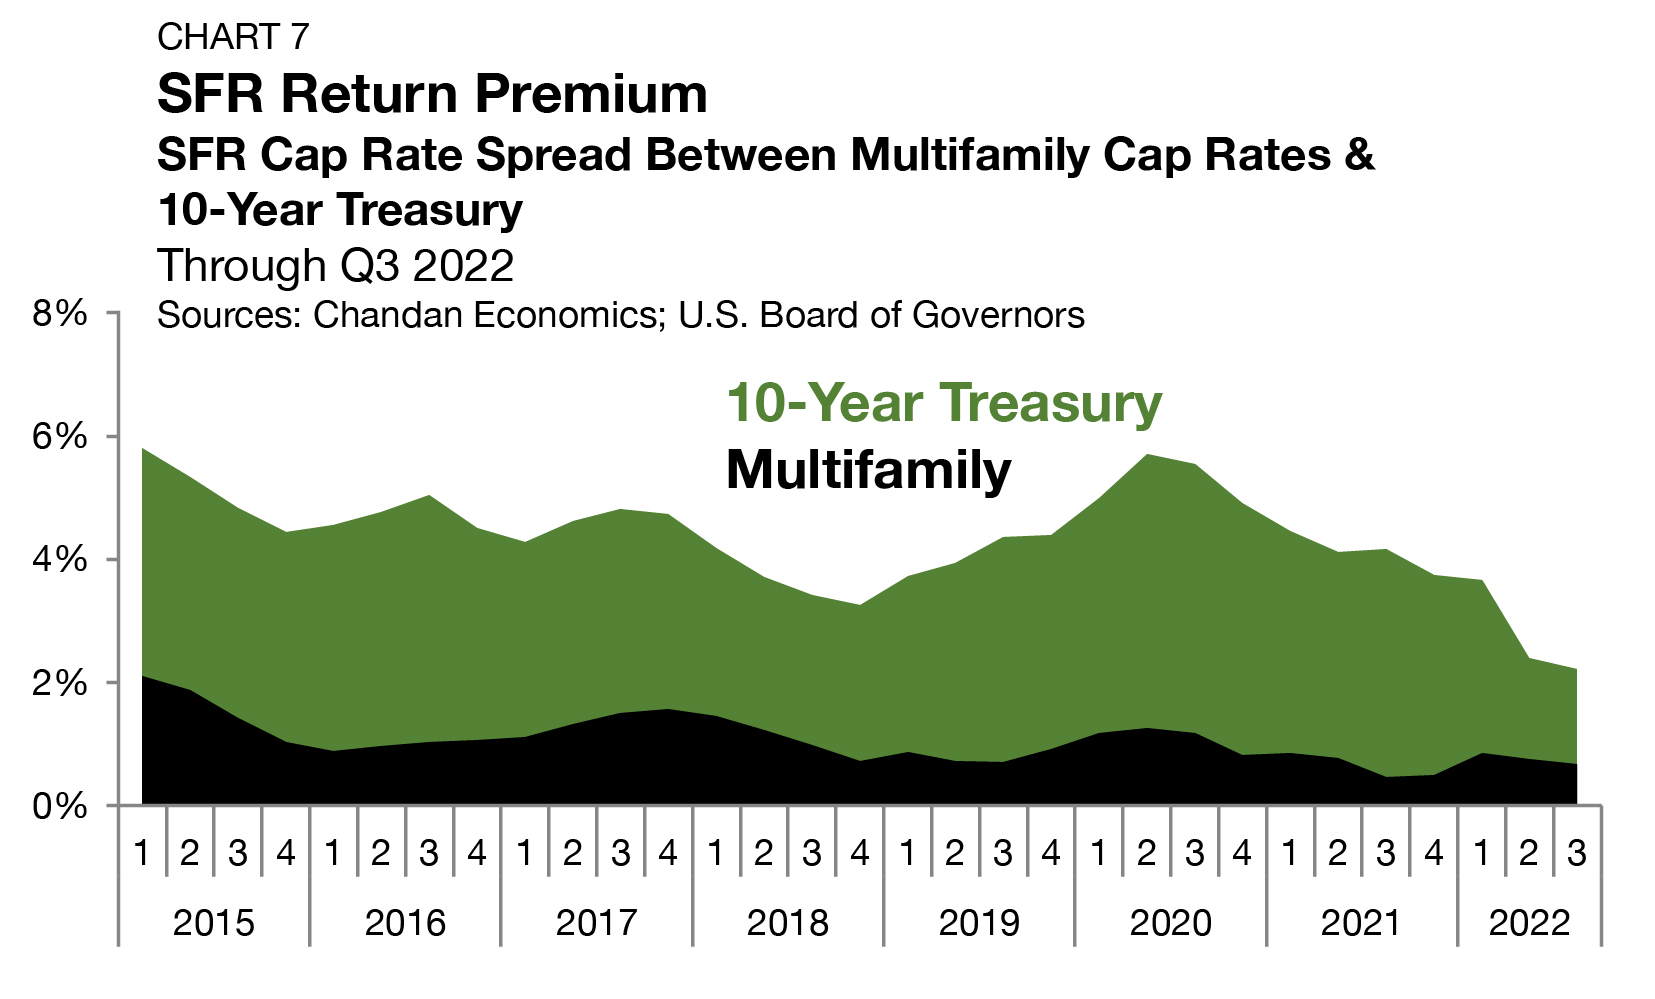
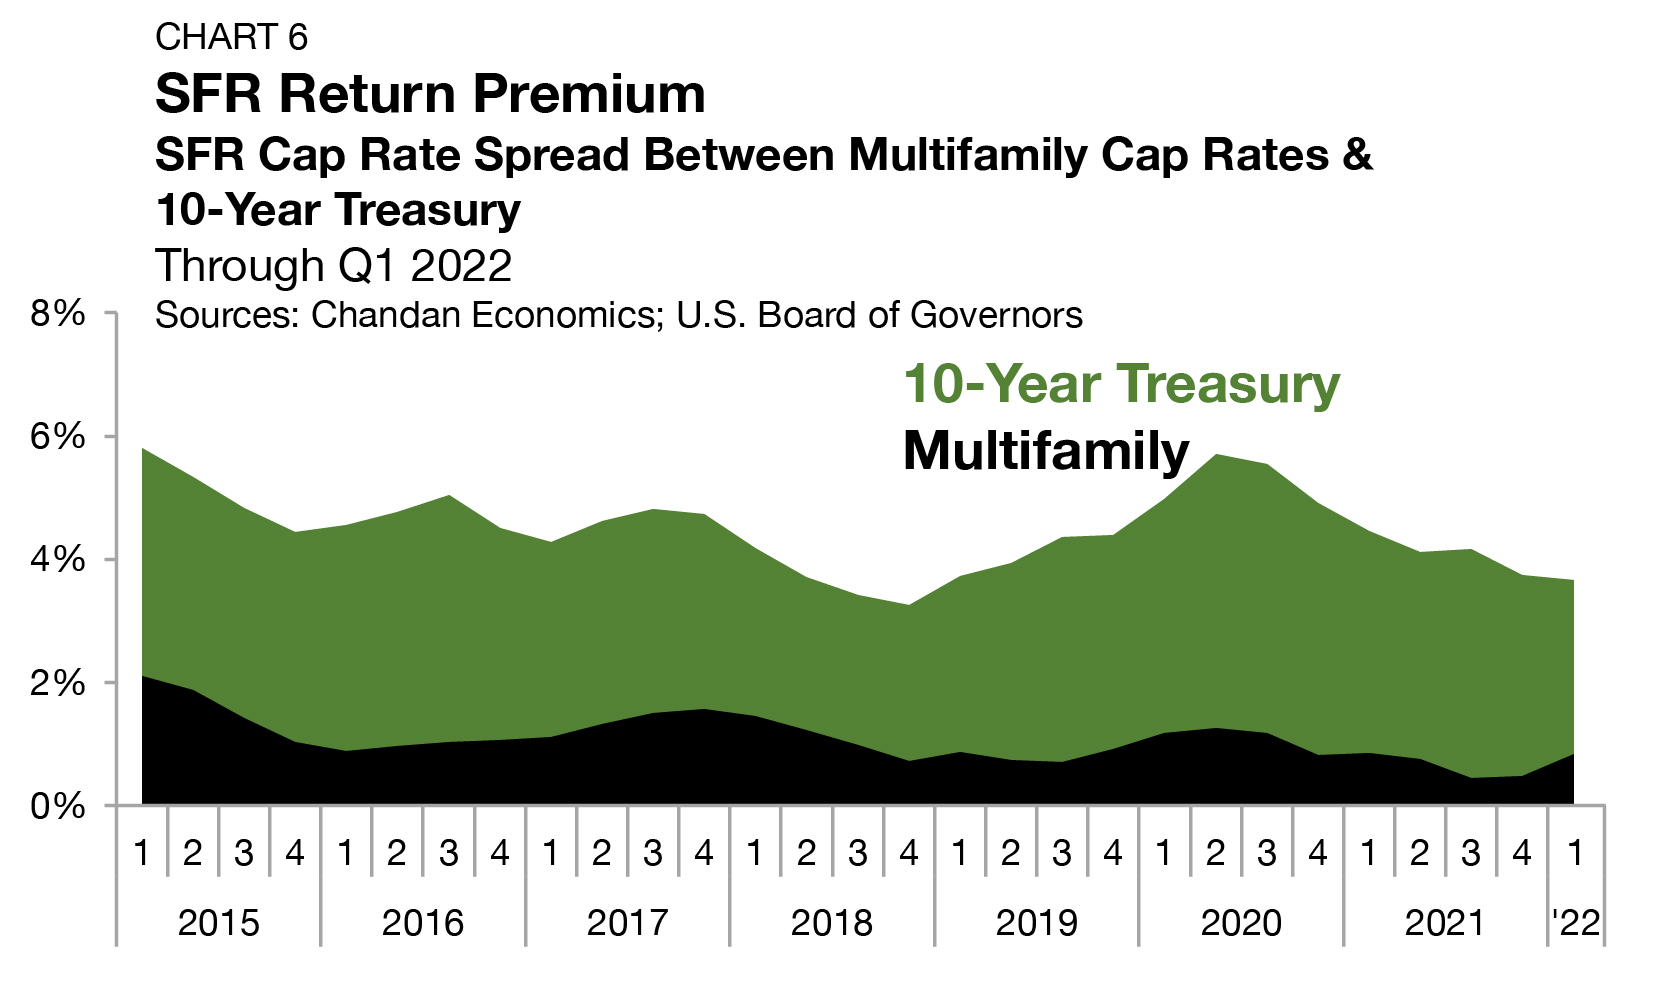
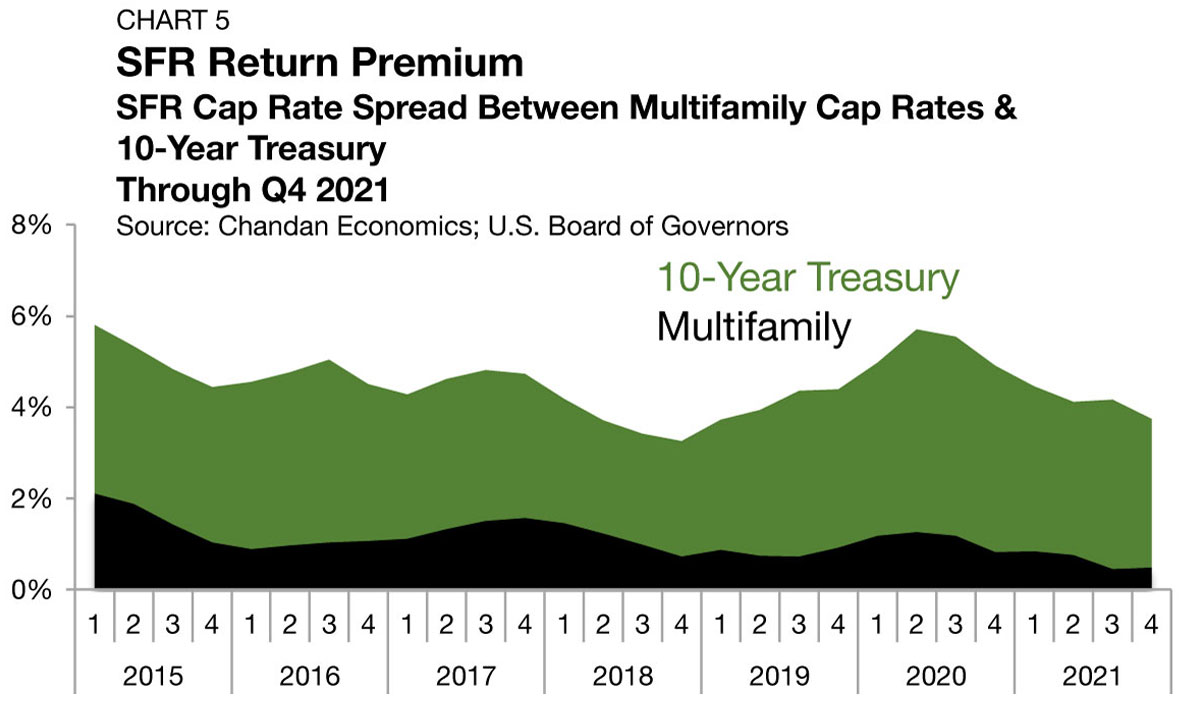
The spread between SFR cap rates and 10-year Treasury yields approximates the SFR risk premium. Despite SFR cap rates rising in the third and fourth quarters of 2022, Treasury yields have jumped more quickly. As a result, the risk premium has continued to narrow, falling to a new all-time low of 181 bps in the fourth quarter of 2022 (Chart 8). Compared to one year ago, this risk premium has more than halved, shaving off 193 bps in that time.
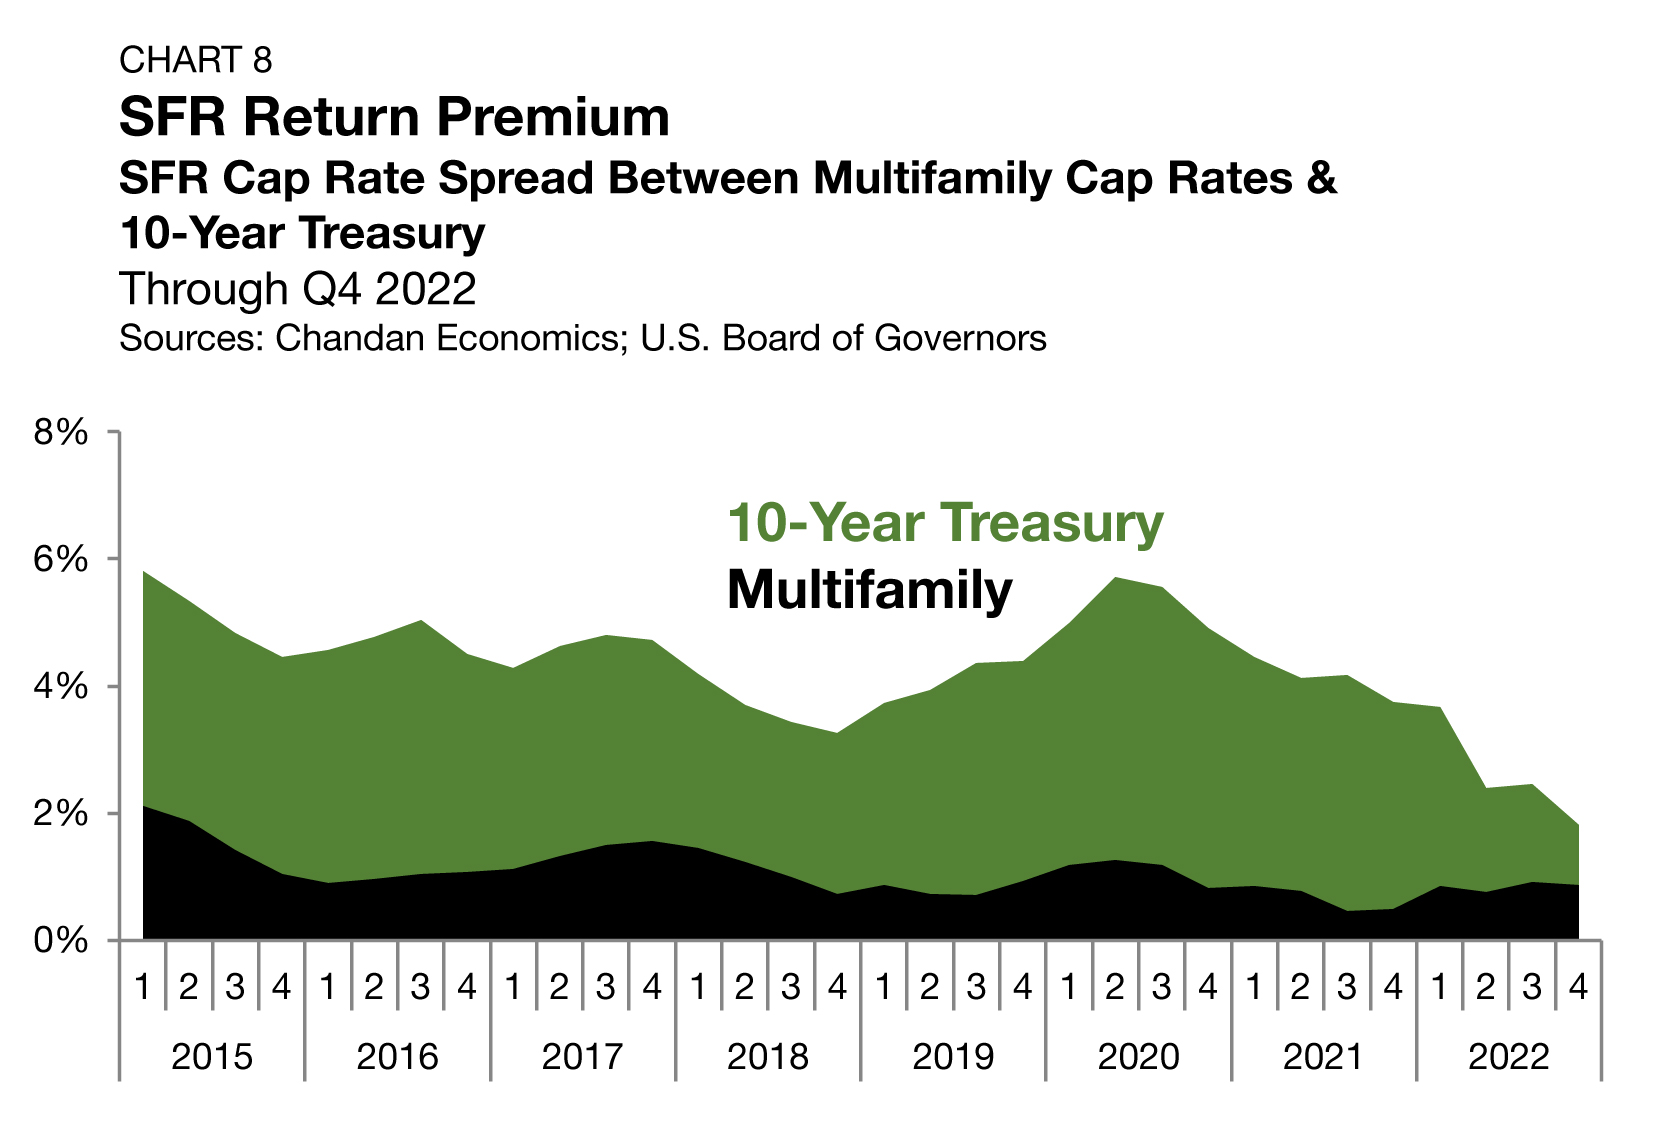
Meanwhile, the spread between SFR and multifamily properties has seen far less volatility in recent quarters. The SFR/multifamily spread declined by 5 bps in the fourth quarter, landing at 87 bps. In the aftermath of the 2019 housing crisis, SFR/multifamily spreads stood as high as 496 bps. However, over the past decade, the risk profiles of the two product types have come closer to parity. Since the end of 2020, the spread has bounced between 50 bps and 100 bps — a stable range where it remains today.
Pricing
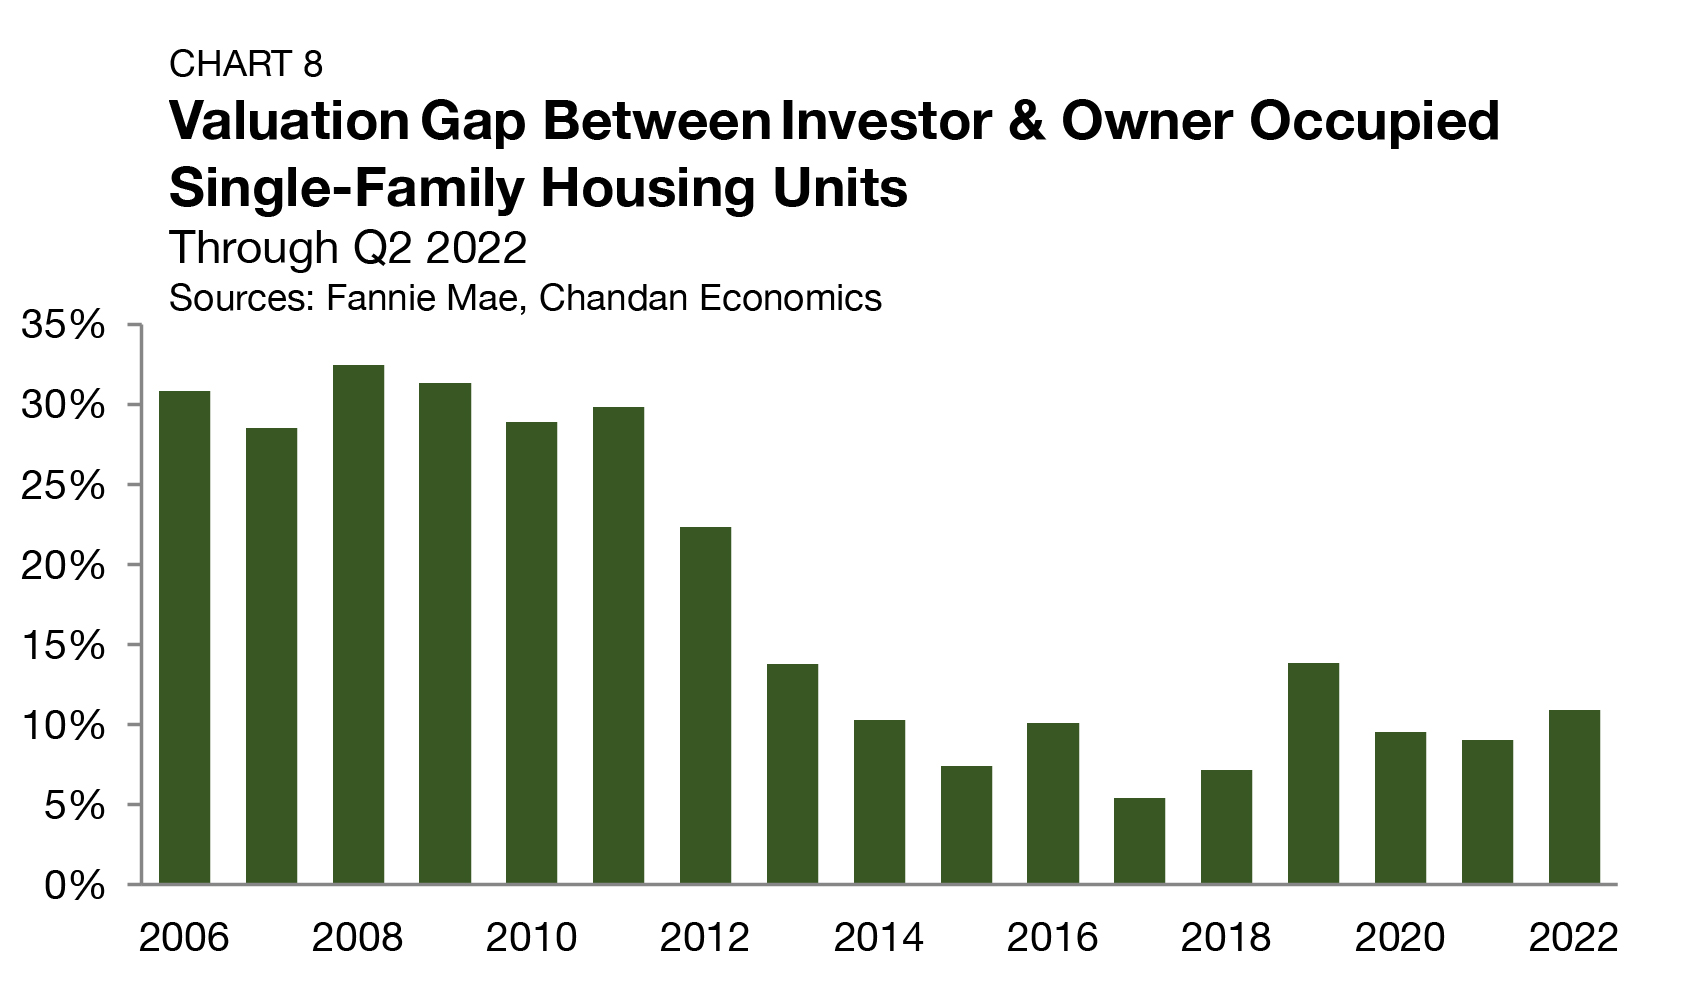
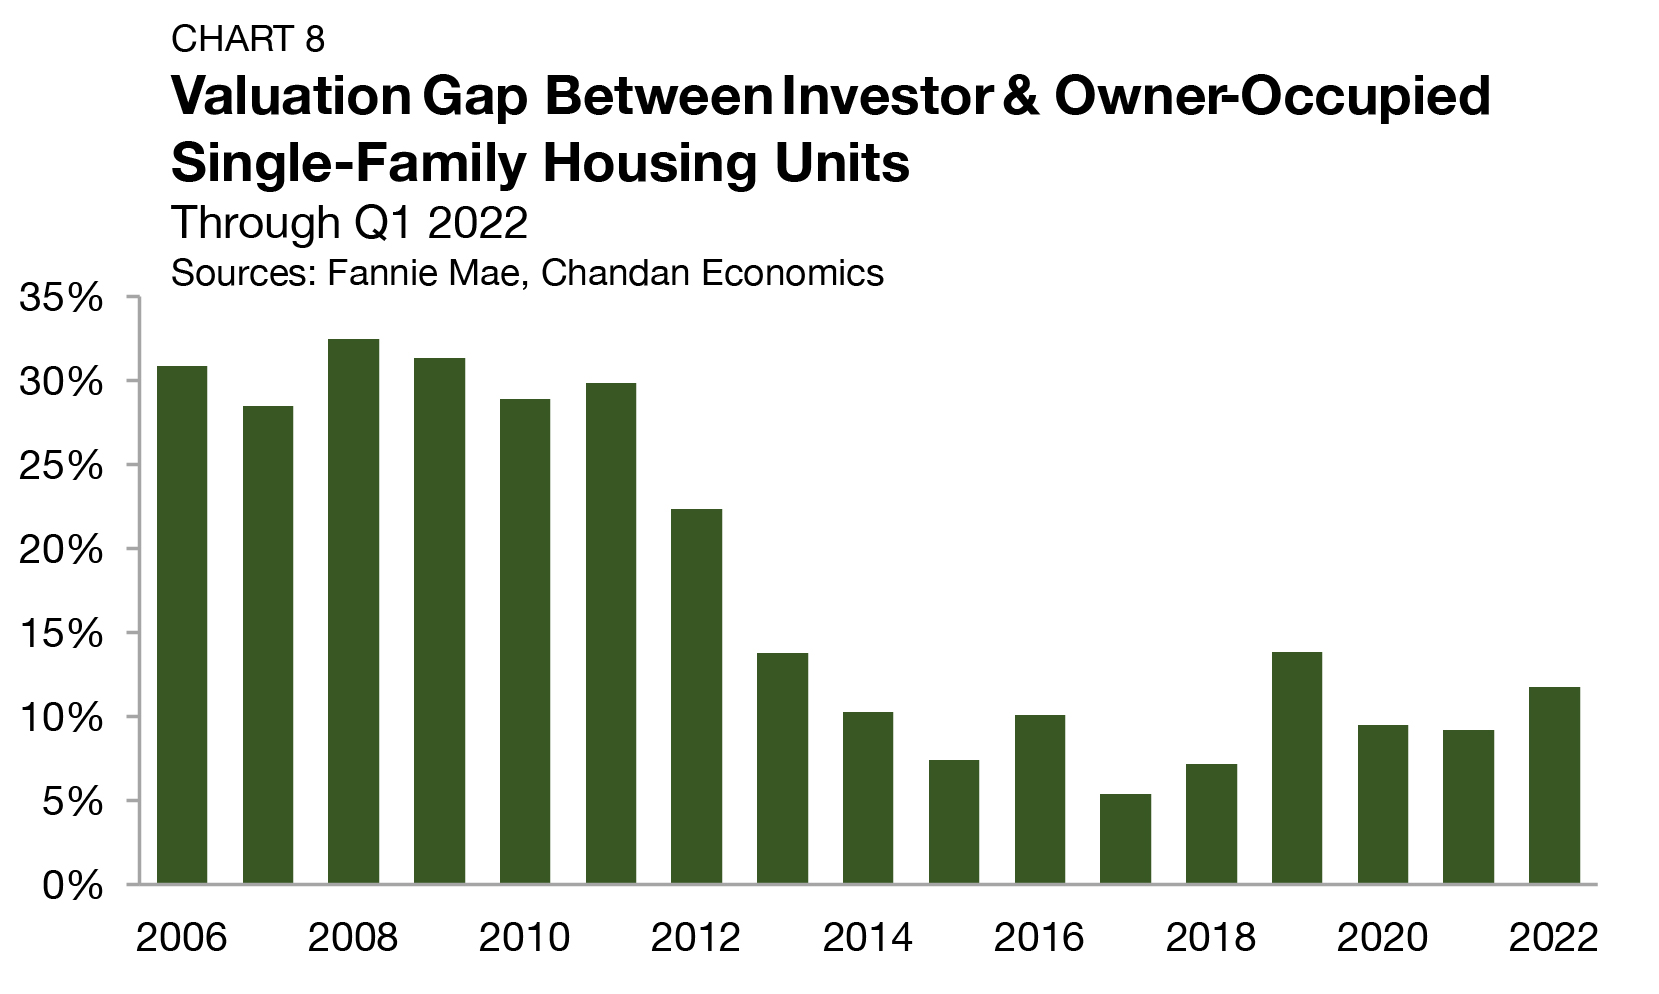
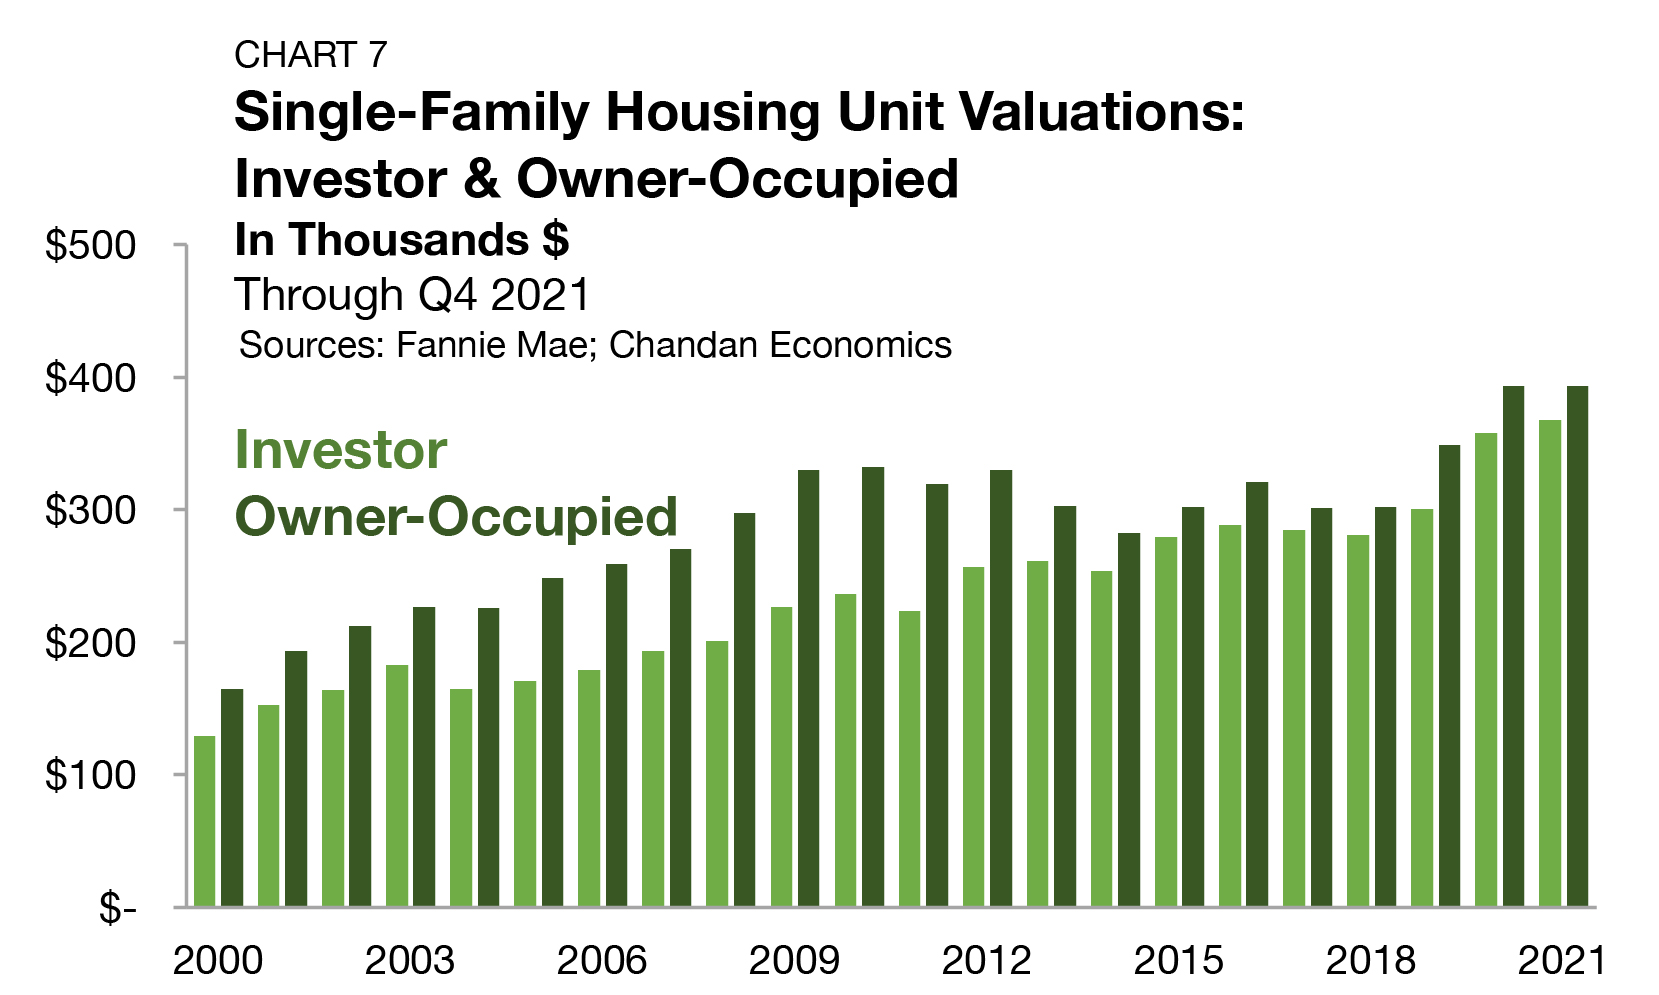
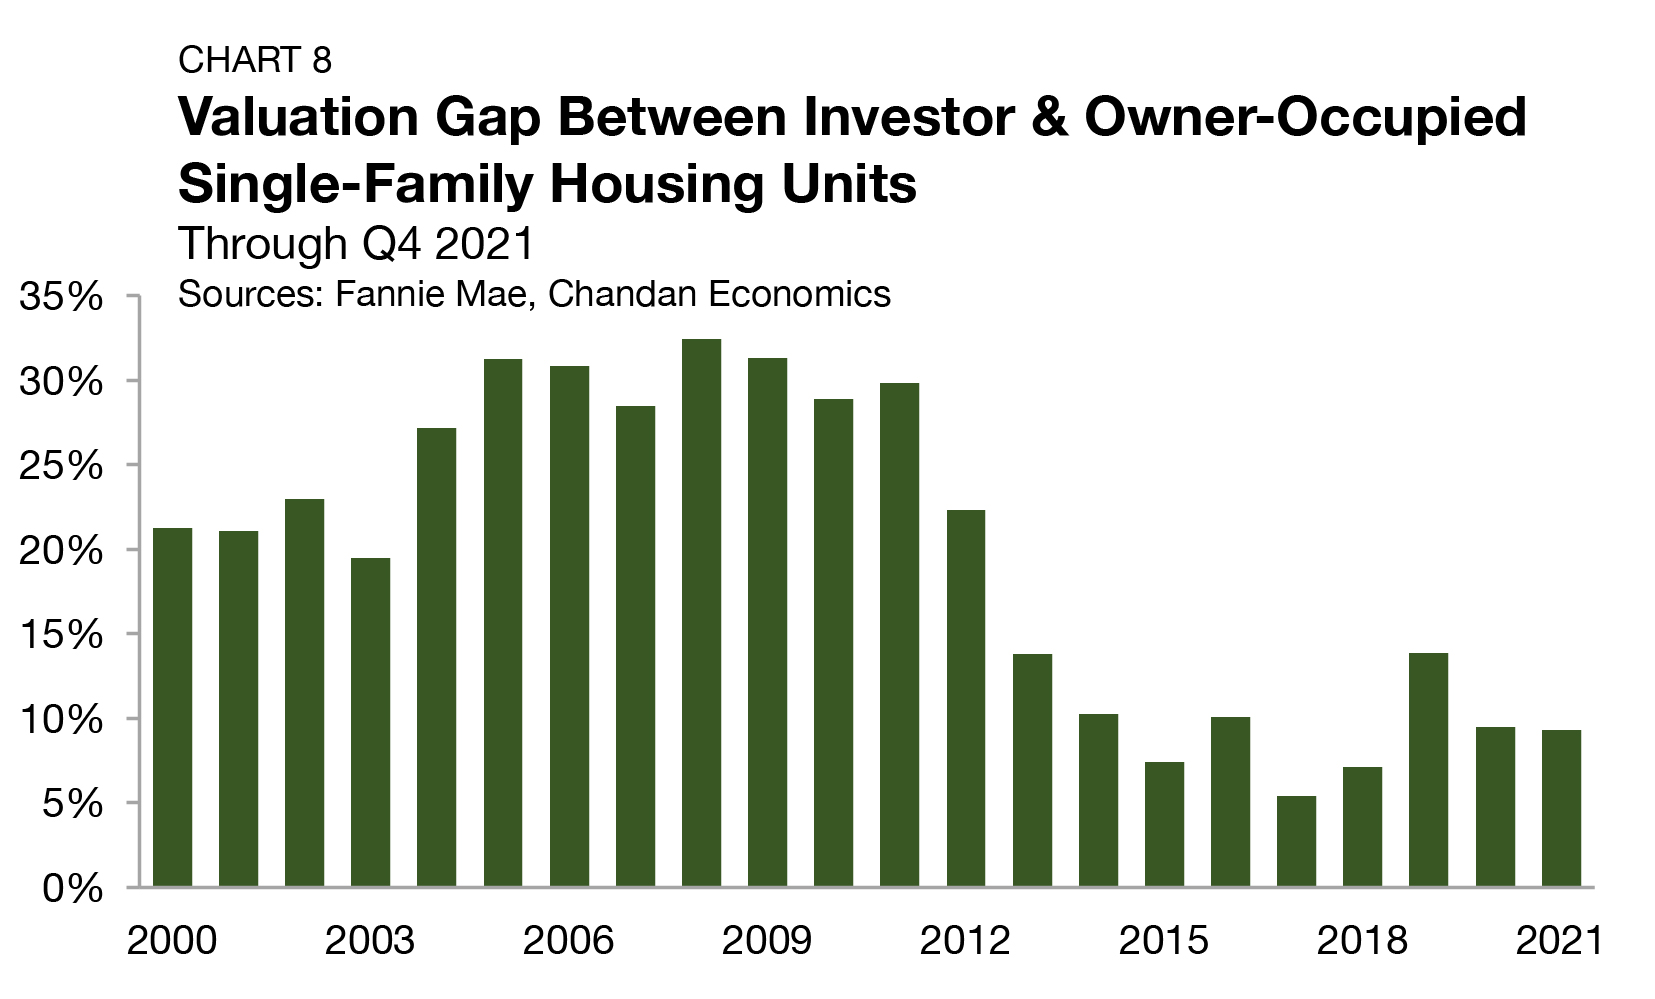
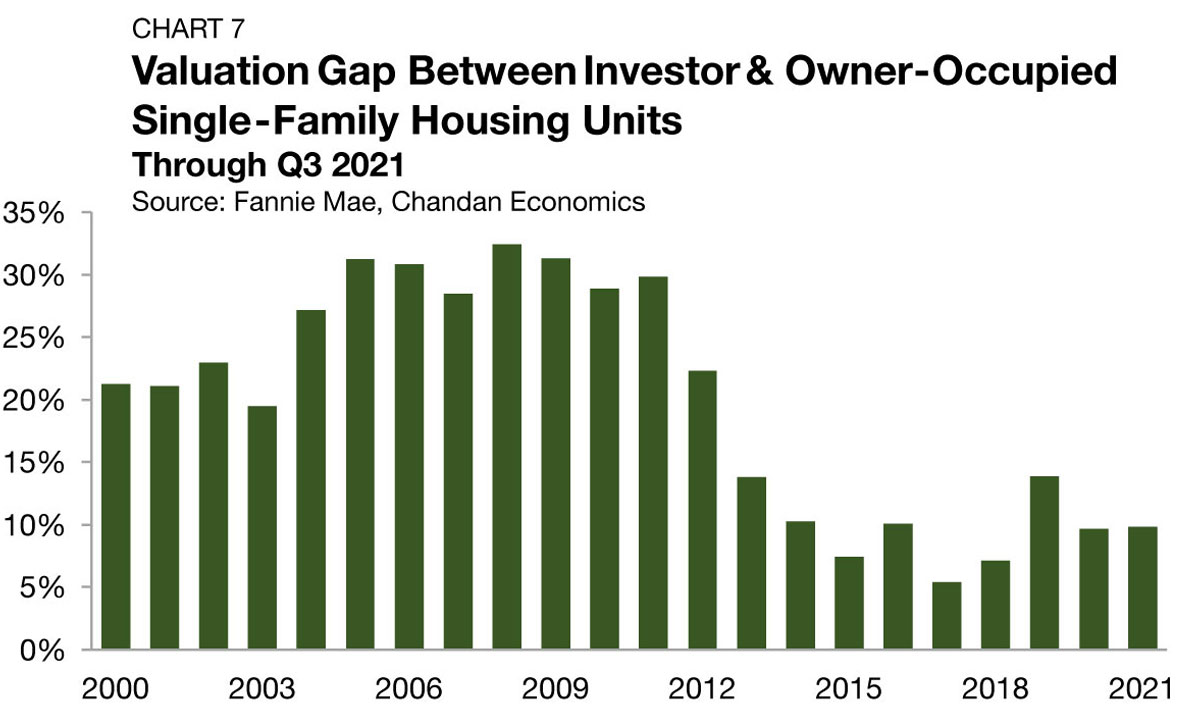
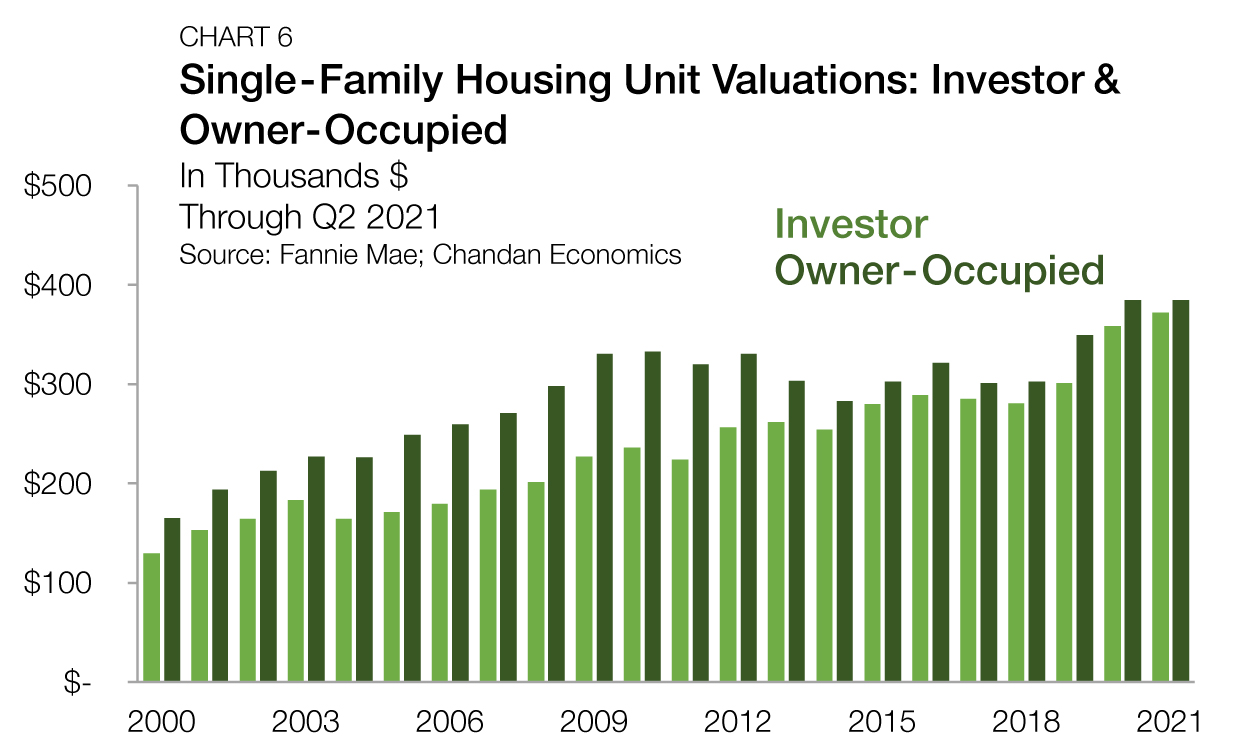
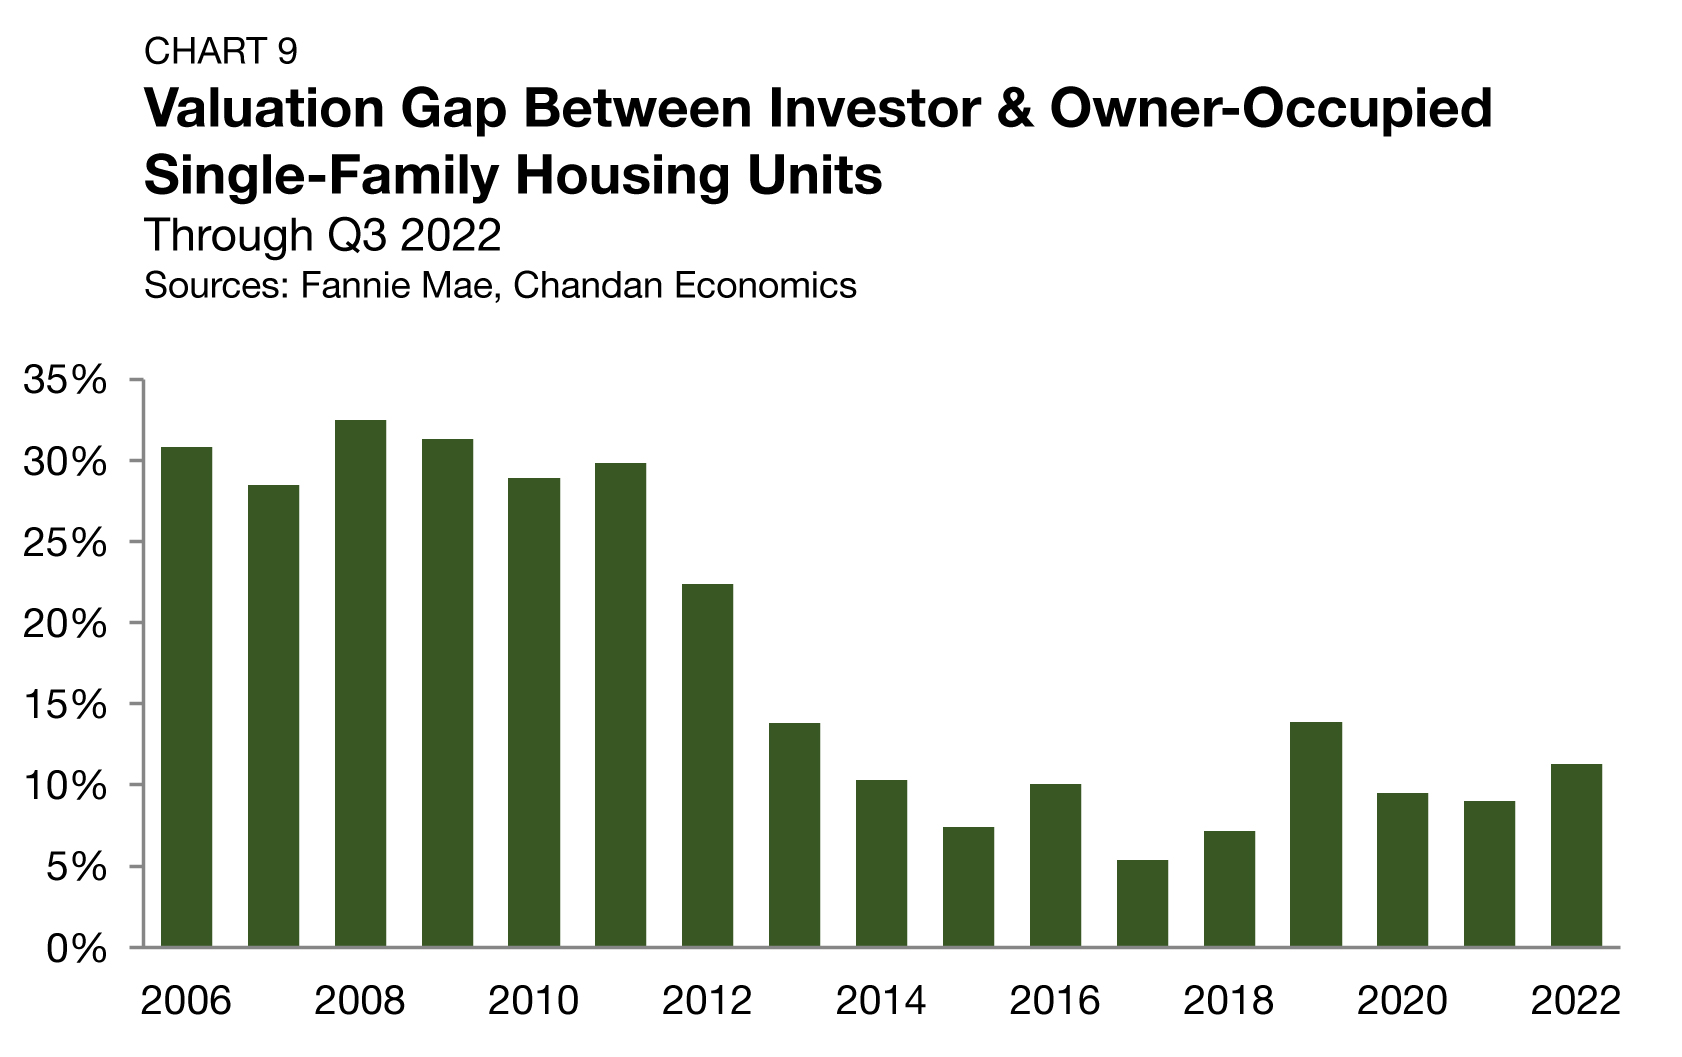
There have been consistent differences between the average assessed property values on mortgages originated to single-family owner-occupants versus single-family investors since 2006. This disparity incentivizes investors to target value-add assets rather than paying top dollar for value that already exists. Additionally, investor-owned SFR properties have vacancies, turnover, and management-related expenses that owner-occupied units do not have, contributing to lower values for the rental units.
Nevertheless, the gap has narrowed dramatically over the past decade, coming down from above 30% in the aftermath of the 2008 financial crisis to the 10% range where it sits today, according to an analysis of Fannie Mae securitized mortgages. The valuation gap averaged 11.3% in 2022, rising 229 bps from its 2021 average (Chart 9).
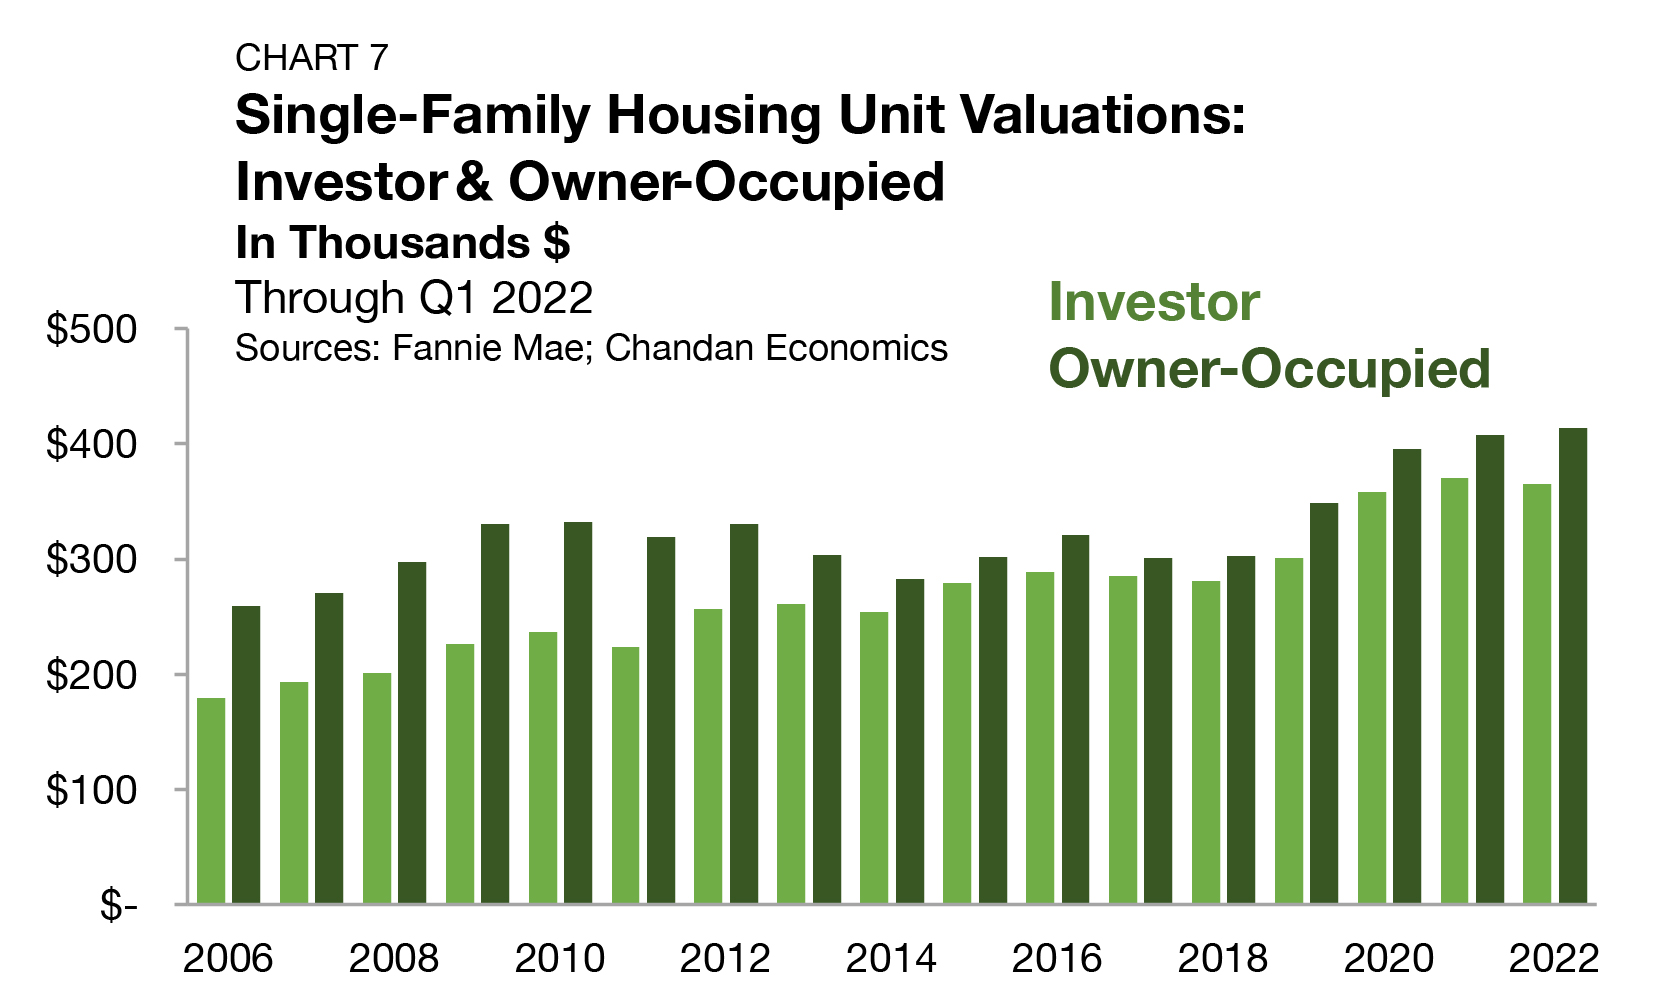
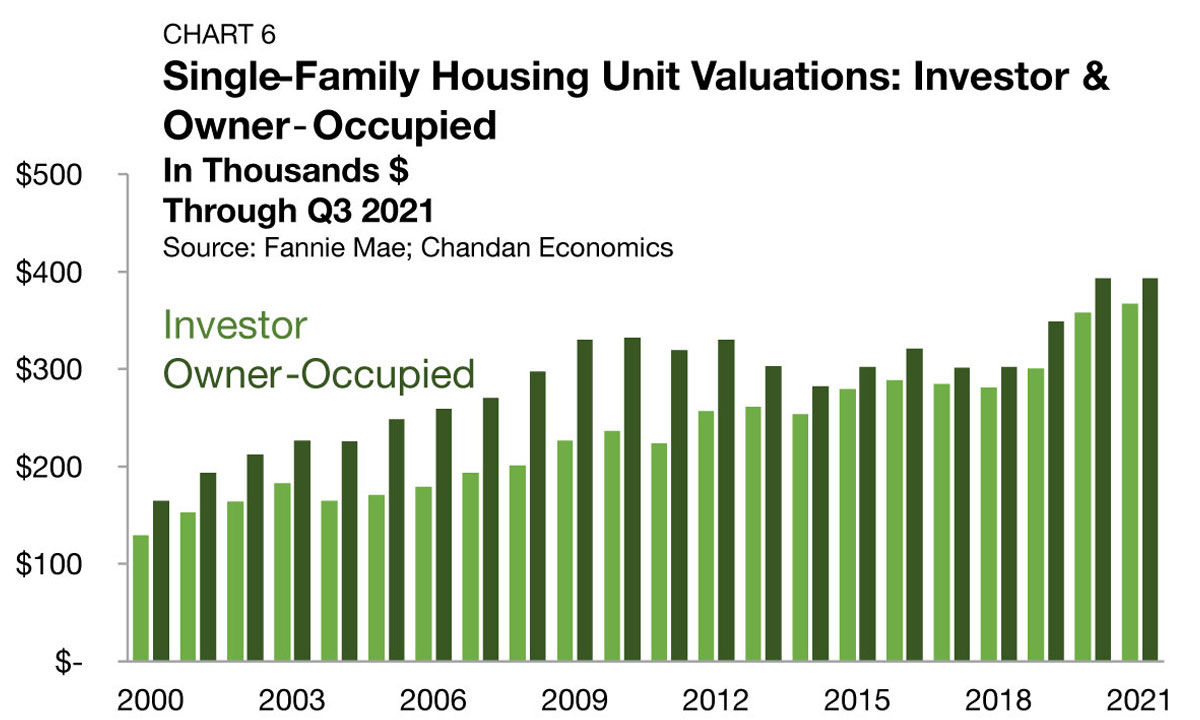
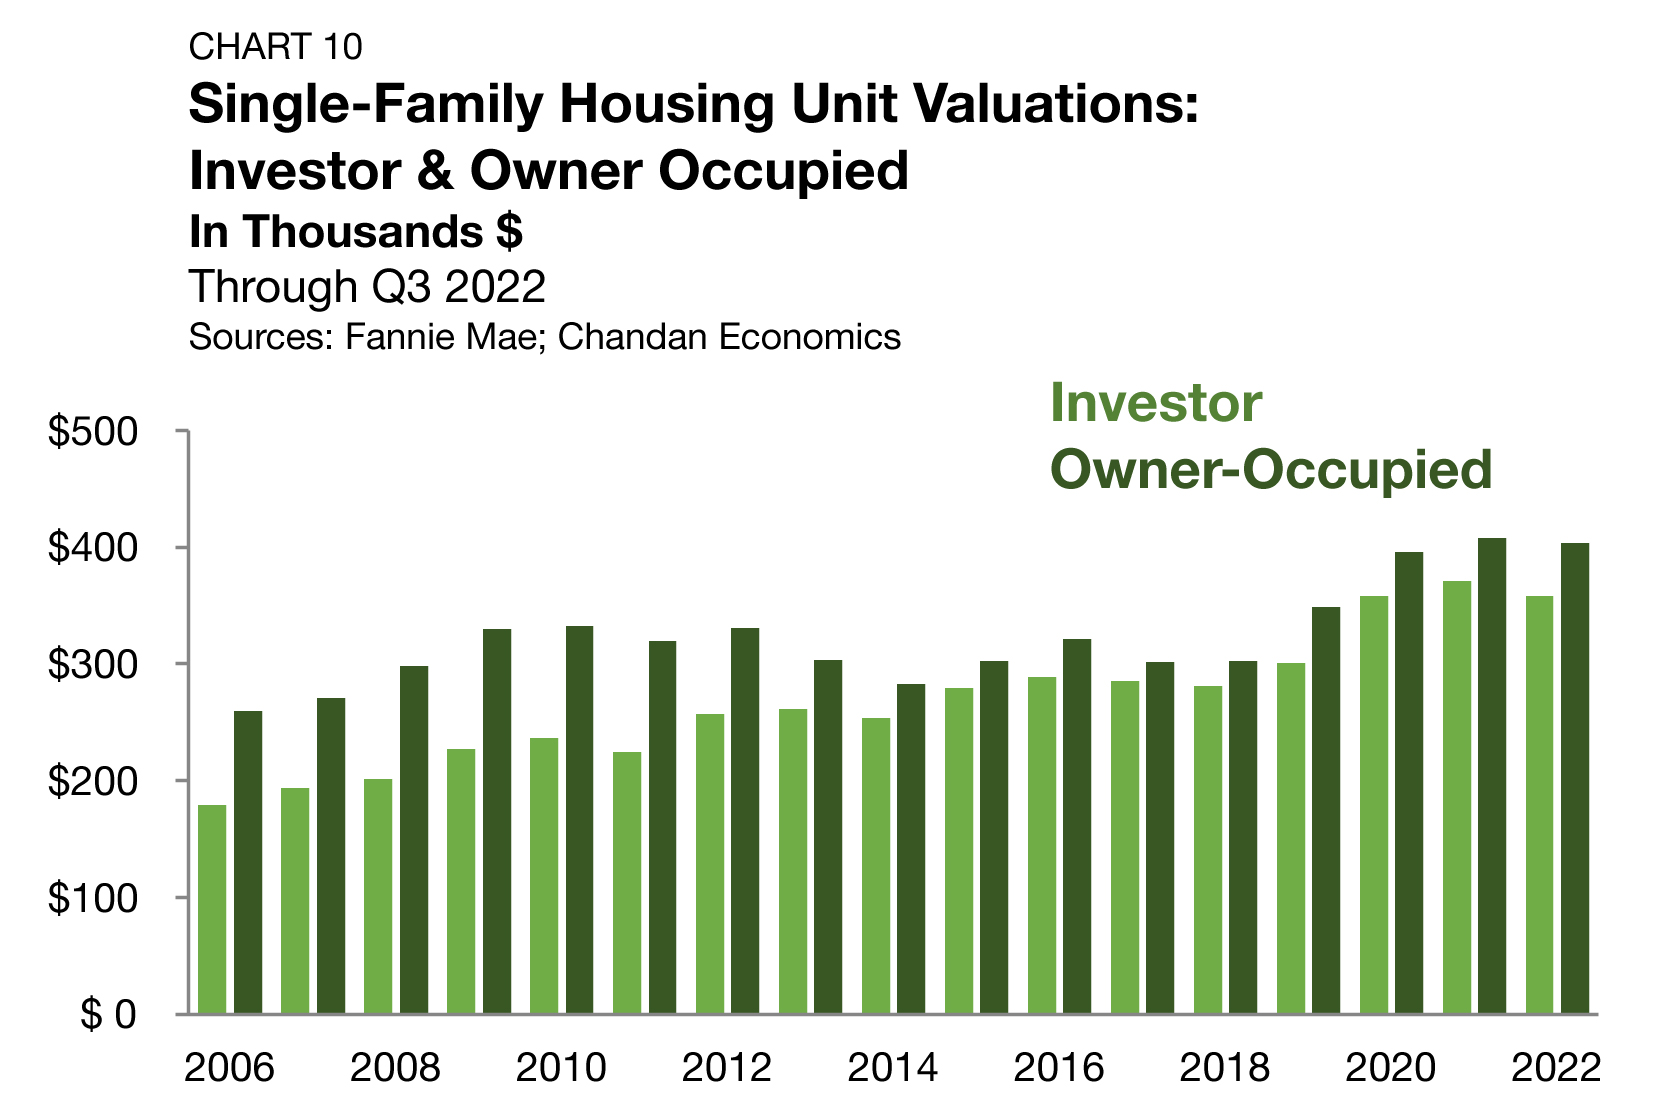
A slight annual increase in the valuation gap has emerged as valuations across all single-family properties have declined this year. The average underwritten value of a single-family investment property through the third quarter of 2022 was $358,019, a drop-off of 3.5% from the 2021 average. Owner-occupied units hold an average underwritten valuation of $403,511 in 2022, down 1.0% from the year prior (Chart 10).
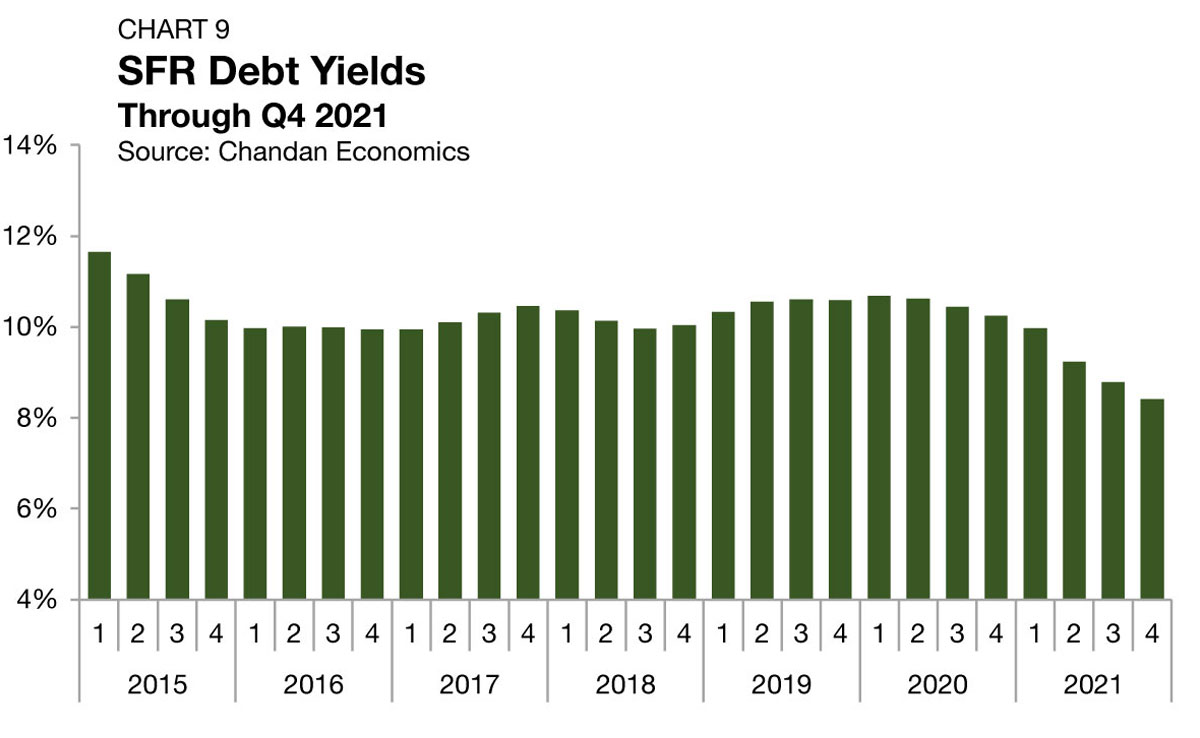
Debt Yields
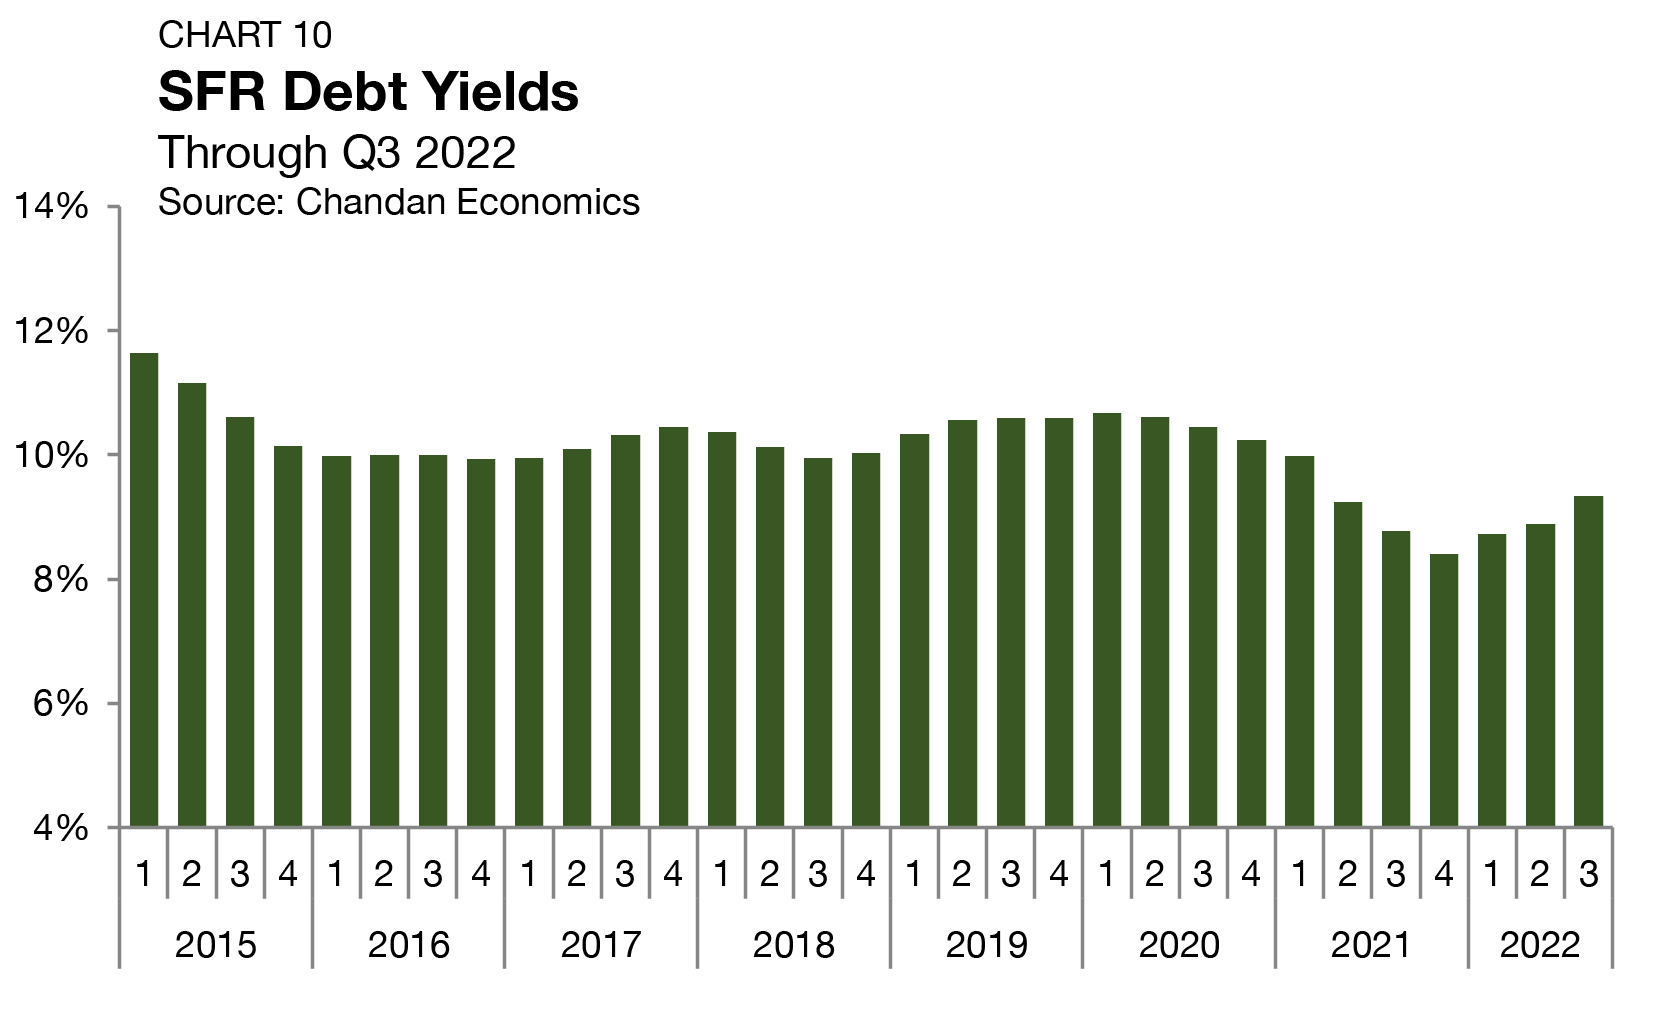
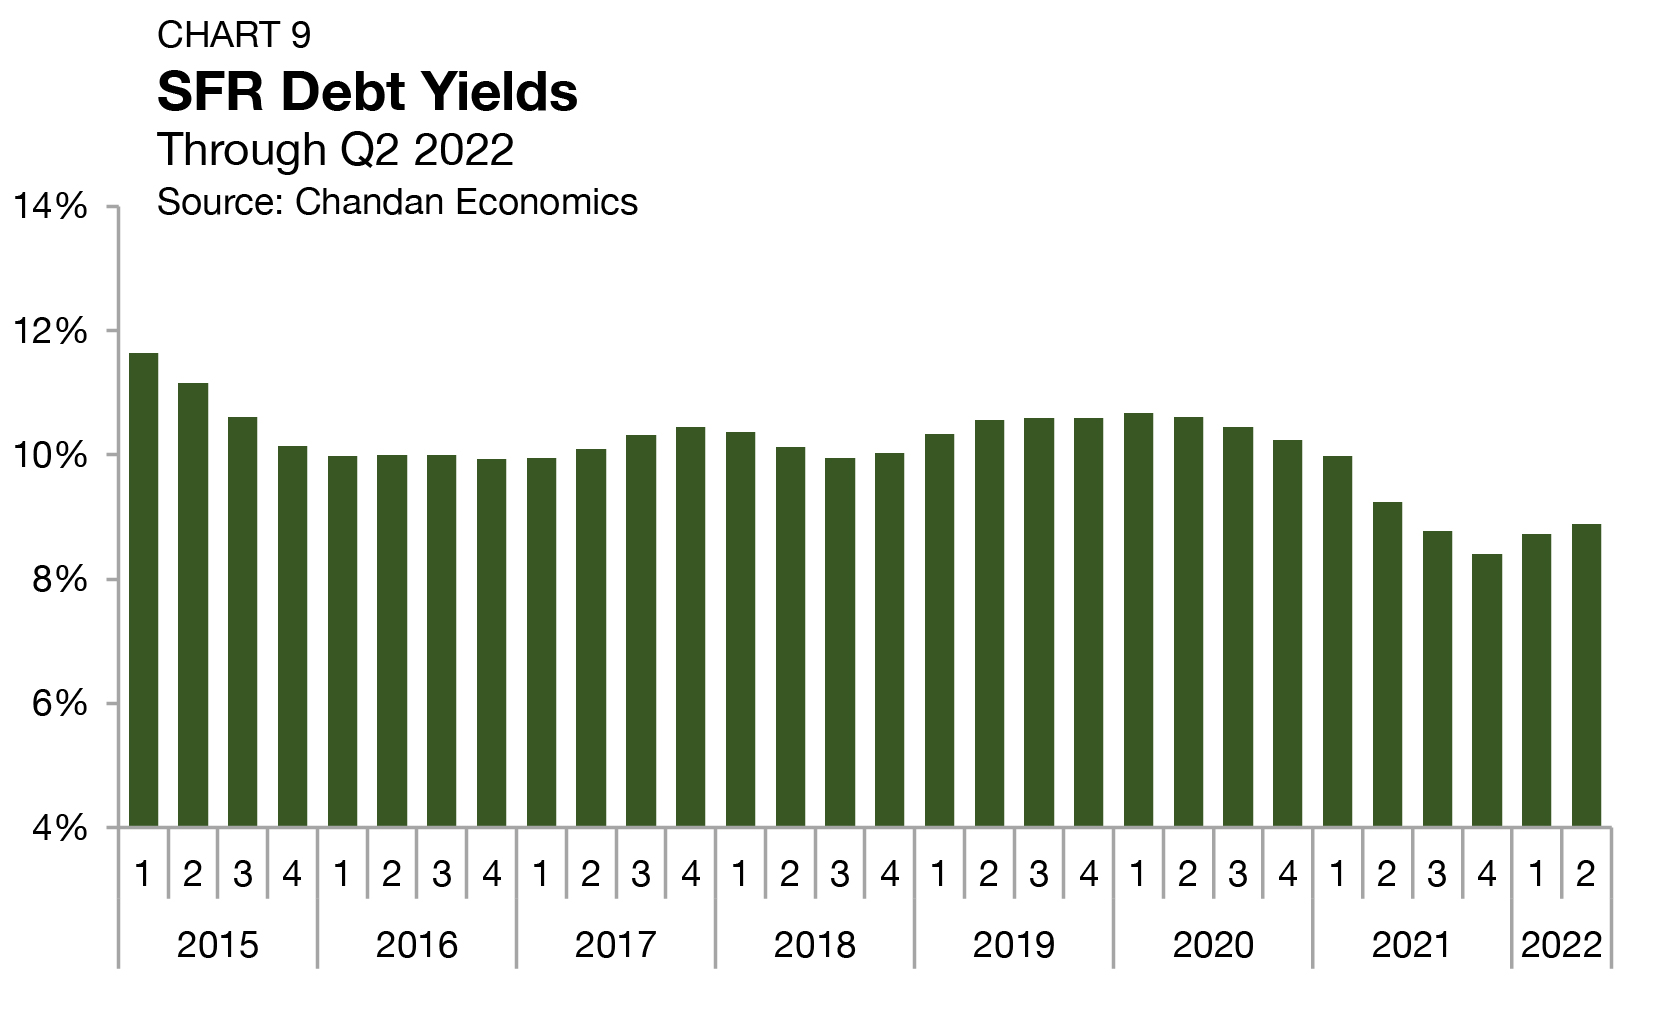
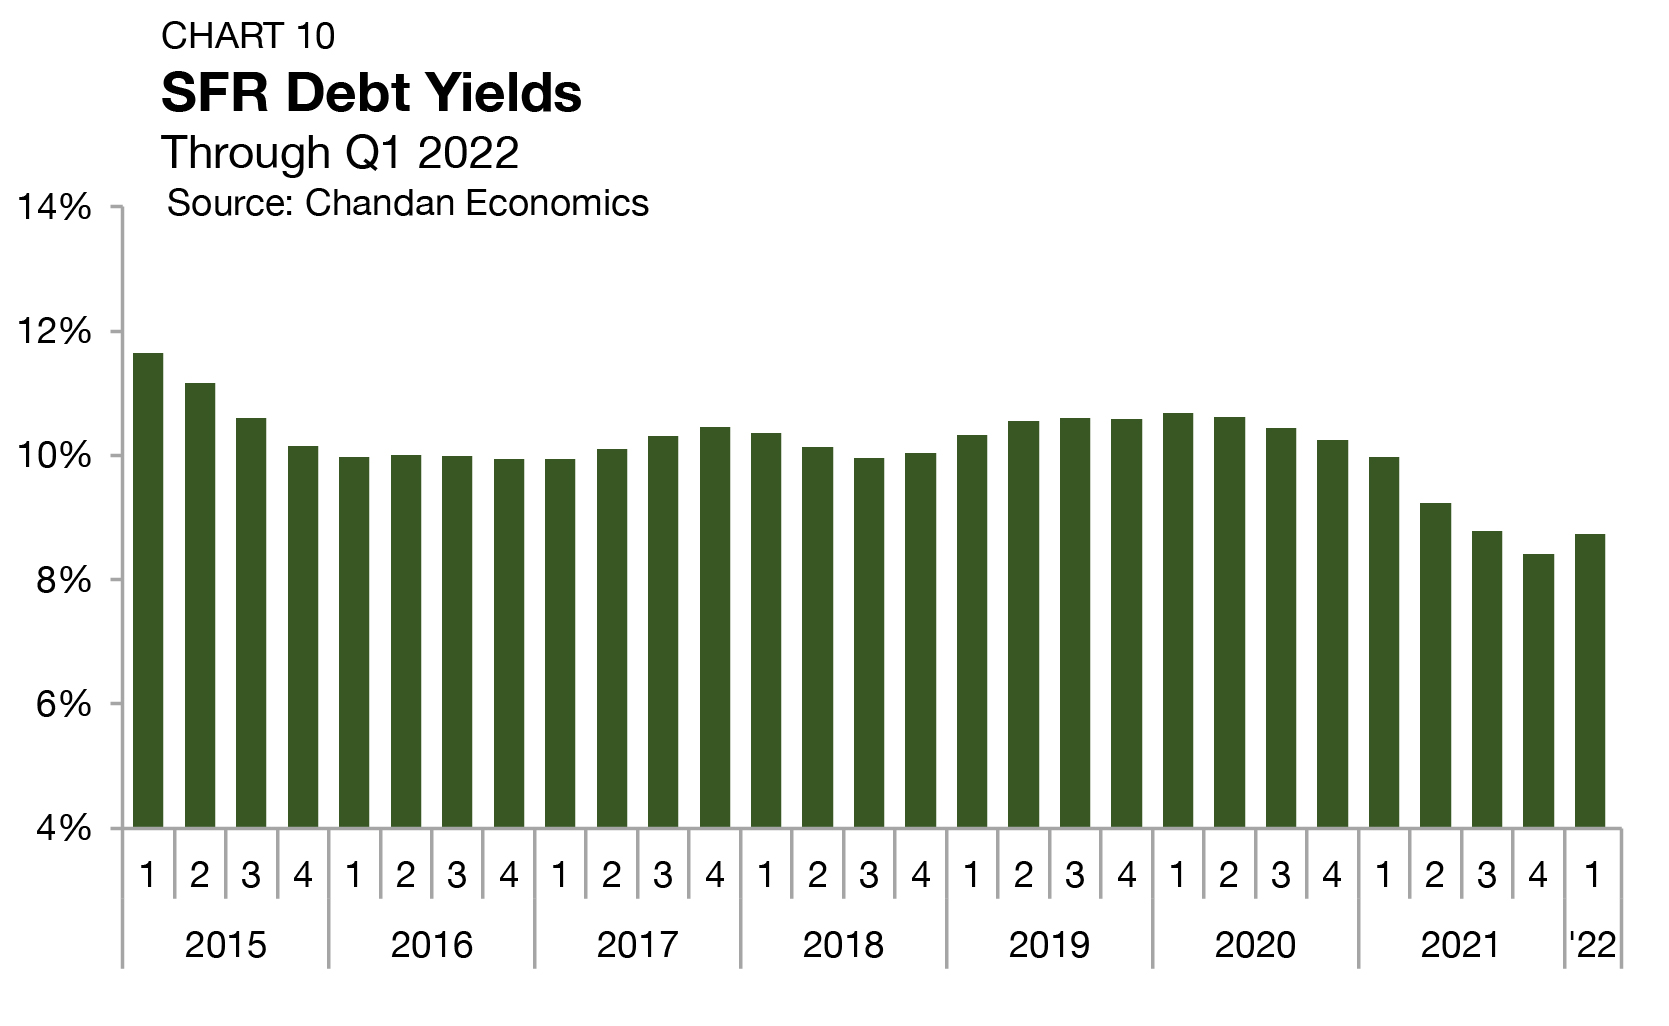
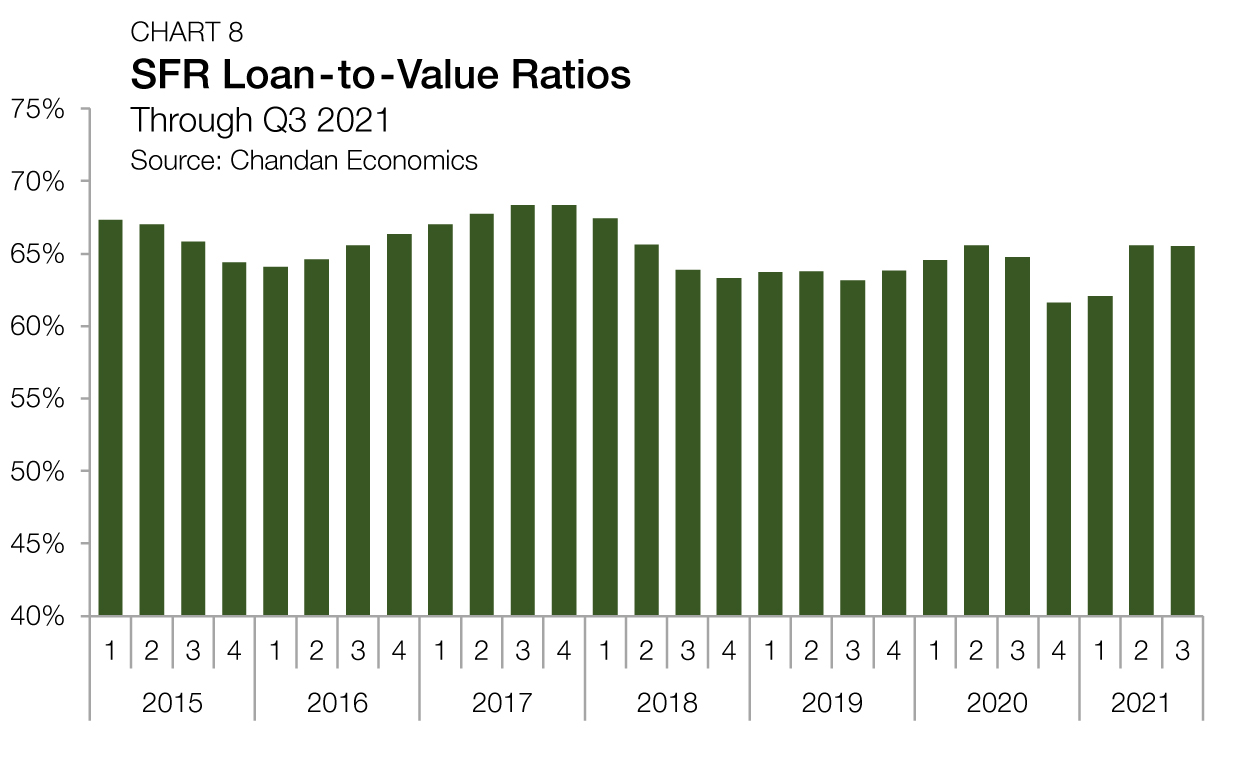
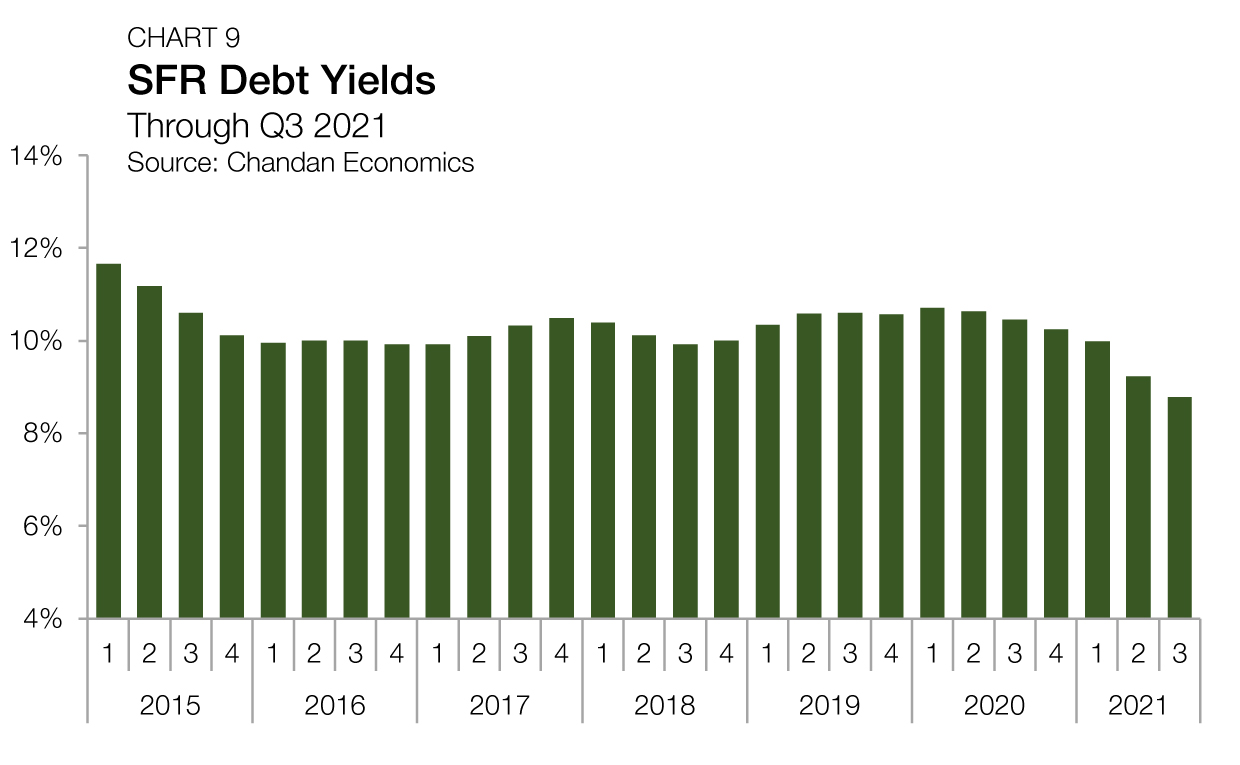
Debt yields, a key measure of credit risk, rose by 11 bps during the fourth quarter of 2022, climbing to 9.5% (Chart 11). This fourth consecutive quarterly increase signals that lenders have continued to exercise caution as the housing market works through a pricing correction.
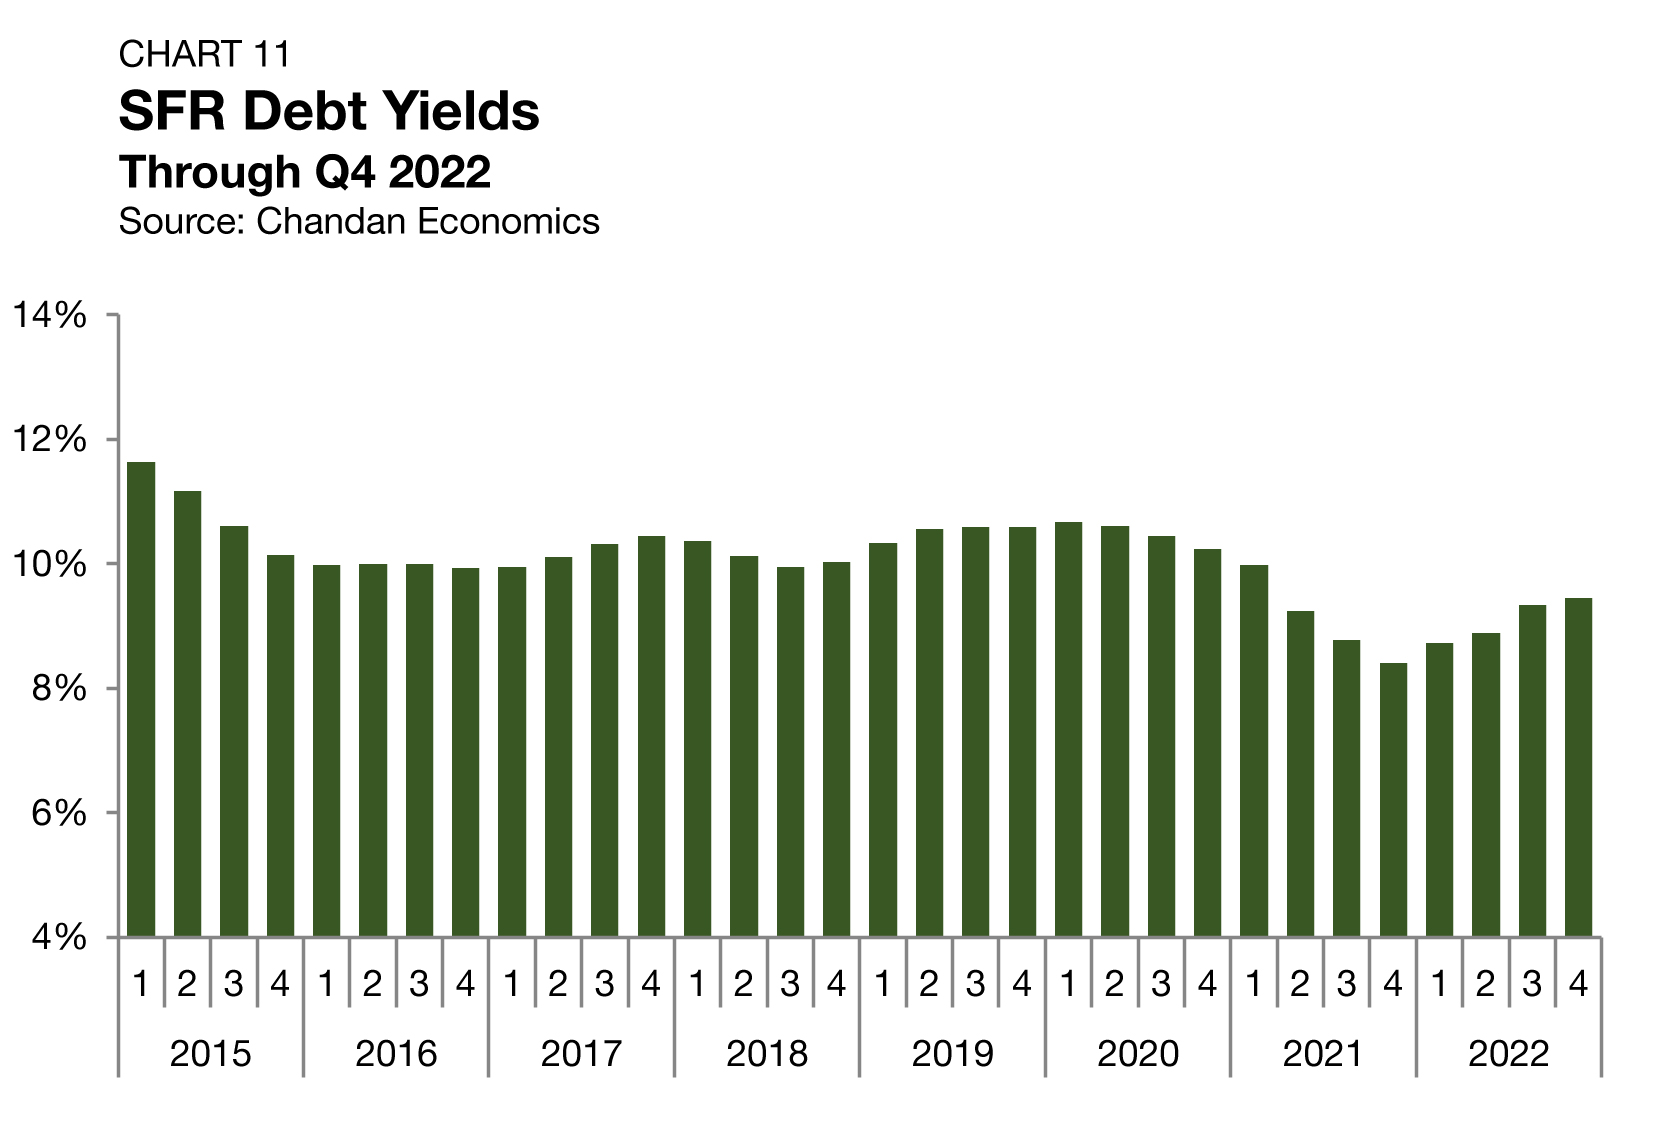
The rise in debt yields over the past four quarters translates to SFR investors securing less debt capital for every dollar of property-level net operating income (NOI). Through the fourth quarter of 2022, SFR debt declined to $10.58 for every dollar of NOI, a decrease of $0.12 from the third quarter and a decrease of $1.32 from the same time last year.
Supply & Demand Conditions
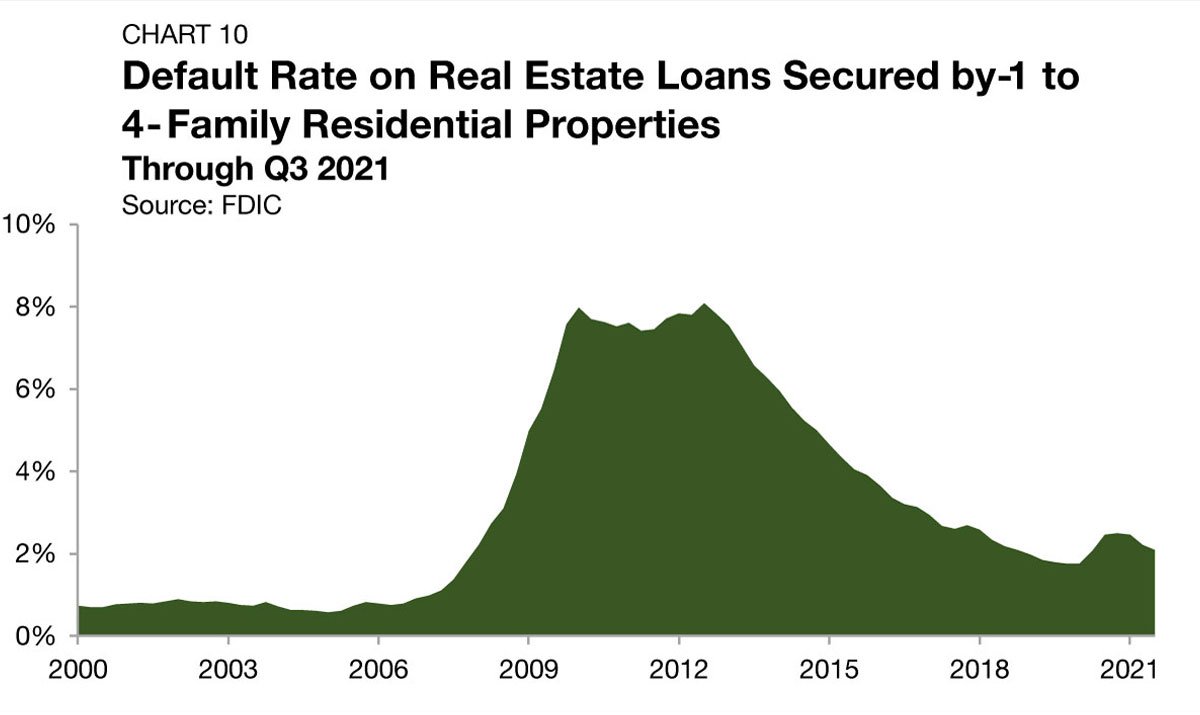
Residential Default Rates
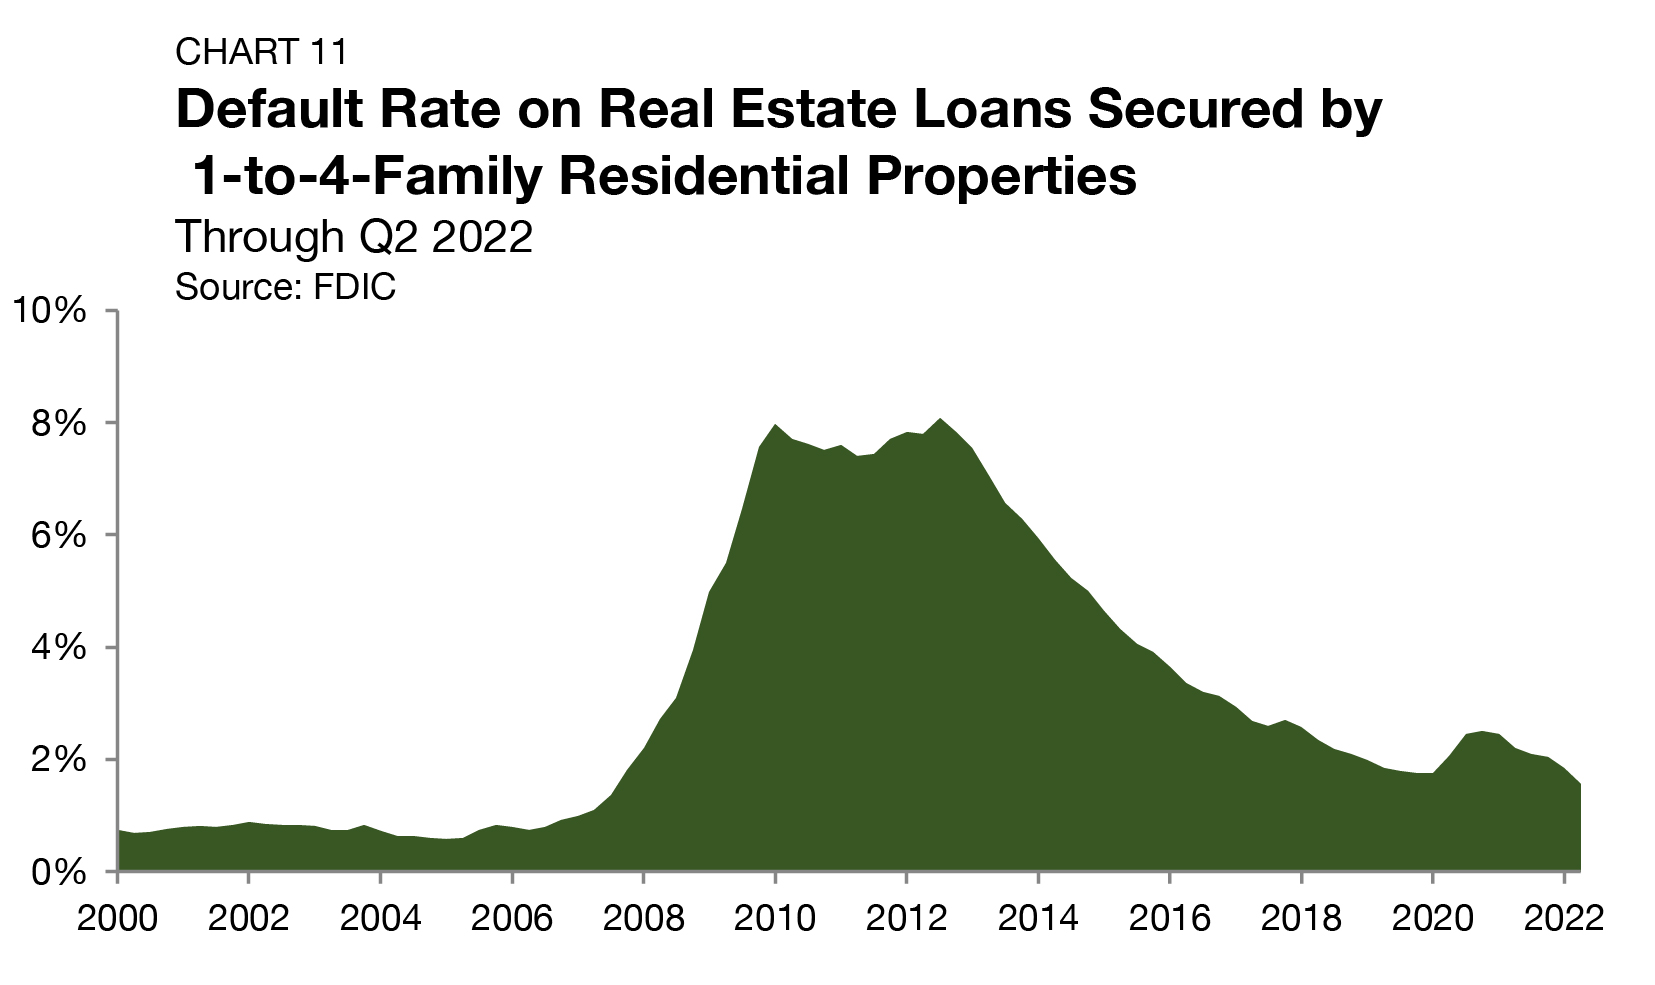
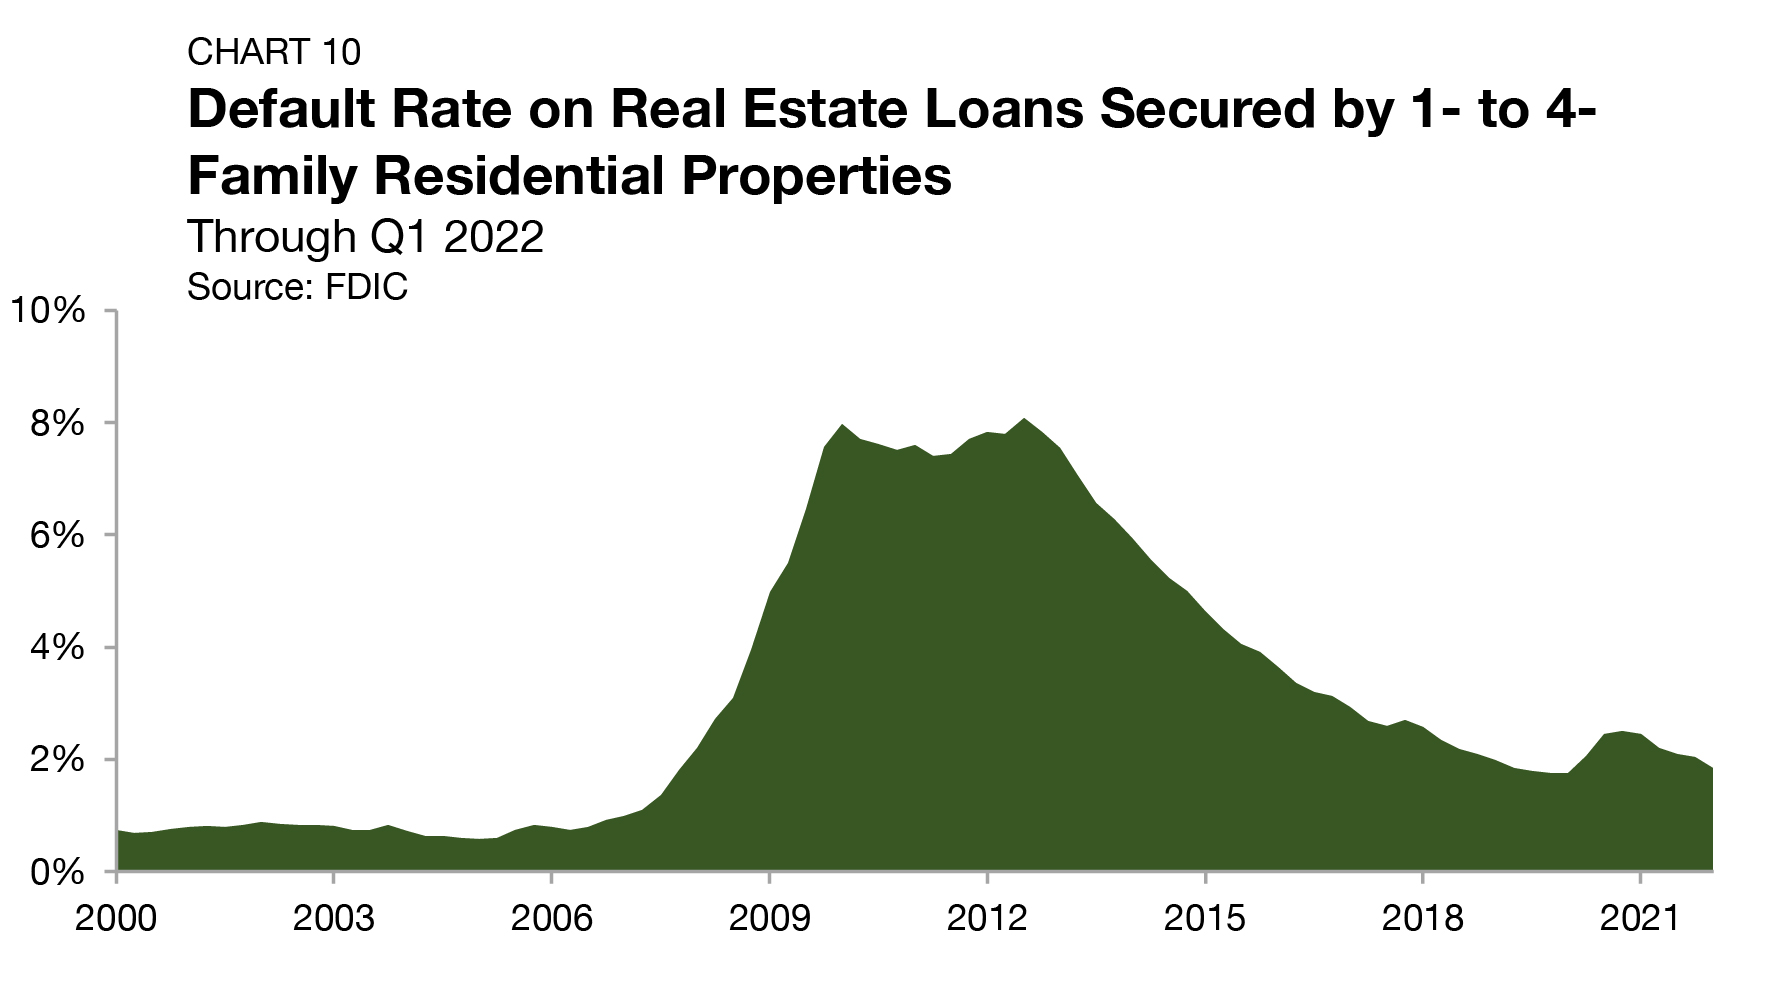
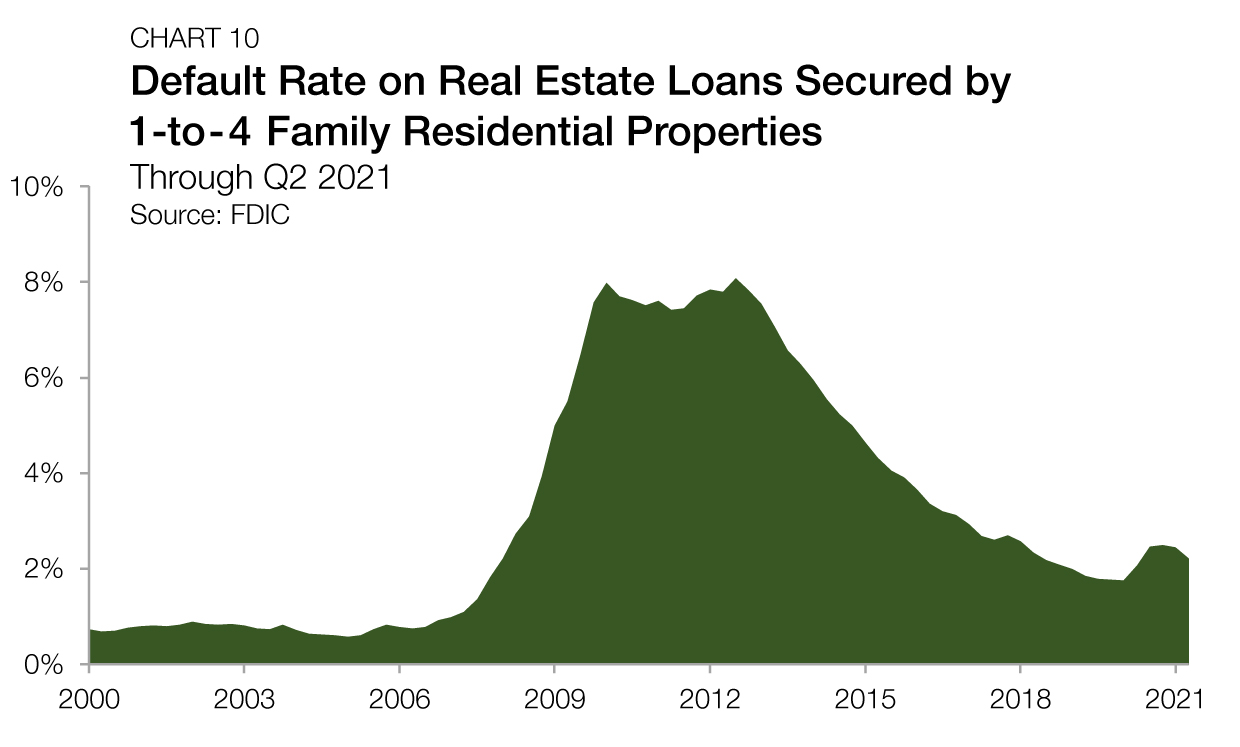
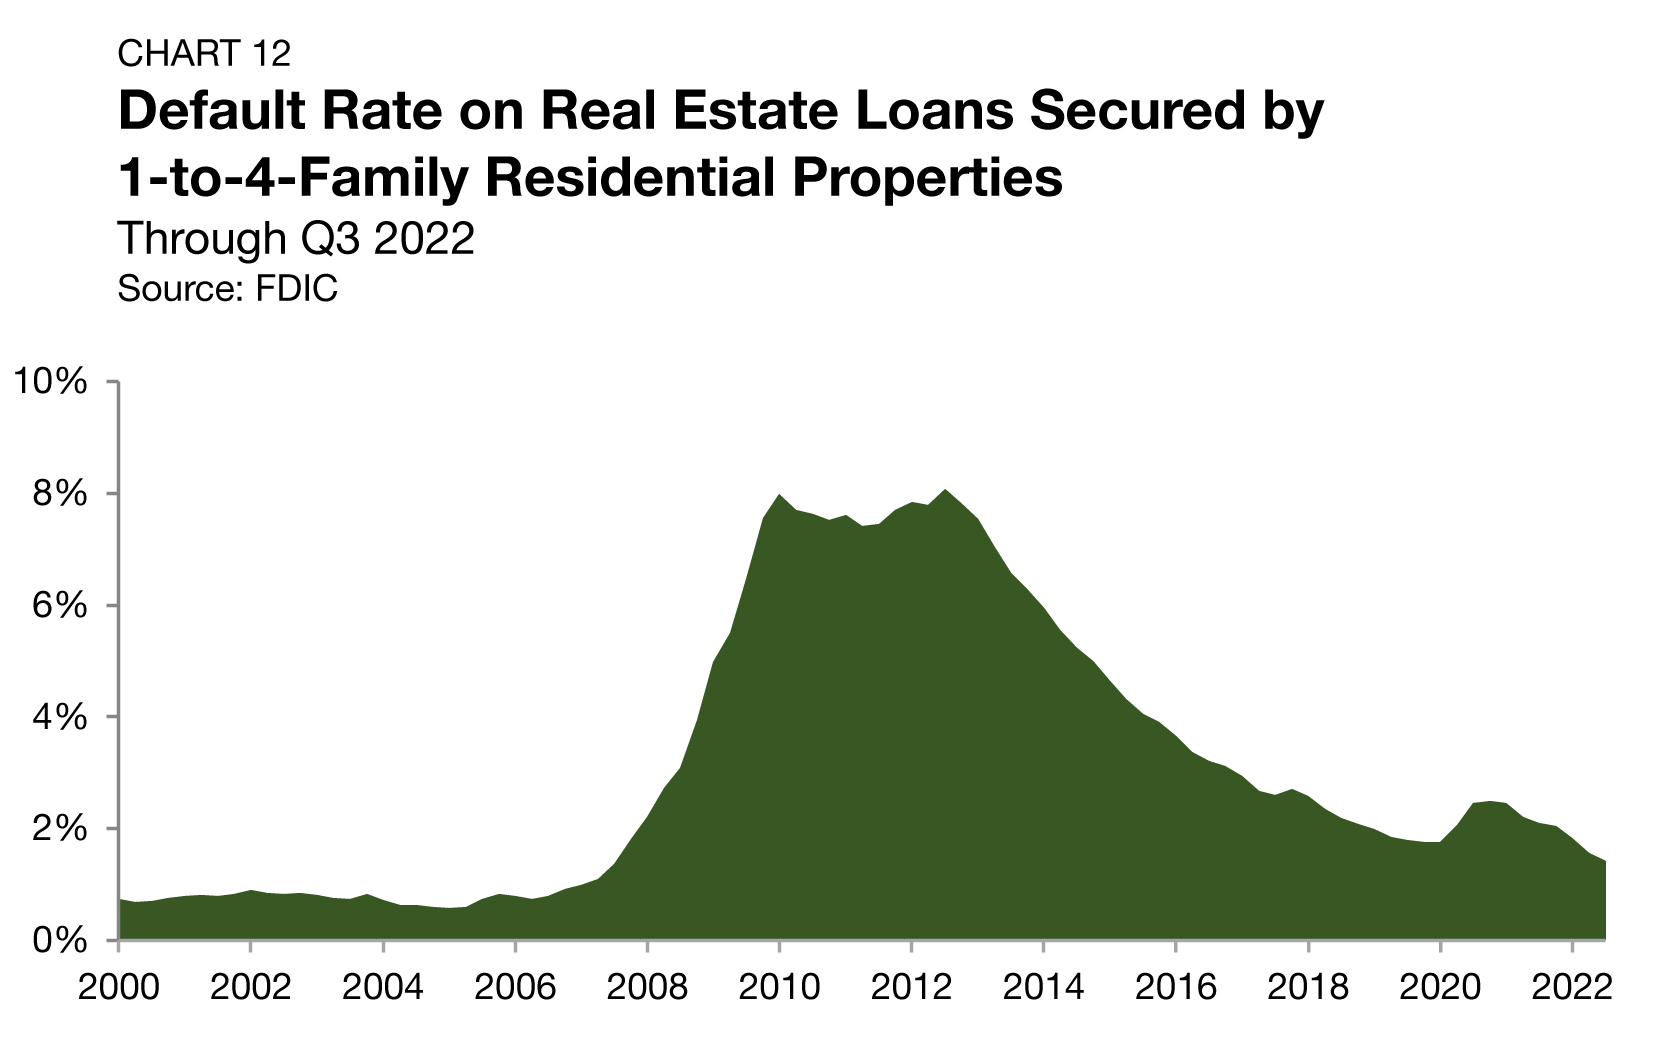
In the aftermath of the Great Recession, investors took advantage of the market dislocation, acquiring large portfolios of single-family assets at steep discounts. For a similar scenario to happen again in this current market remains unlikely. According to the Federal Deposit Insurance Corporation (FDIC), mortgage default rates fell to a new post-2008 low of 1.4% in the third quarter of 2022. The presence of historically low interest rates in the years leading up to 2022 and the continued strength of the labor market means that homeowners have maintained the ability to pay their mortgages. As a result, borrower distress remains limited despite the housing market’s pricing slowdown (Chart 12).
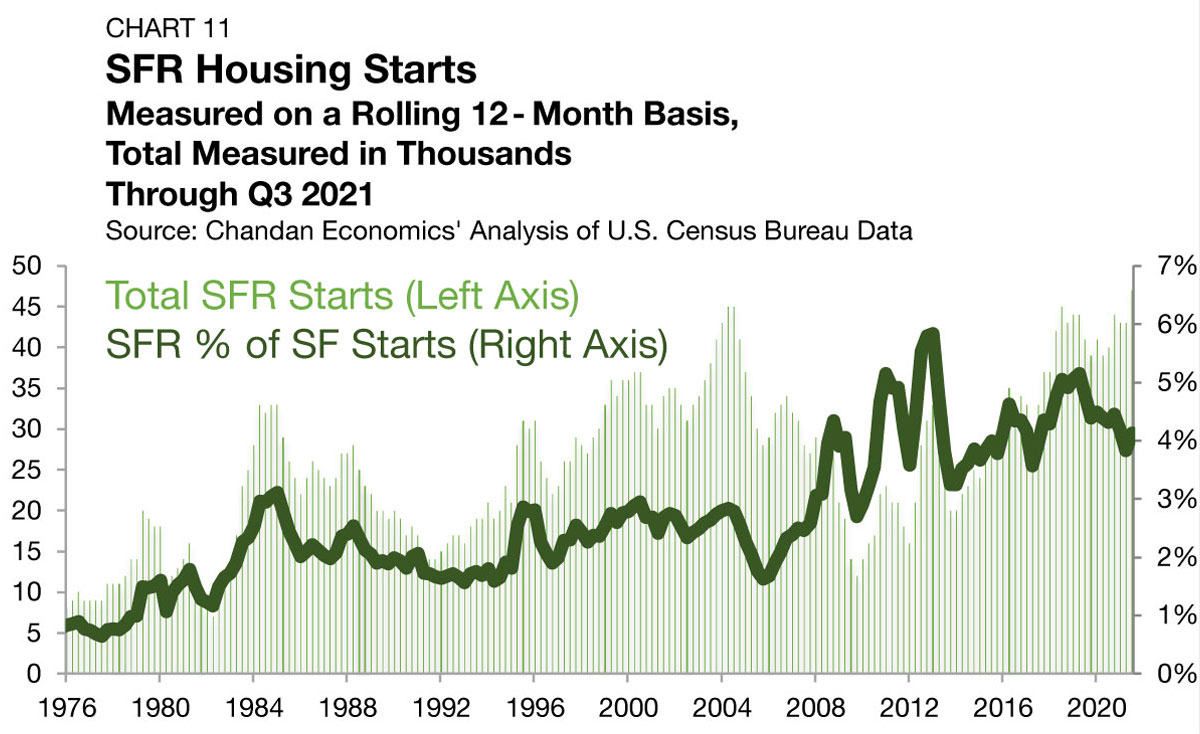
Build-to-Rent
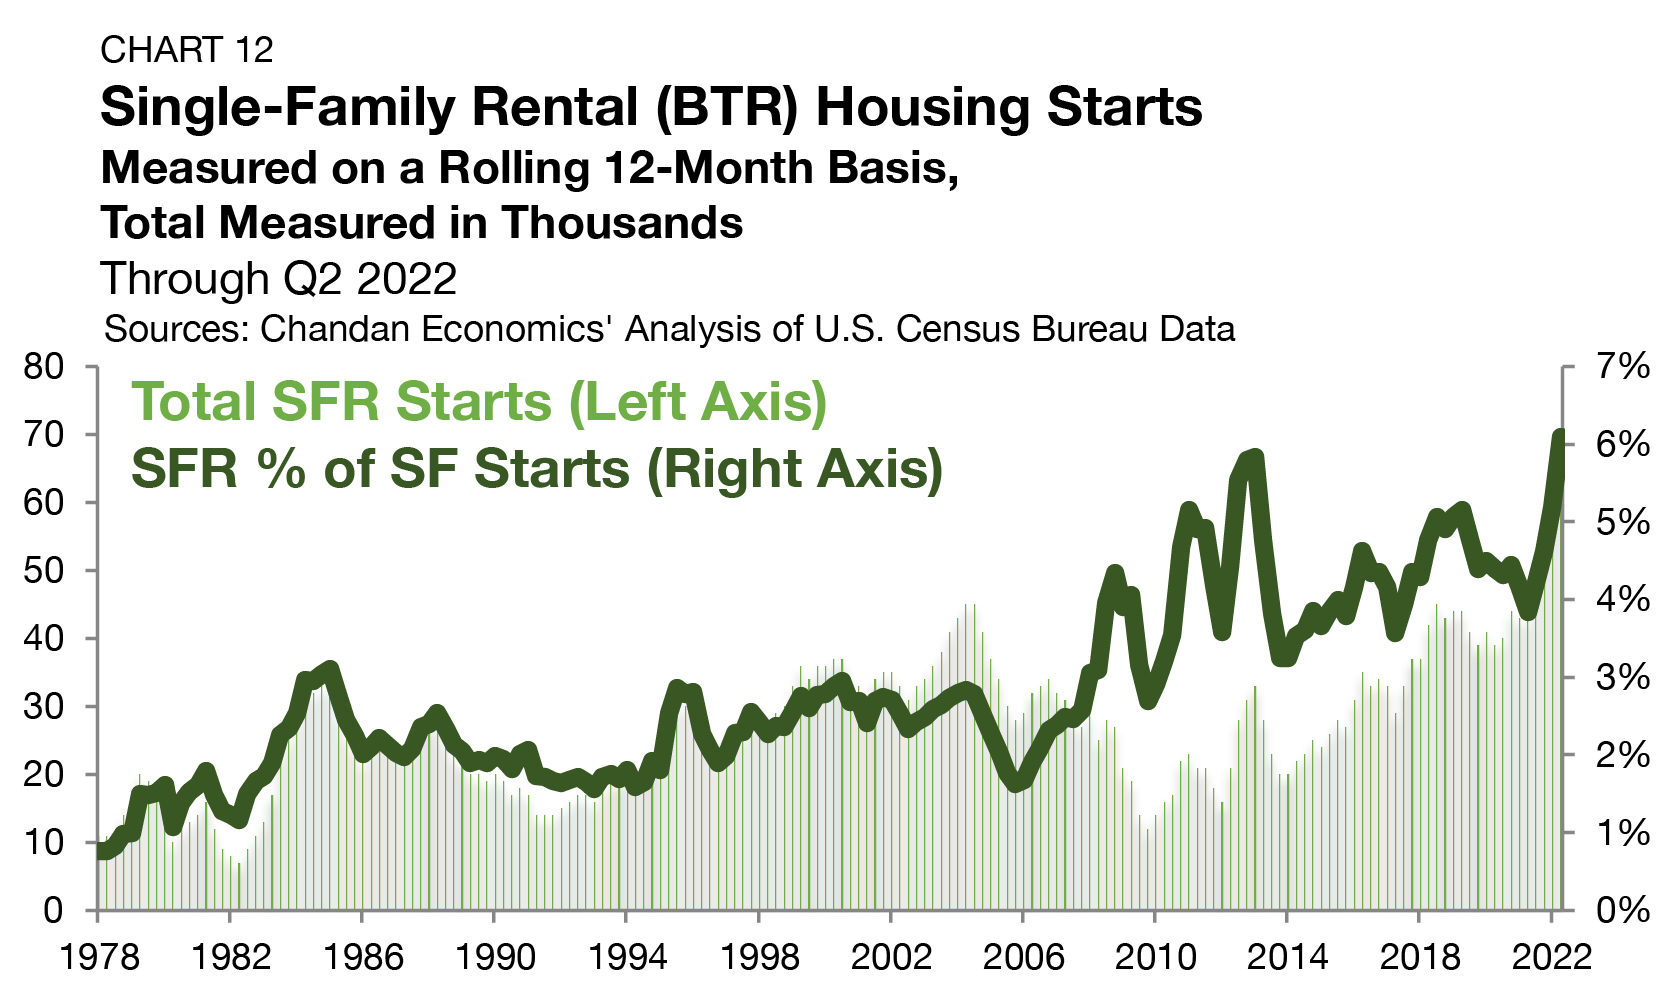
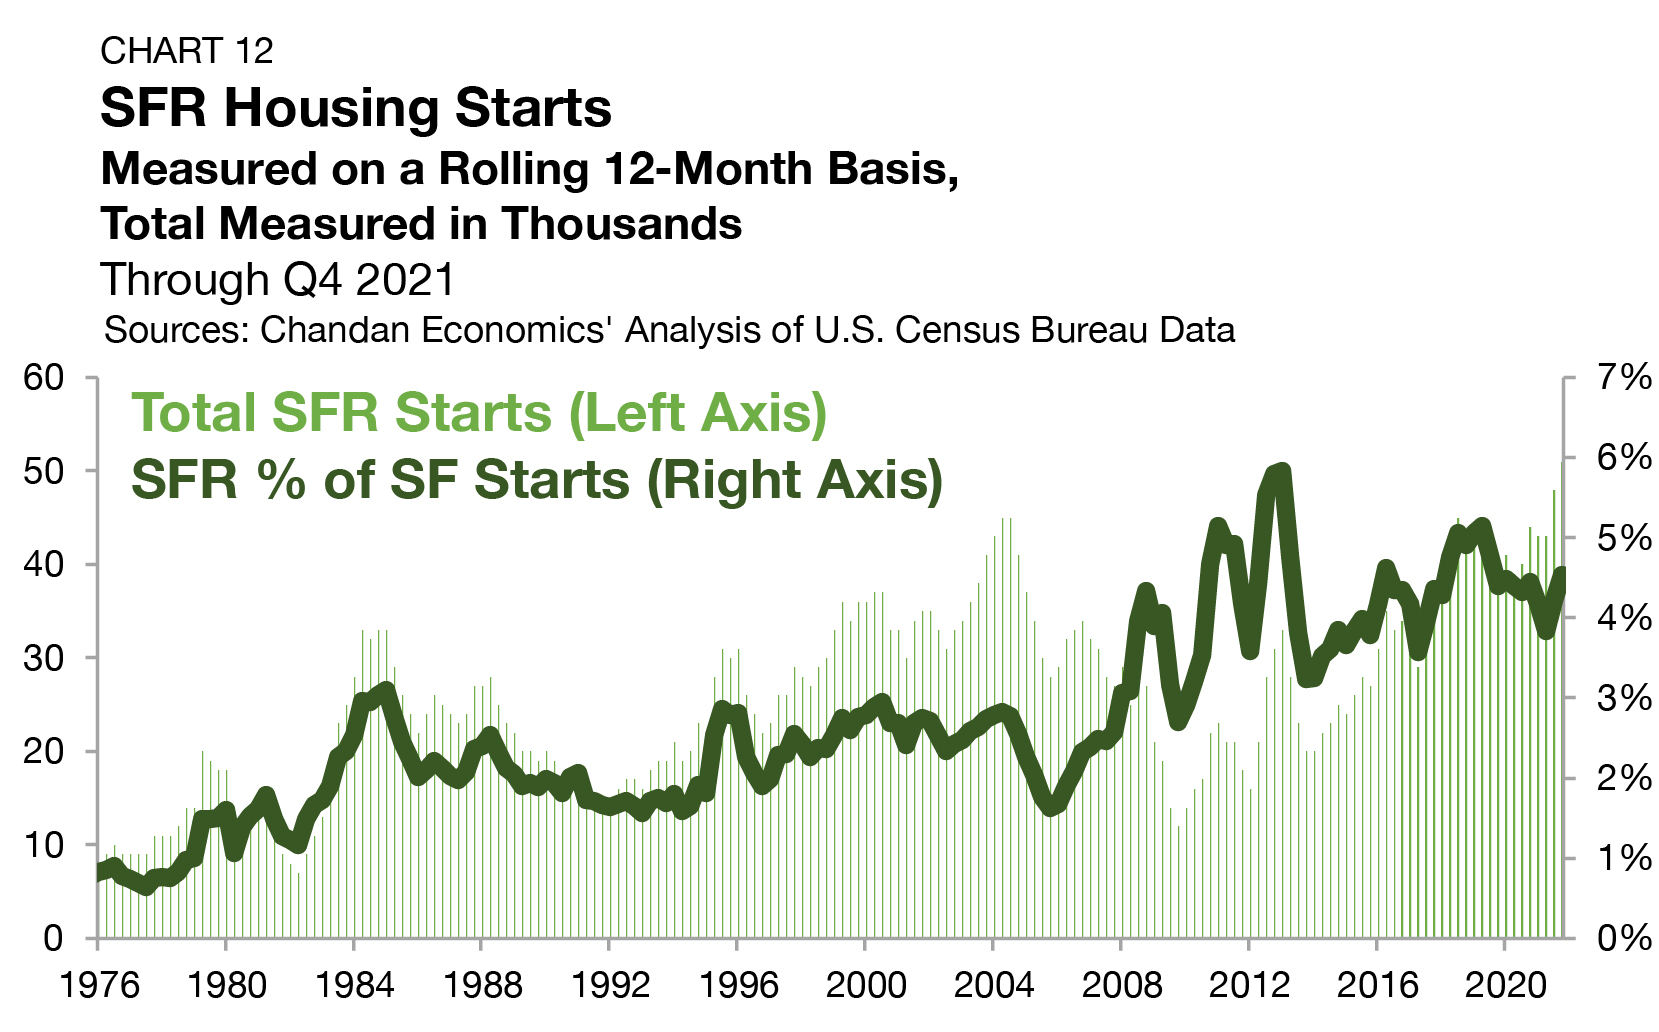
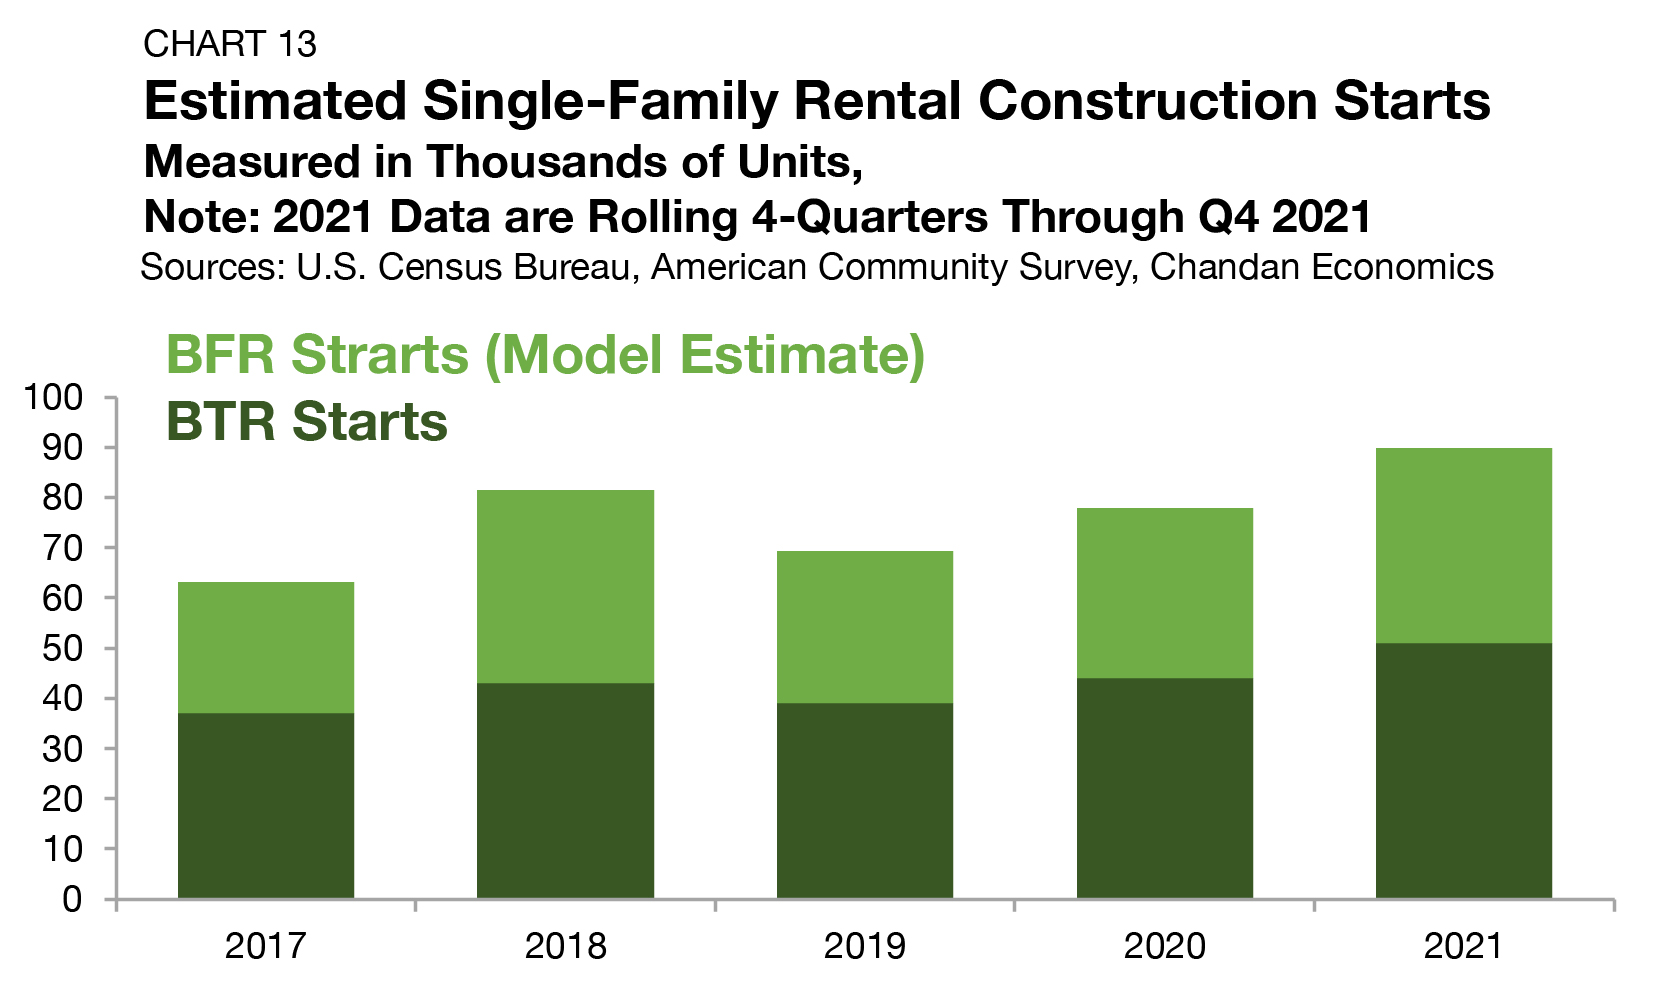
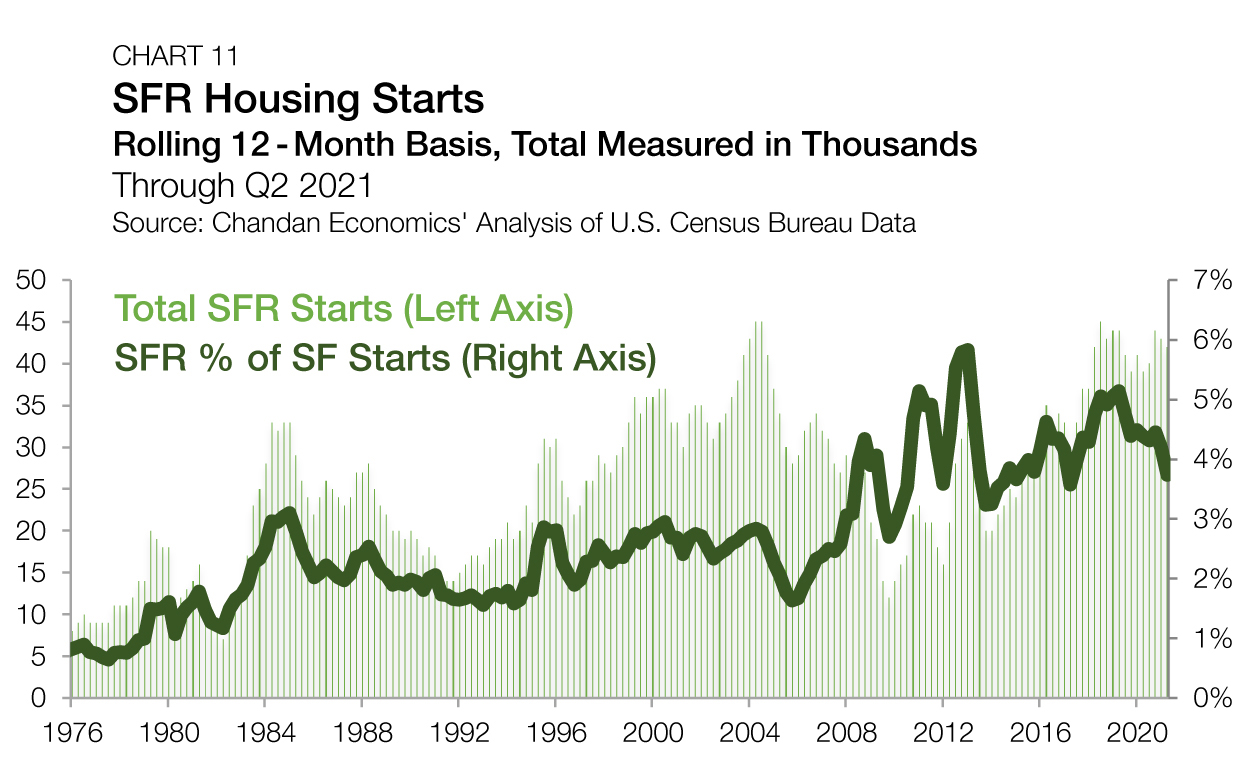
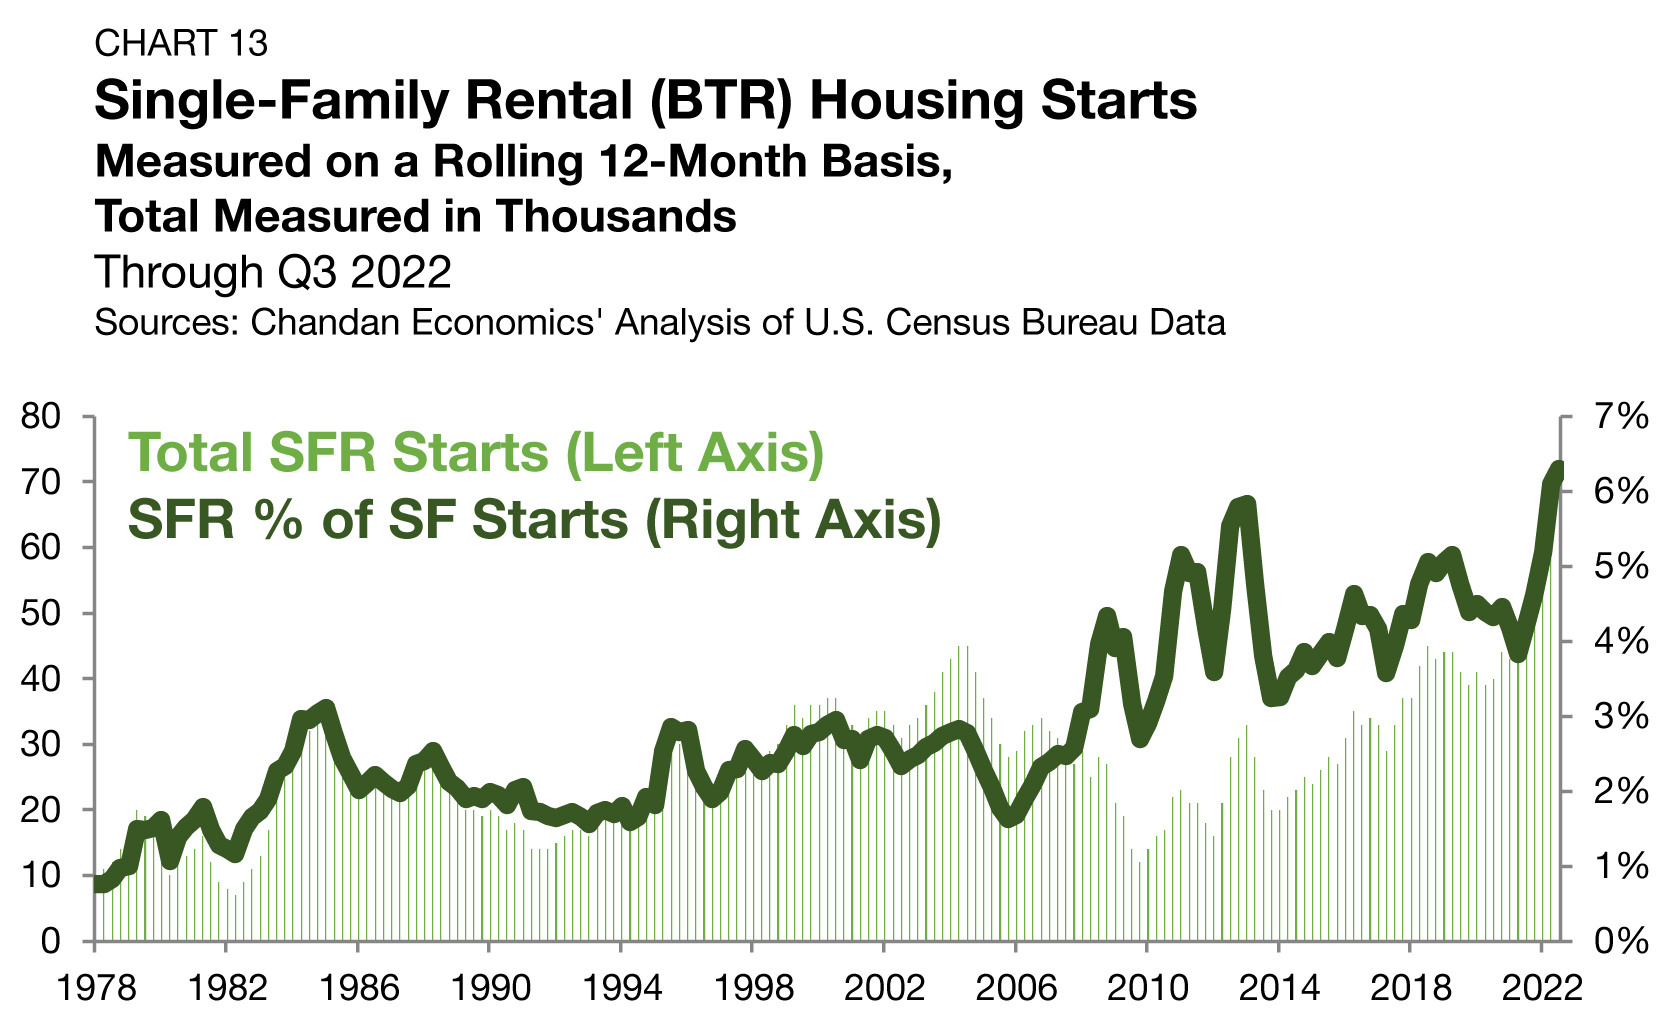
Purpose-built SFR properties, known as build-to-rent (BTR) communities, have become a defining feature of the SFR sector. In the year ending in the third quarter of 2022, BTR accounted for 6.3% of all single-family construction starts, another new record (Chart 13).
Between 1975 and the start of the prior recession in 2007, BTRs accounted for a little less than 2.0% of all single-family construction starts, according to an analysis of Census Bureau data.
By unit count, there were 68,000 BTR construction starts in the year ending in the third quarter of 2022 — a 42% growth rate from a year earlier. As explored by Ivan Kaufman and Sam Chandan in their Spring 2023 Special Report, increased consumer attention for SFR has allowed the sector to ramp up new construction, even as non-SFR single-family construction starts have slowed.
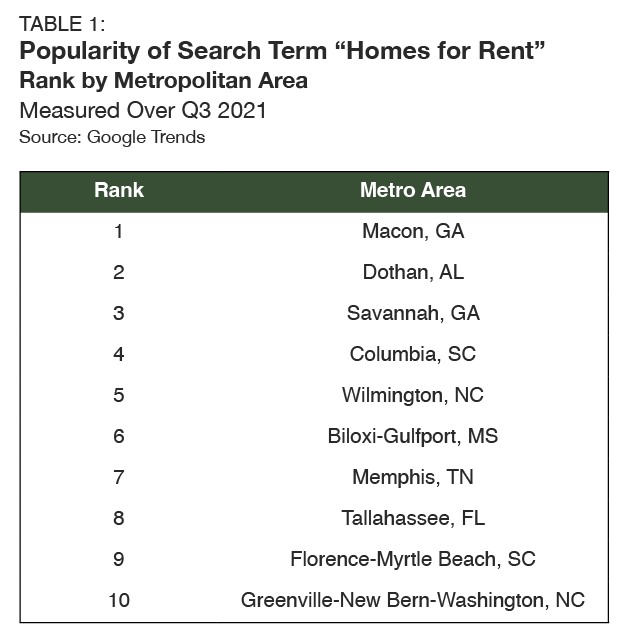
Tracking Demand
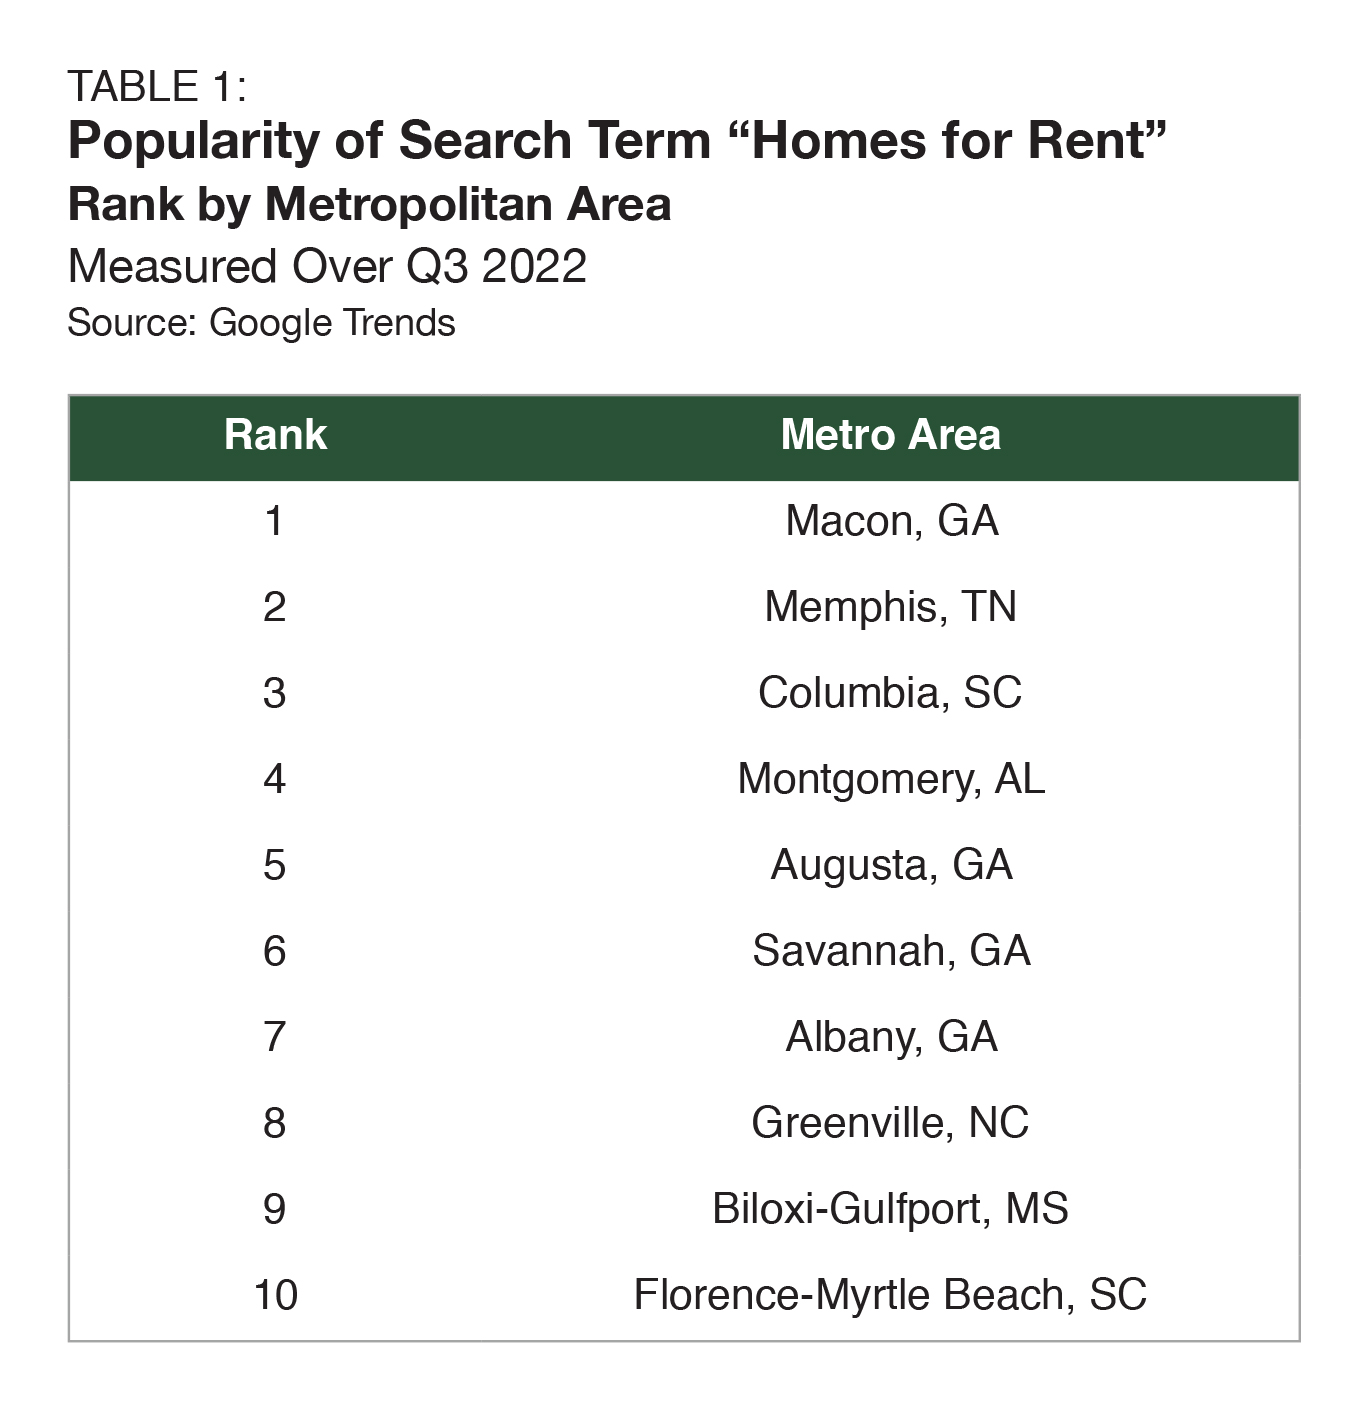
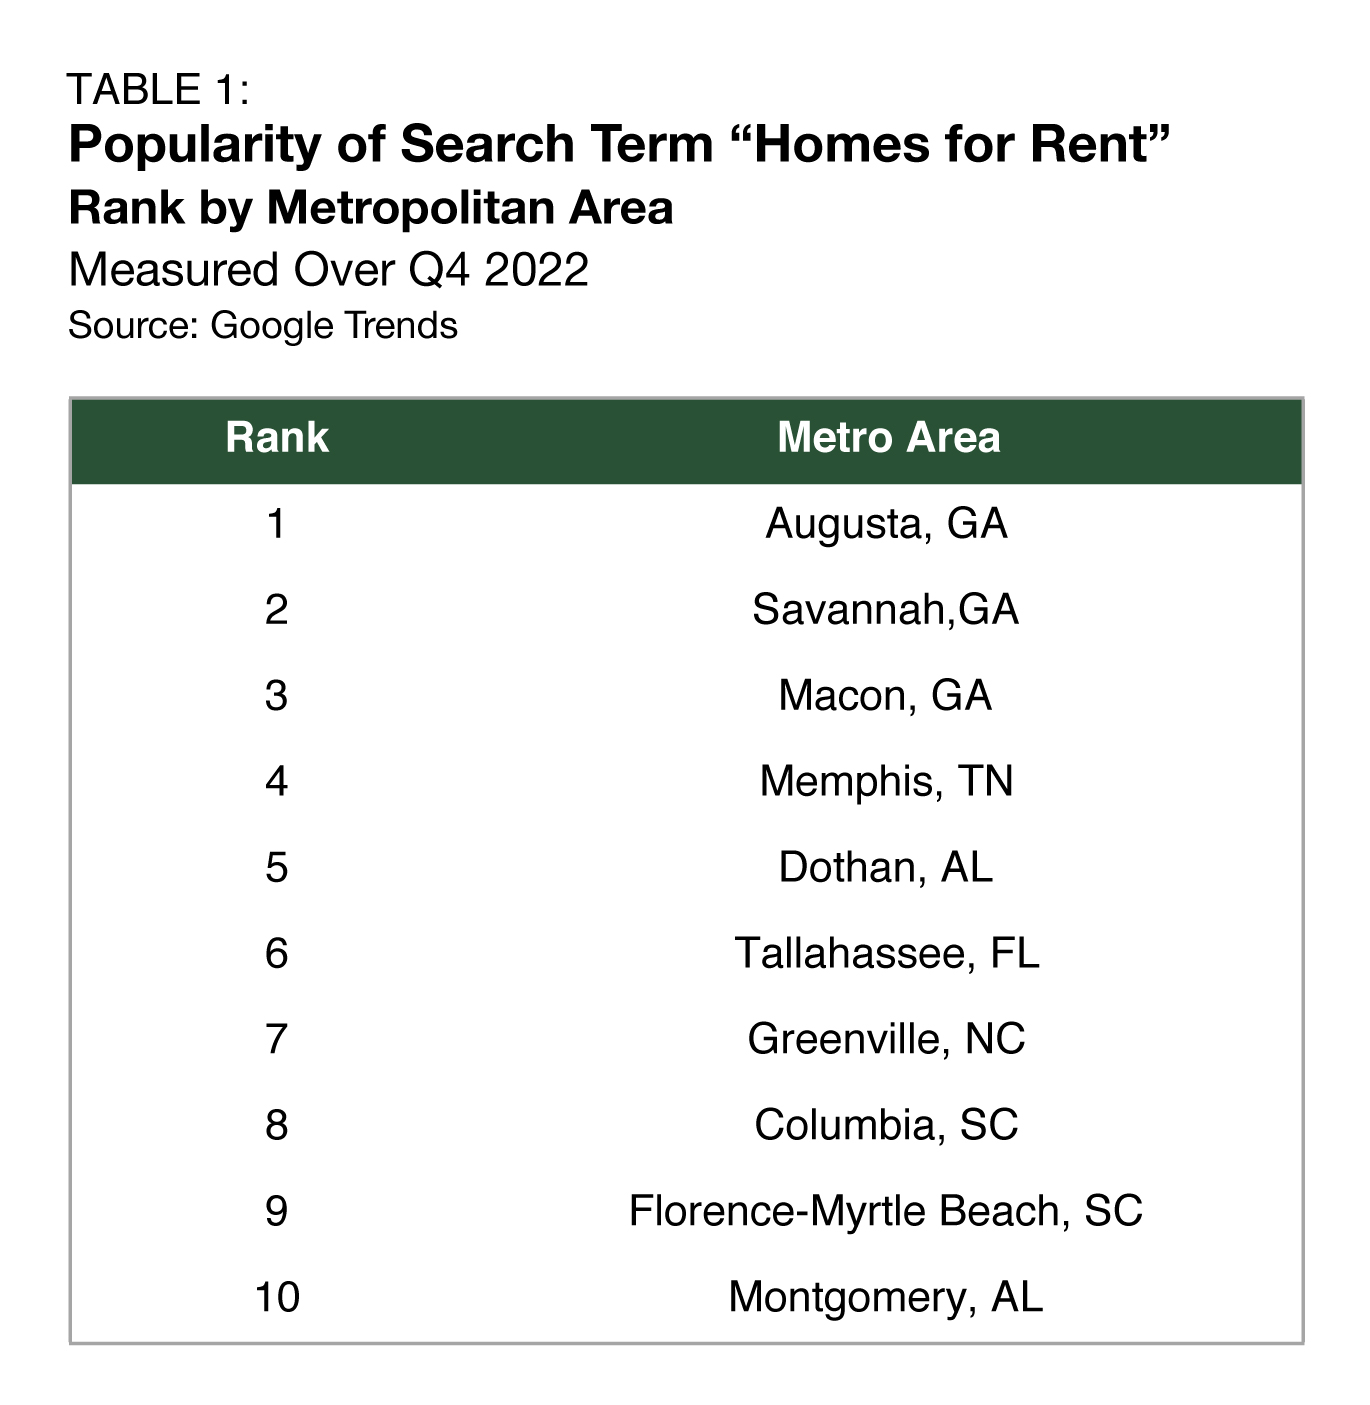
Using Google Trends to track the popularity of the search term “homes for rent” can help identify potential hotspots for SFR demand. Augusta, GA, was the area where “homes for rent” was searched most during the fourth quarter of 2022, dethroning its Georgia neighbor, Macon (Table 1). All the metros within the top 10 most searched locations are found in six southeastern Sun Belt states (Georgia, Tennessee, Alabama, North Carolina, South Carolina and Florida). In addition to demand-side factors, lower average land prices in the Southeast have made the region more attractive to large-scale SFR strategies.
Outlook
Evidenced by its most recent 25 bps rate hike, the Federal Reserve has been seeing progress in its fight against inflation and is starting to slow the pace of its monetary tightening policy. The eventual normalization of interest rates will be a boon for both the housing market and SFR, as the headwinds of uncertainty will weaken. In the year ahead, the SFR sector will see both challenges and opportunities. Homebuilders have been experiencing high cancellation rates and have had trouble offloading inventory. In some cases, homebuilders are even offering substantial mortgage rate buydowns to save deals. As a result, SFR operators are positioned as an alternative type of buyer for homebuilders with oversupplied pipelines. The sustainability of work-from-home and hybrid work will continue to support high levels of rental housing demand outside metro urban cores. While SFR will face cyclical headwinds at the beginning of this year, the long-term outlook remains firmly positive as this product type positions itself as the new American starter home.
1 Unless otherwise noted, the Chandan Economics data covering single-family rental cap rates and debt yields are based on model estimates and a sample pool of loans. Data are meant to represent conditions at the point of origination.
For more single-family rental research and insights, visit arbor.com/articles