Q4 2021
Single-Family Rental
Investment Trends
Report
Cap Rates Reach New Lows as Build-to-Rent Construction Accelerates
Key Findings
- Cap rates dipped to 5.3% in fourth-quarter 2021 — a new all-time low
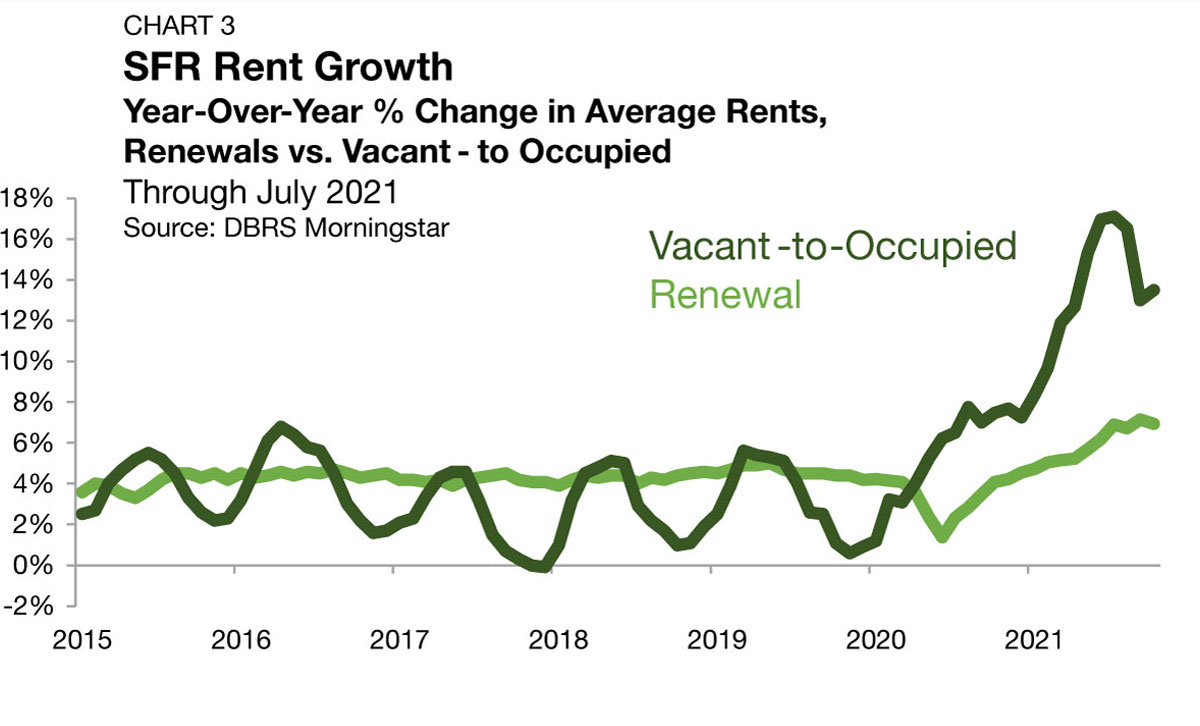
- Vacant-to-occupied (V2O) annual rent growth remains robust, hitting 13.5% through October
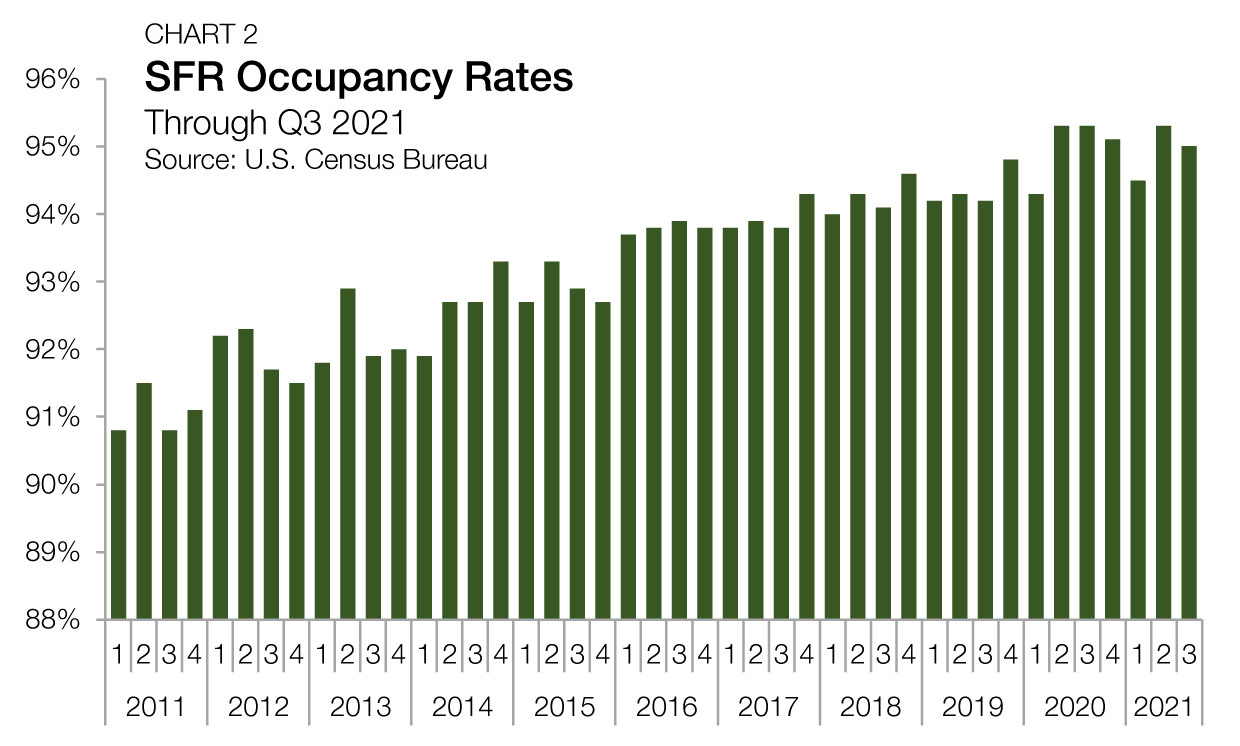
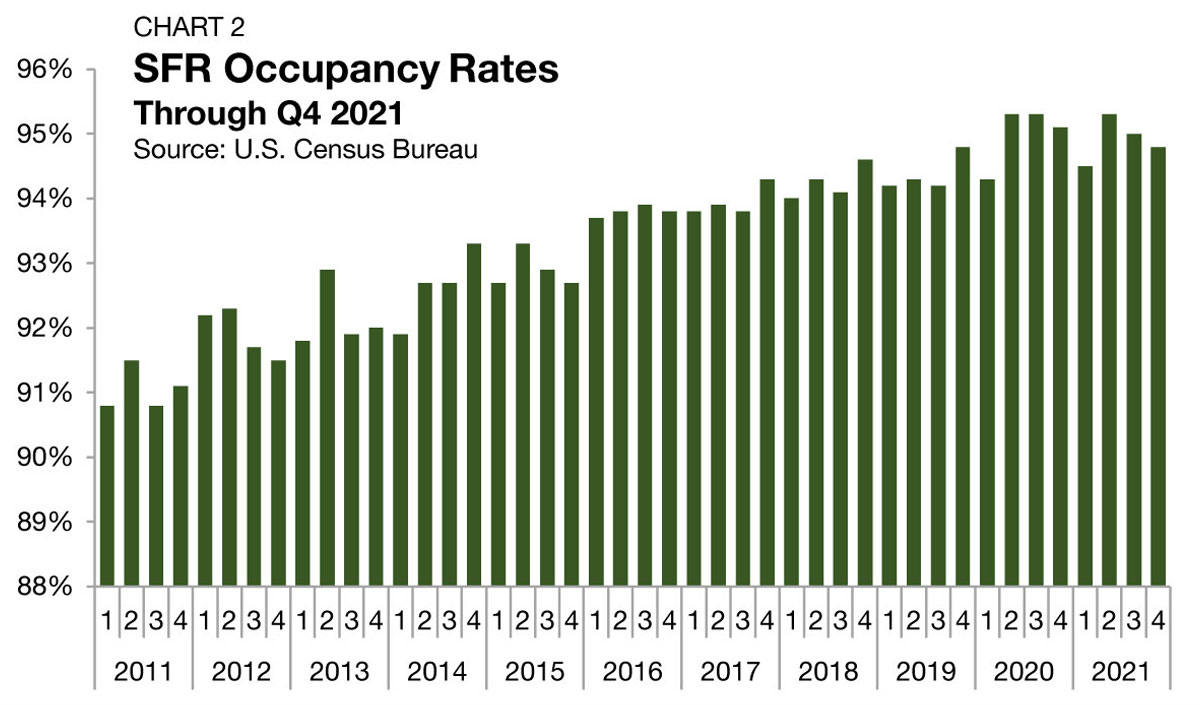
- Occupancy rates edge down to 94.8% in the third quarter, just 50 bps off their generational high
State of the Market
The sector’s decade-long trend of institutionalization has accelerated over the past year. According to Finsight, SFR CMBS issuance reached a record $16.6 billion in 2021— nearly doubling 2020’s total of $8.9 billion.
Despite the recent impressive growth, the sector looks ready to continue growing rapidly. According to a recent survey of 3,300 renters by RentCafe, nearly 4-out-5 respondents would consider moving into an SFR community. Further, current housing market conditions will likely mean that the transition into ownership will be increasingly complex over the medium term. Home prices have already surged to new peaks, and 30-year fixed mortgage rates have started to rise, reaching their highest levels since before the pandemic as of January 2022. According to the National Association of Home Builders, the share of prospective home buyers looking to buy a home in the next 12-months has dropped for two consecutive quarters through the end of 2021.
On balance, the demand for single-family housing in the U.S. has only increased throughout the pandemic while access to ownership has not. Single-family rentals have helped to fill the gap, providing accessible housing options in suburban neighborhoods with family-centric amenities. Nationally, the SFR sector remains in growth mode with many supportive tailwinds.
Performance Metrics
Originations
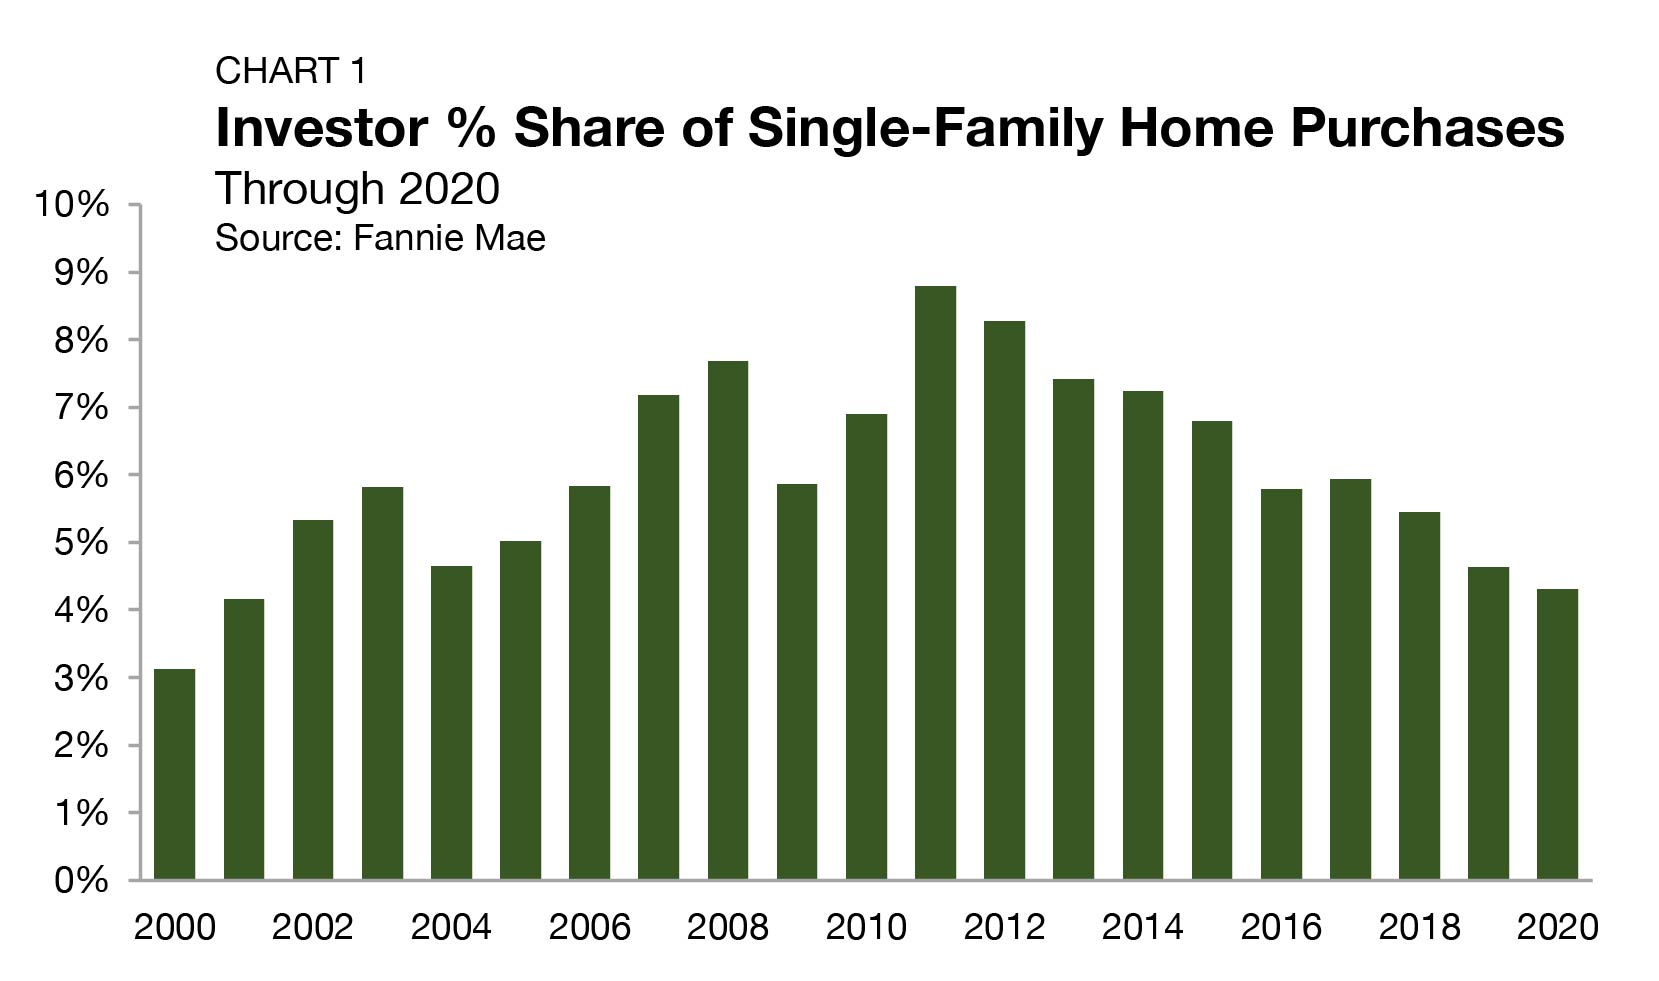
According to a Chandan Economics analysis of Fannie Mae data, a lending source for mostly non-institutional borrowers, refinancing, instead of acquiring, has accounted for the significant majority of recent originations to single-family investors. In 2020, refinancing activity accounted for 71.0% of tracked originations. Through the third quarter of 2021, the refinancing share was even higher, reaching up to 76.7%— its highest percentage on record (Chart 1). As recently as 2018, originations for acquisitions still accounted for most lending activity. However, with borrowing rates falling to new all-time lows in recent years and through the pandemic, investors have seized the opportunity to lock in lower financing rates. Notably, rate-and-term refinancings have accounted for 54.6% of all originations and a weighty 71.2% of refinancings in 2021, a sign that investors are locking into low interest rates ahead of the Federal Reserve’s anticipated monetary tightening.

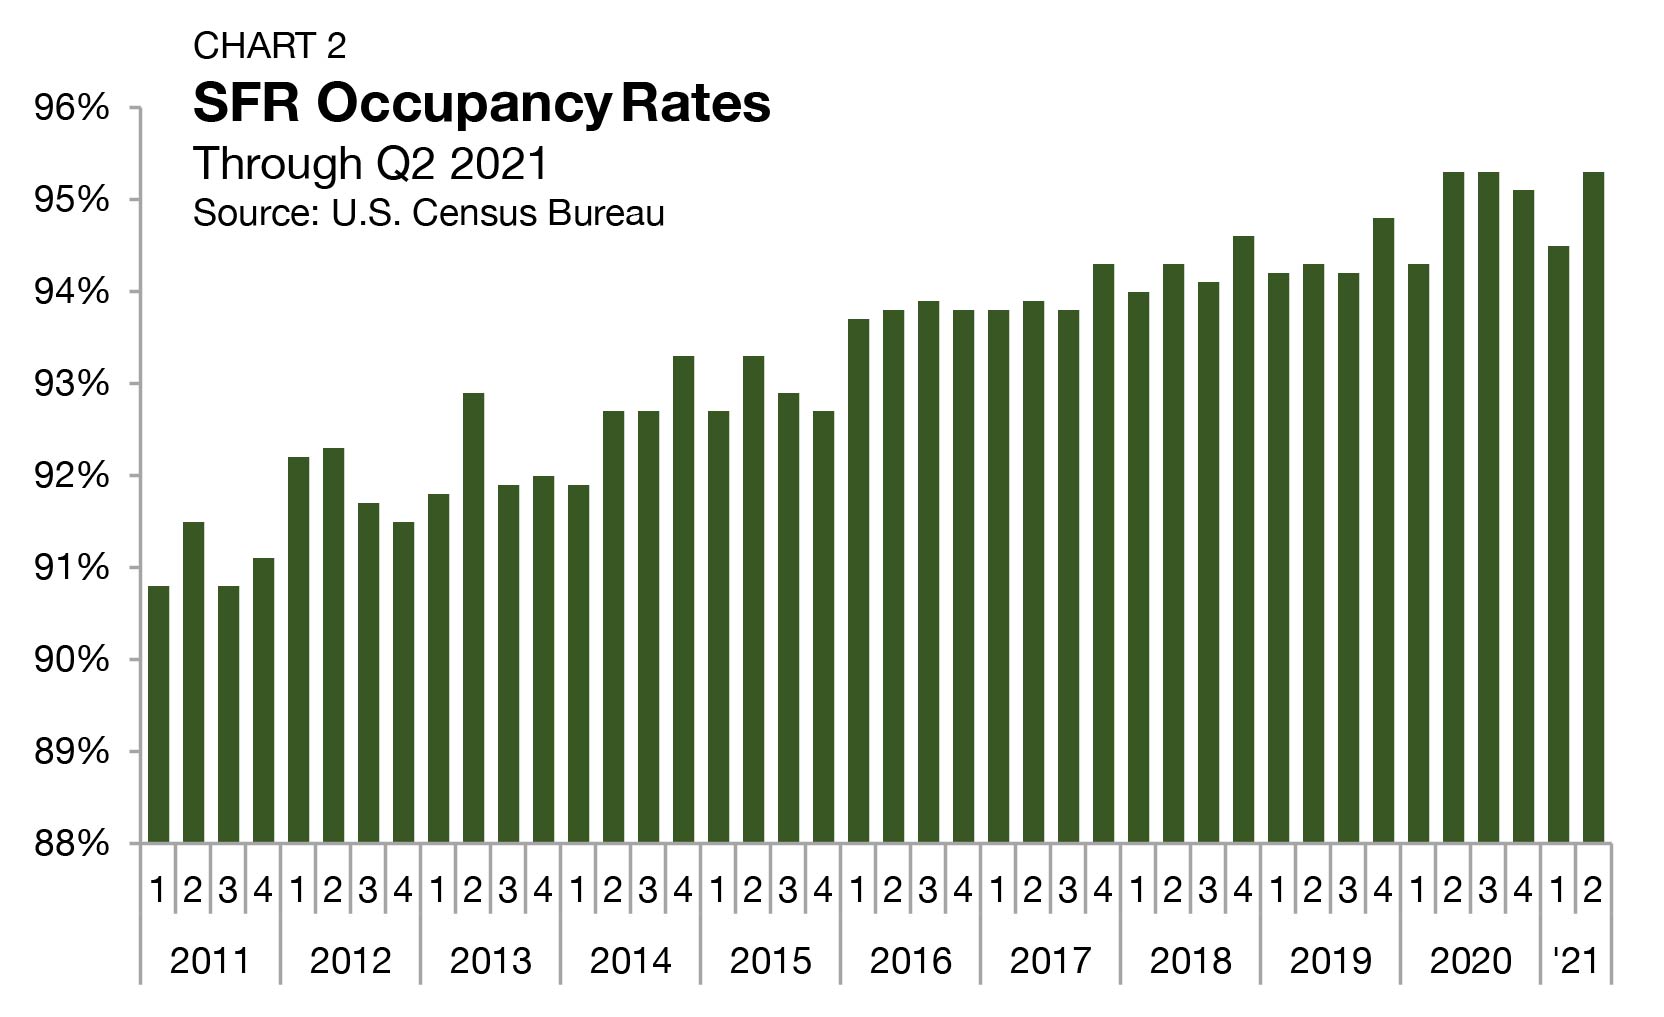
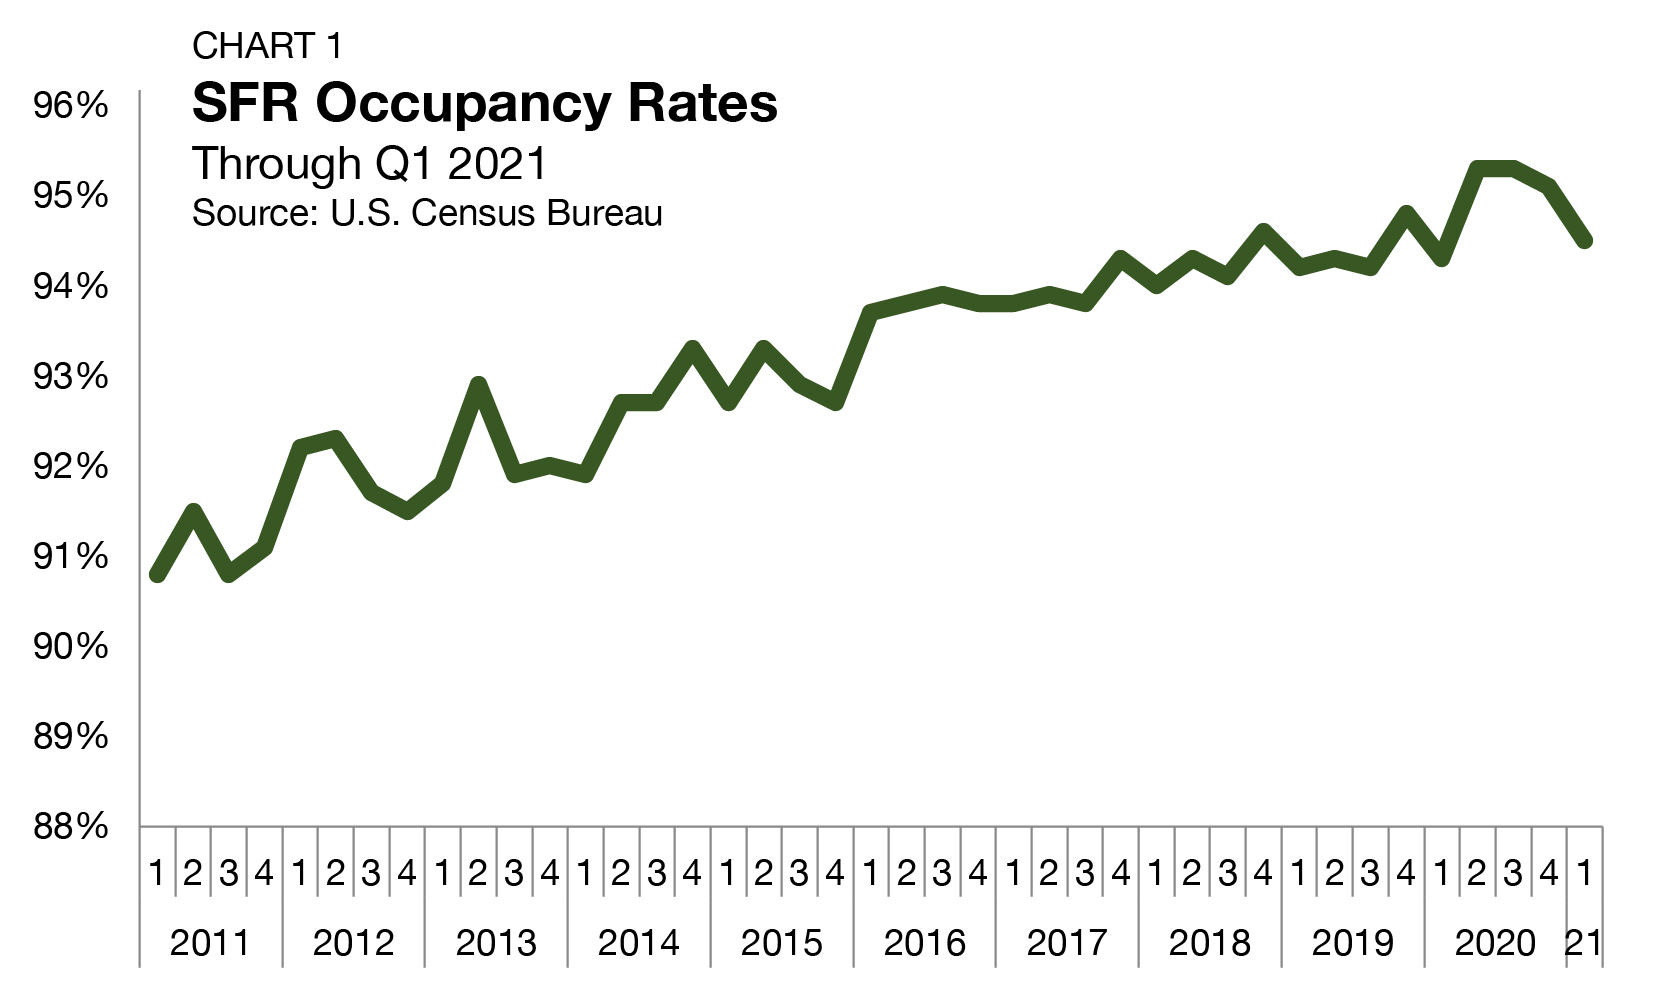
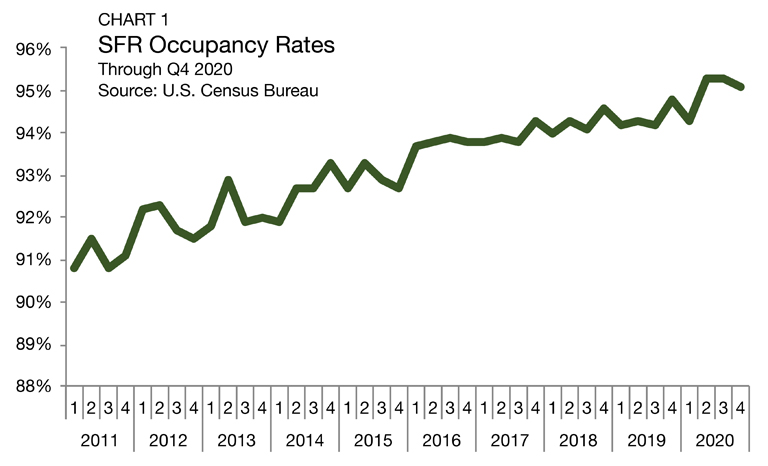
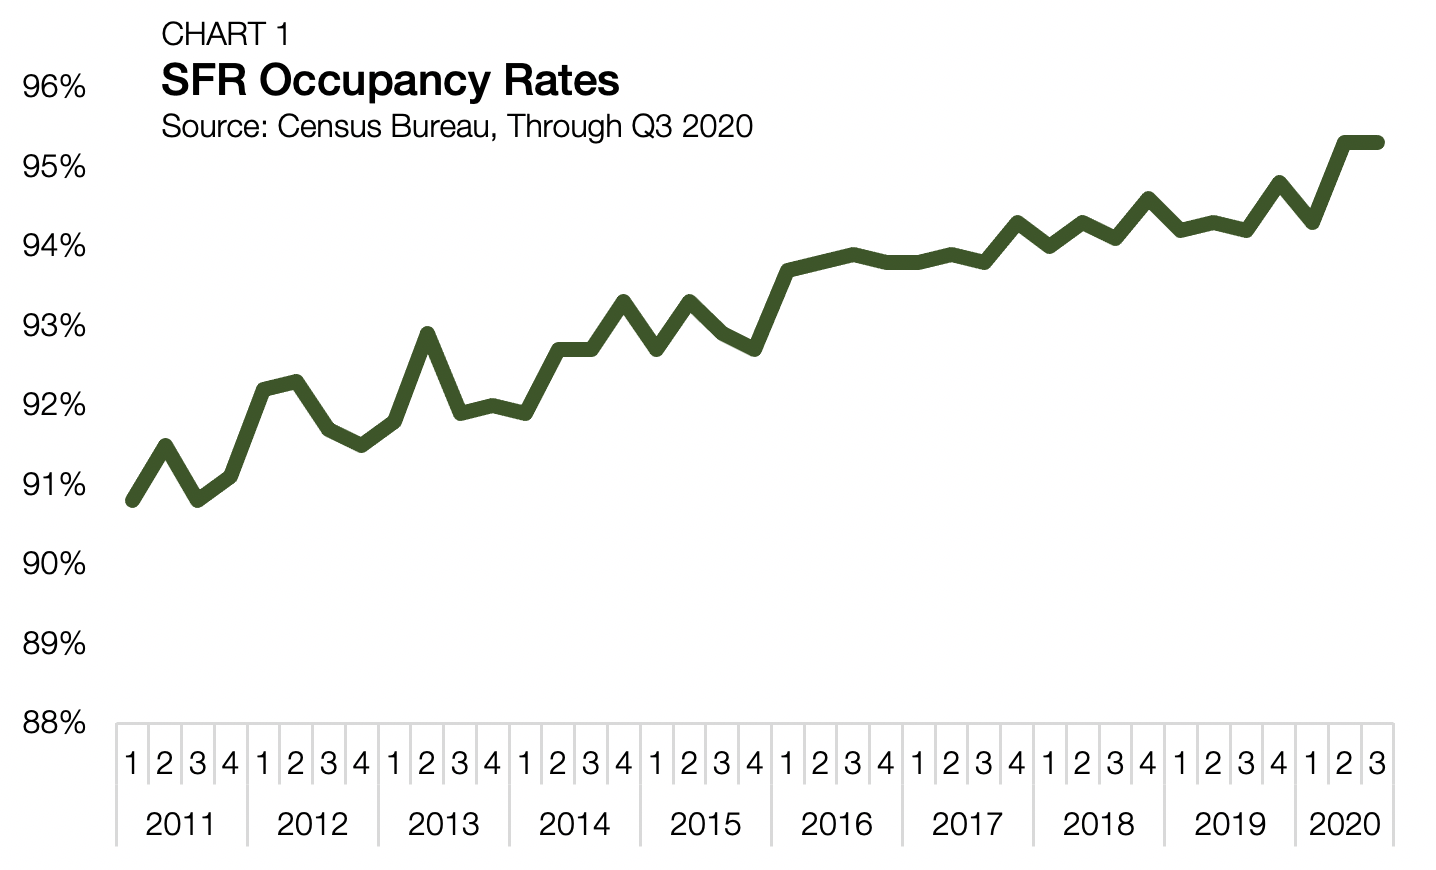
As measured by the U.S. Census Bureau, occupancy rates across all SFRs averaged 94.8% in the fourth quarter of 2021, dipping by 20 basis points (bps) from the third quarter
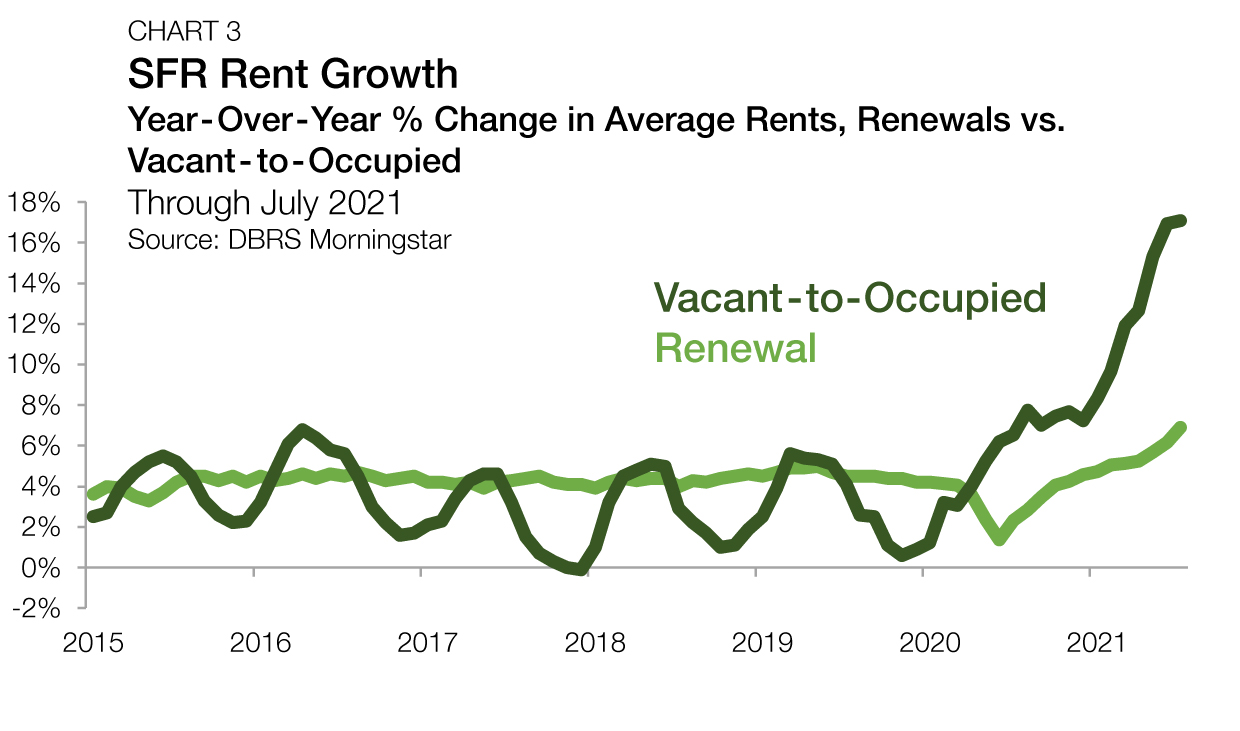
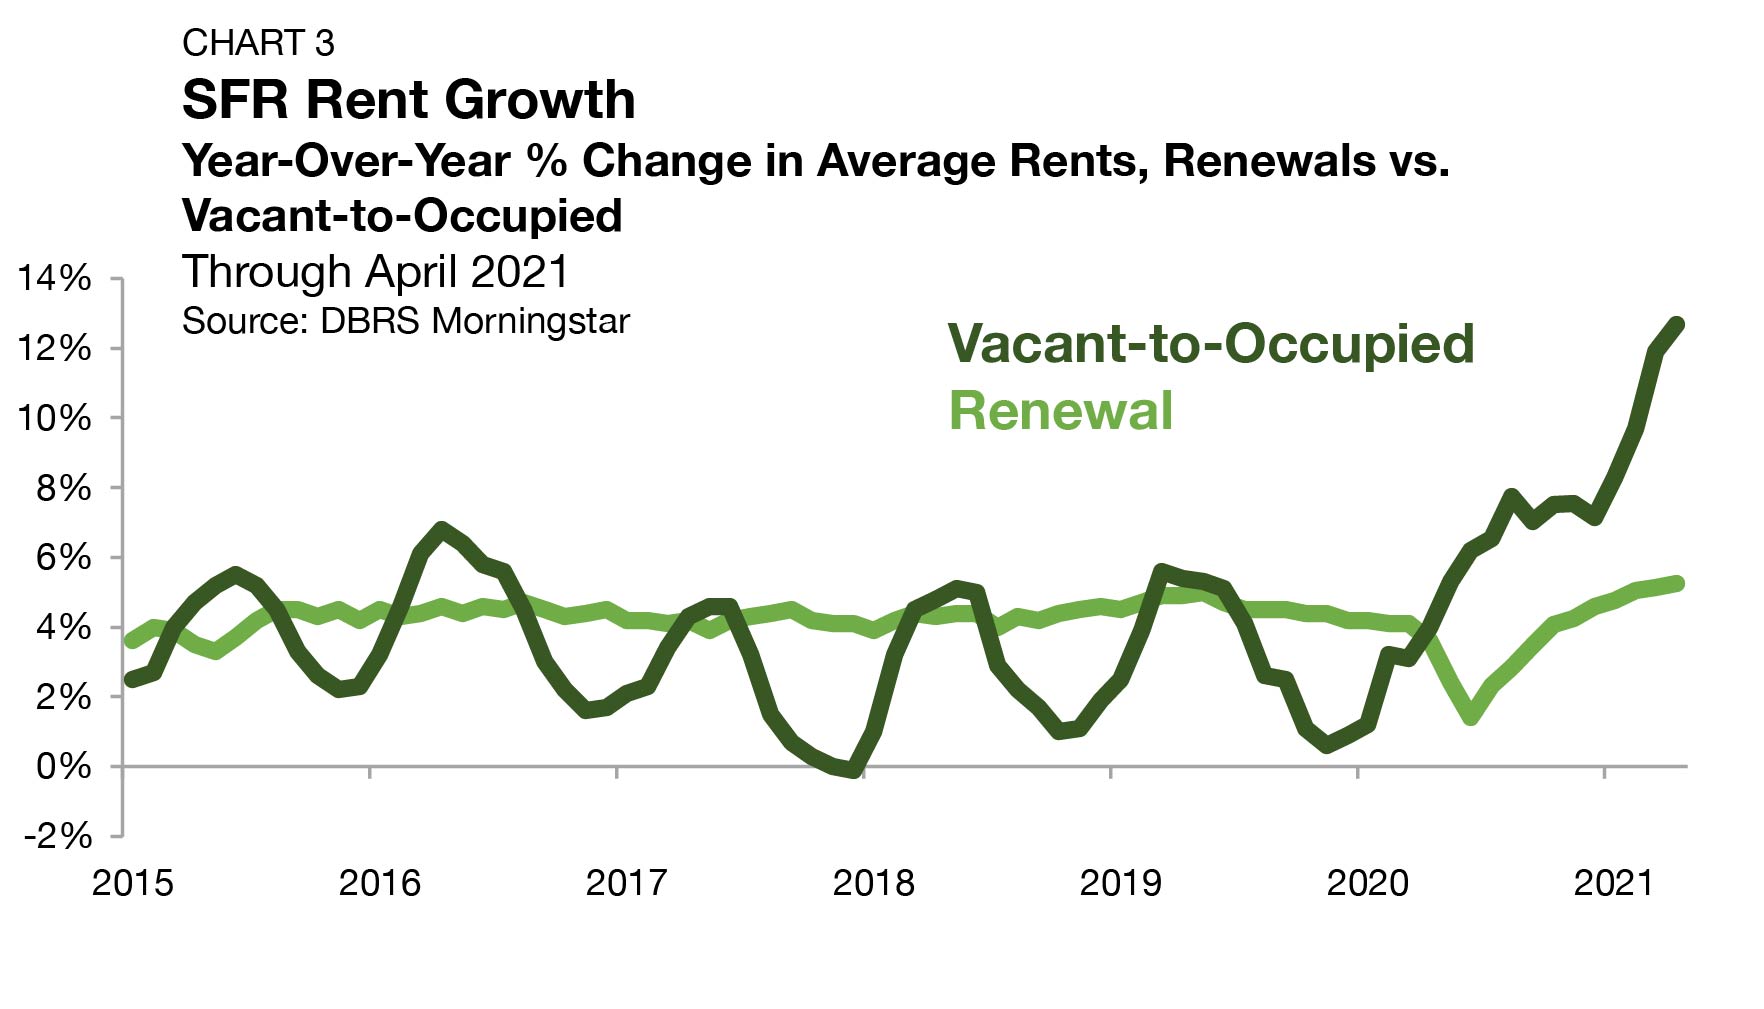
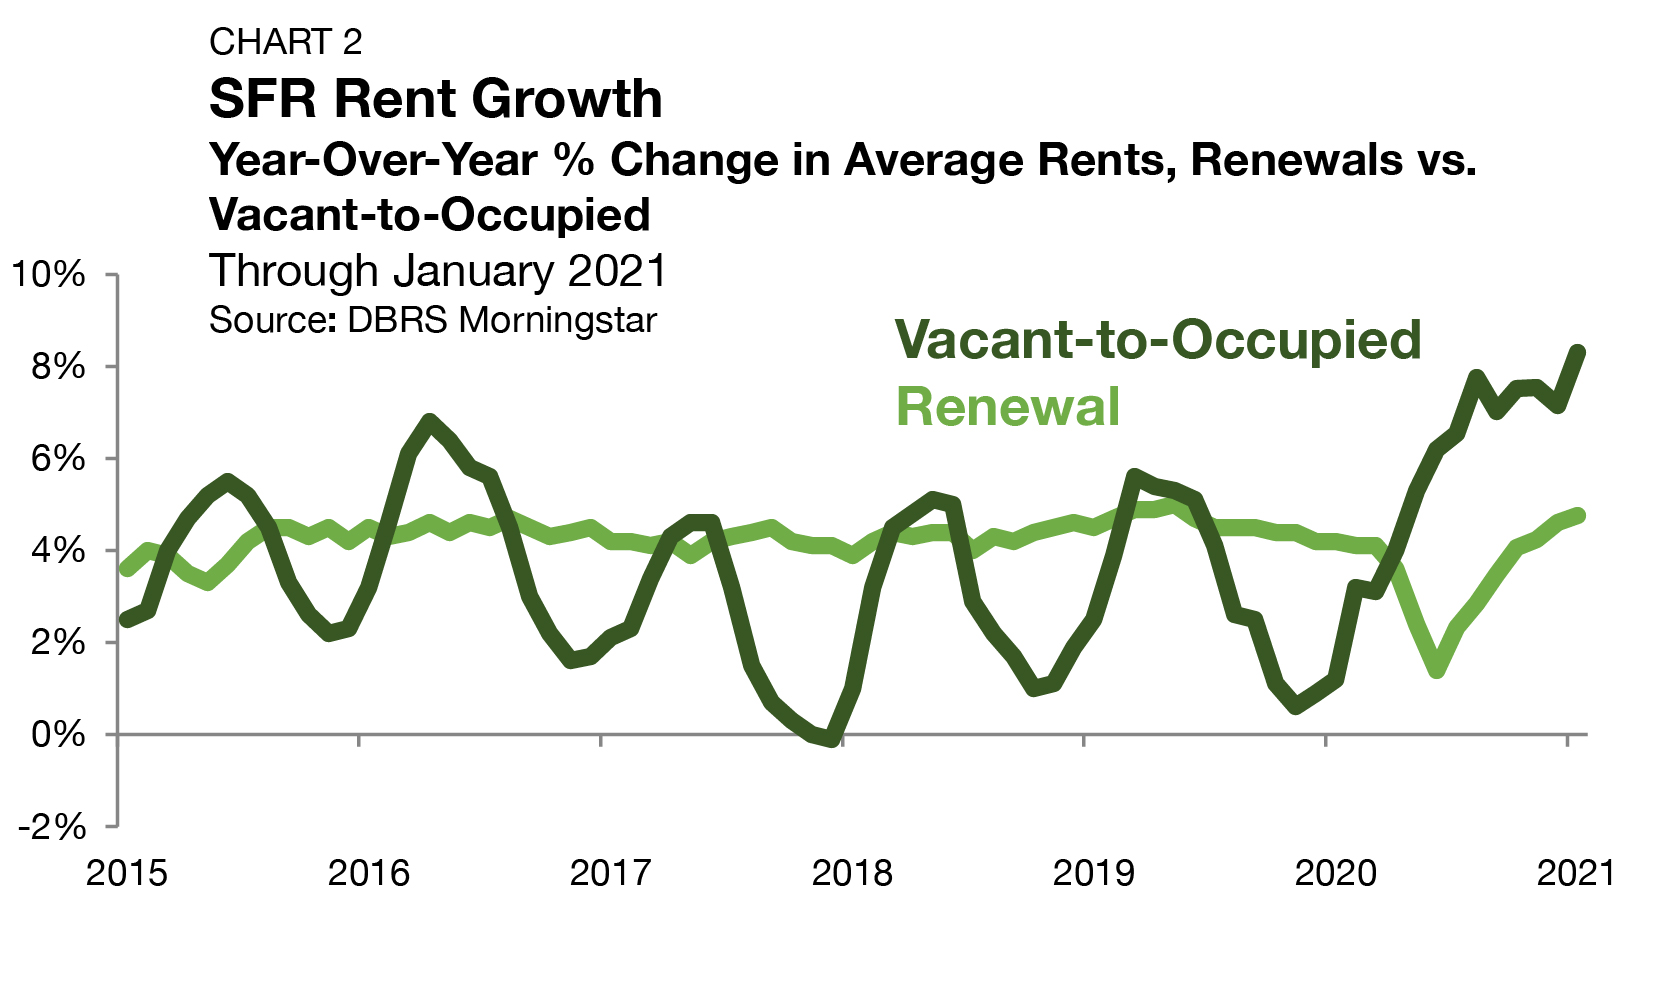
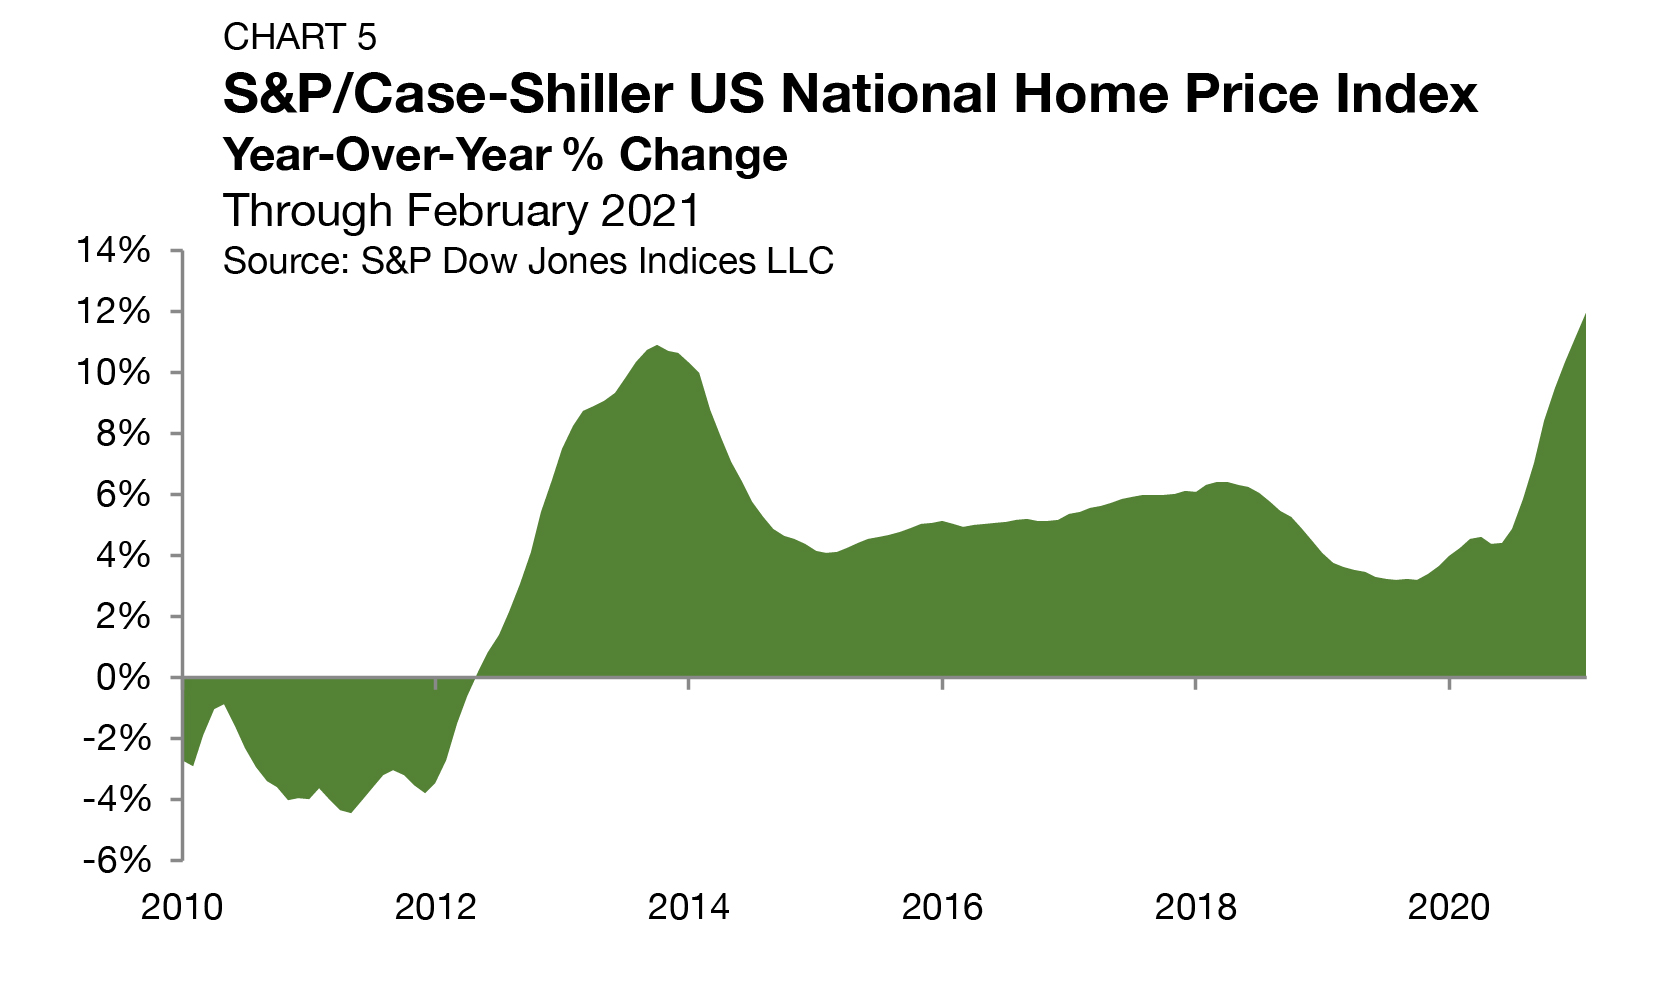
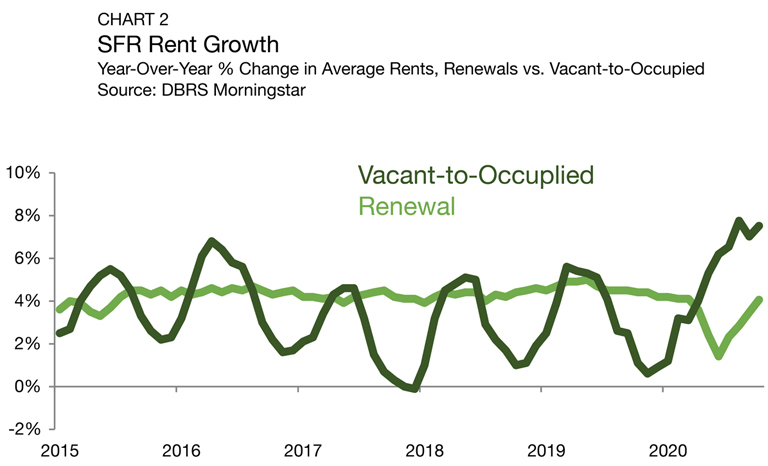
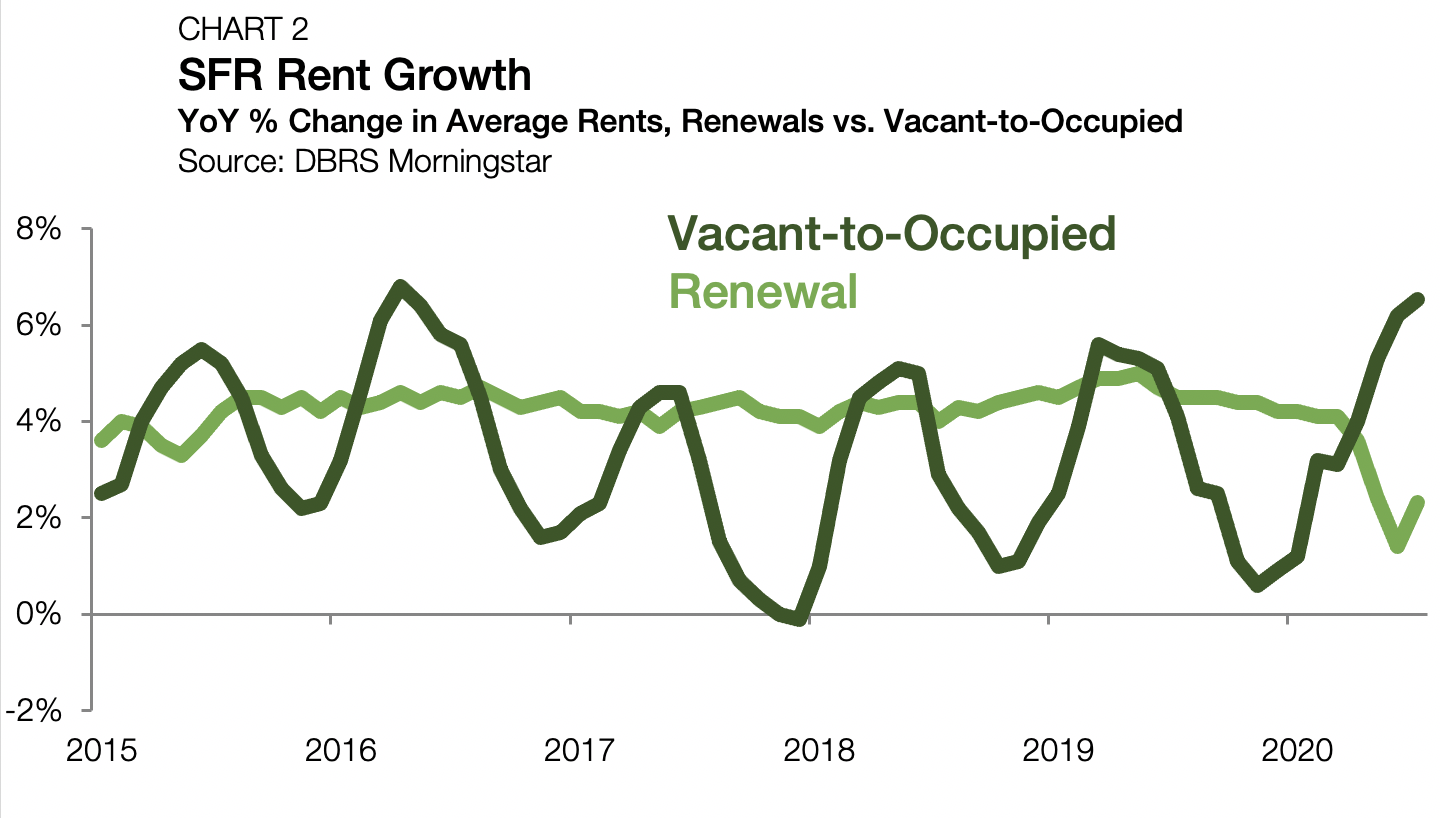
Annualized rent growth on vacant-to-occupied (V2O) SFR properties remains robust, though it has started to slow 1. According to DBRS Morningstar, V2O annual rent growth reached an all-time high of 17.1% in July 2021 before retreating in August and September (Chart 3). Through October 2021, the last month of available data, V2O annual rent growth sits at 13.5%— 359 bps off the July peak but still 670 bps higher than any pre-pandemic reading. The 2021 surge in V2O rents coincides with a historic rise in home property values. According to the S&P/Case-Shiller Home U.S. National Home Price Index, annual home price appreciation reached a high watermark of 19.0% in August.
For lease renewals, annual rent growth hit a record high in September 2021, reaching up to 7.2%. Through October, the latest month of available data, average rents in lease renewals are up by 6.9% from a year earlier. Between 2015 and the onset of the pandemic in 2020, SFR renewal rent growth consistently ranged between 3.3% and 5.0%. Since February 2021, SFR renewal rent growth has topped the 5.0% mark in nine consecutive months of observations.
Unsurprisingly, the Sun Belt has maintained its SFR rent growth dominance over the past year at the metro level. According to CoreLogic’s Single-Family Rent Index (SFRI), annual rent growth across the top 20 U.S. metros through November was highest in Miami, Phoenix, and Las Vegas, climbing by 33%, 19%, and 17%, respectively. According to a recent report by Redfin, the trio of Miami, Phoenix, and Las Vegas account for the three U.S. metros with the highest net inflows of new residents.
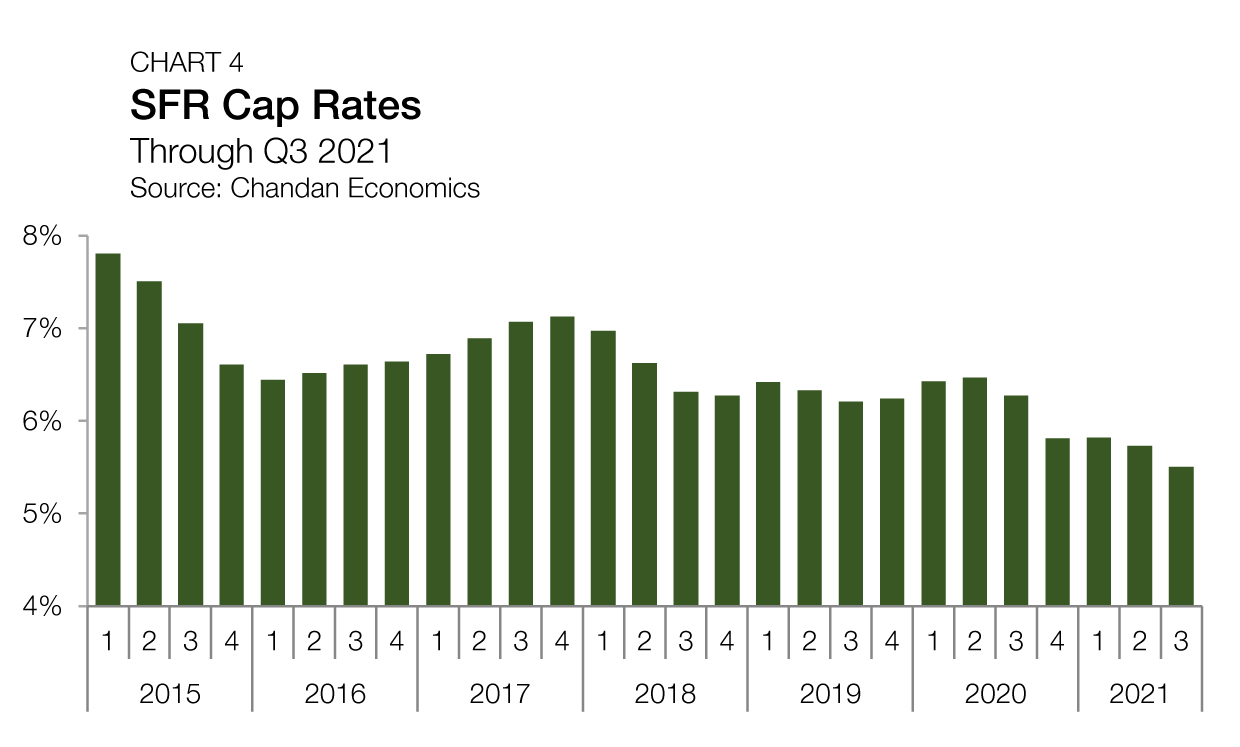
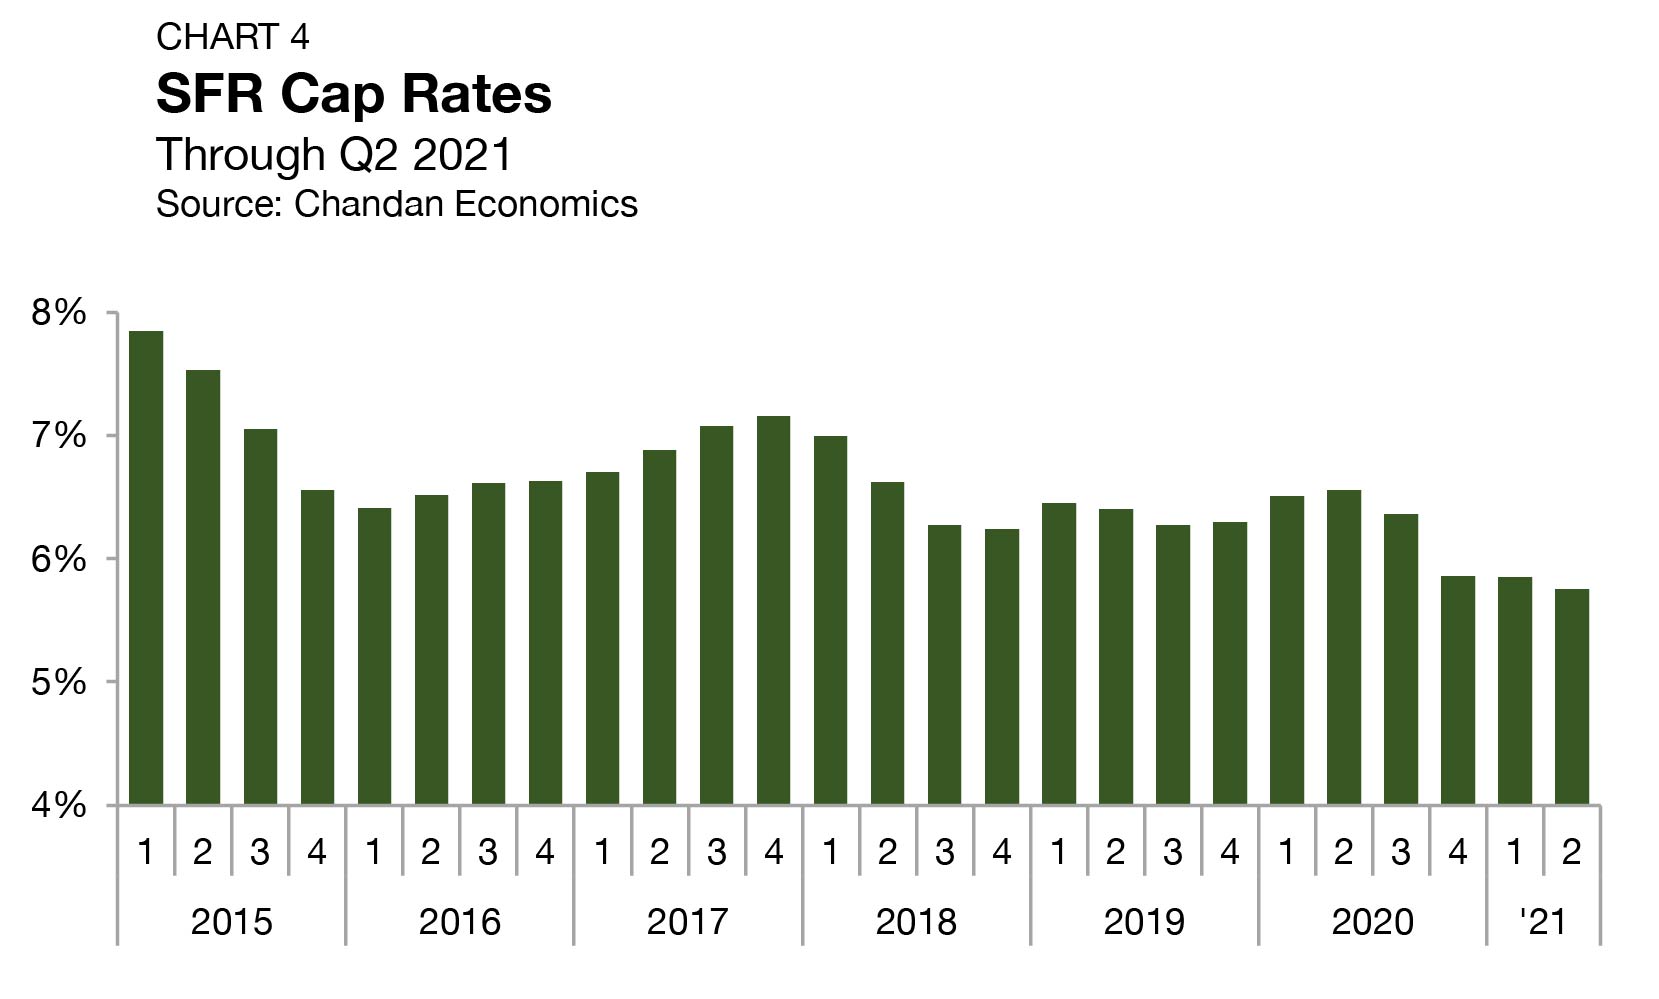
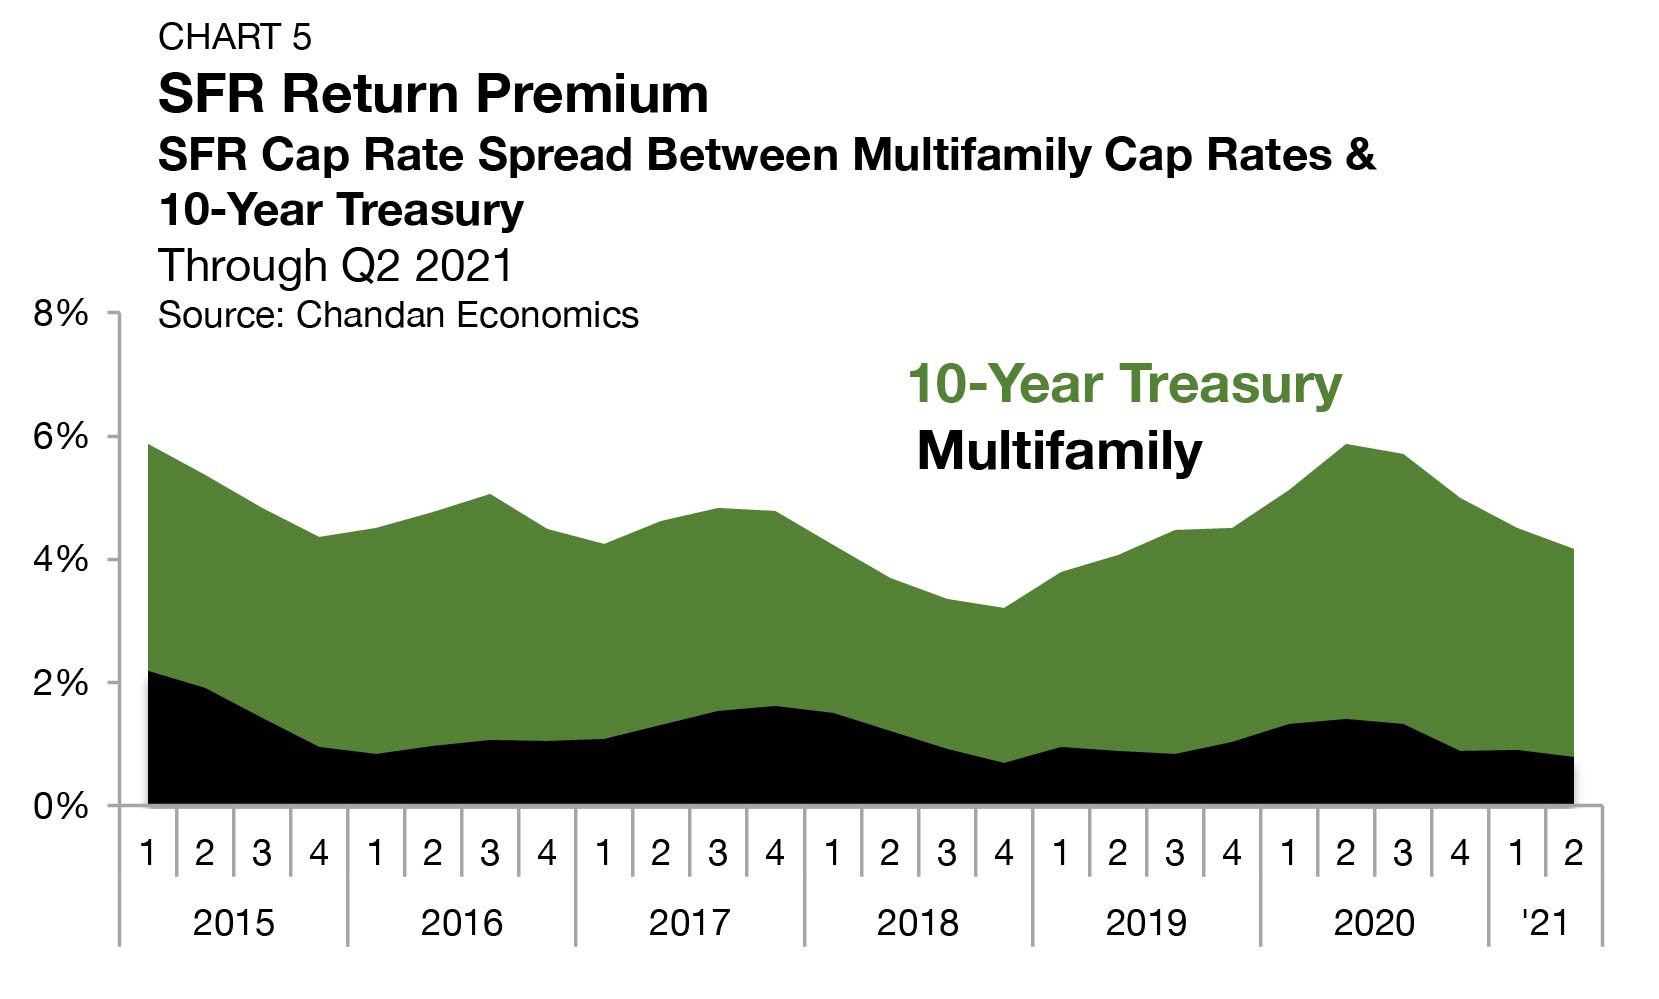
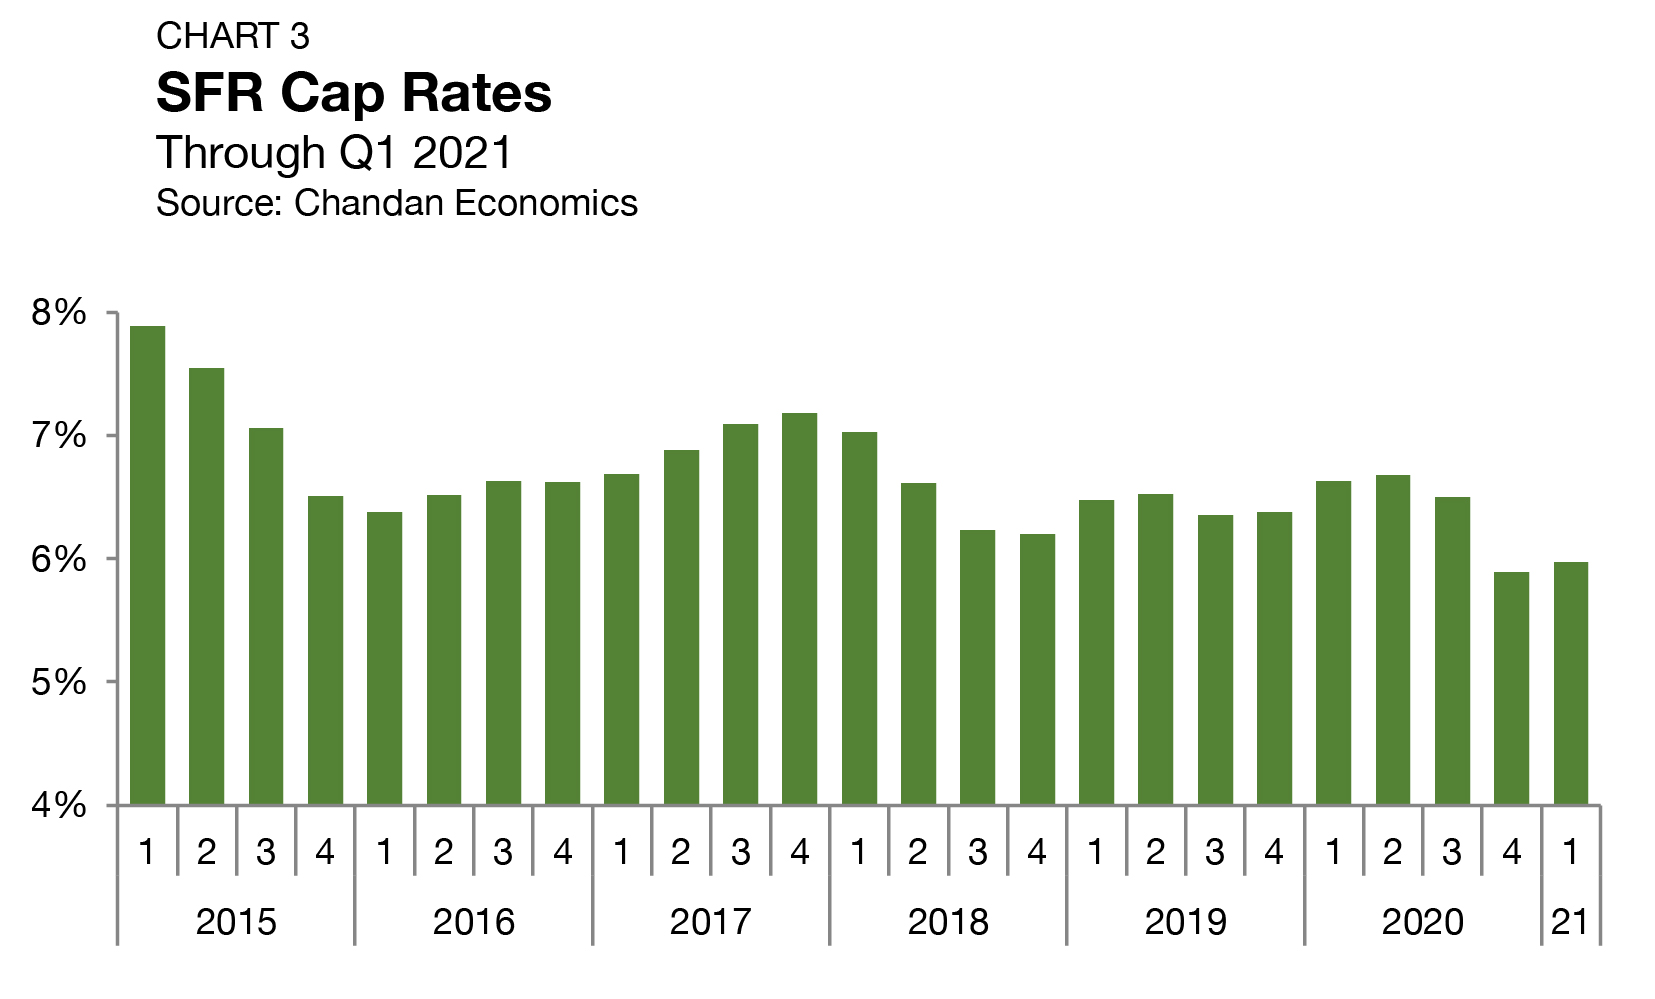
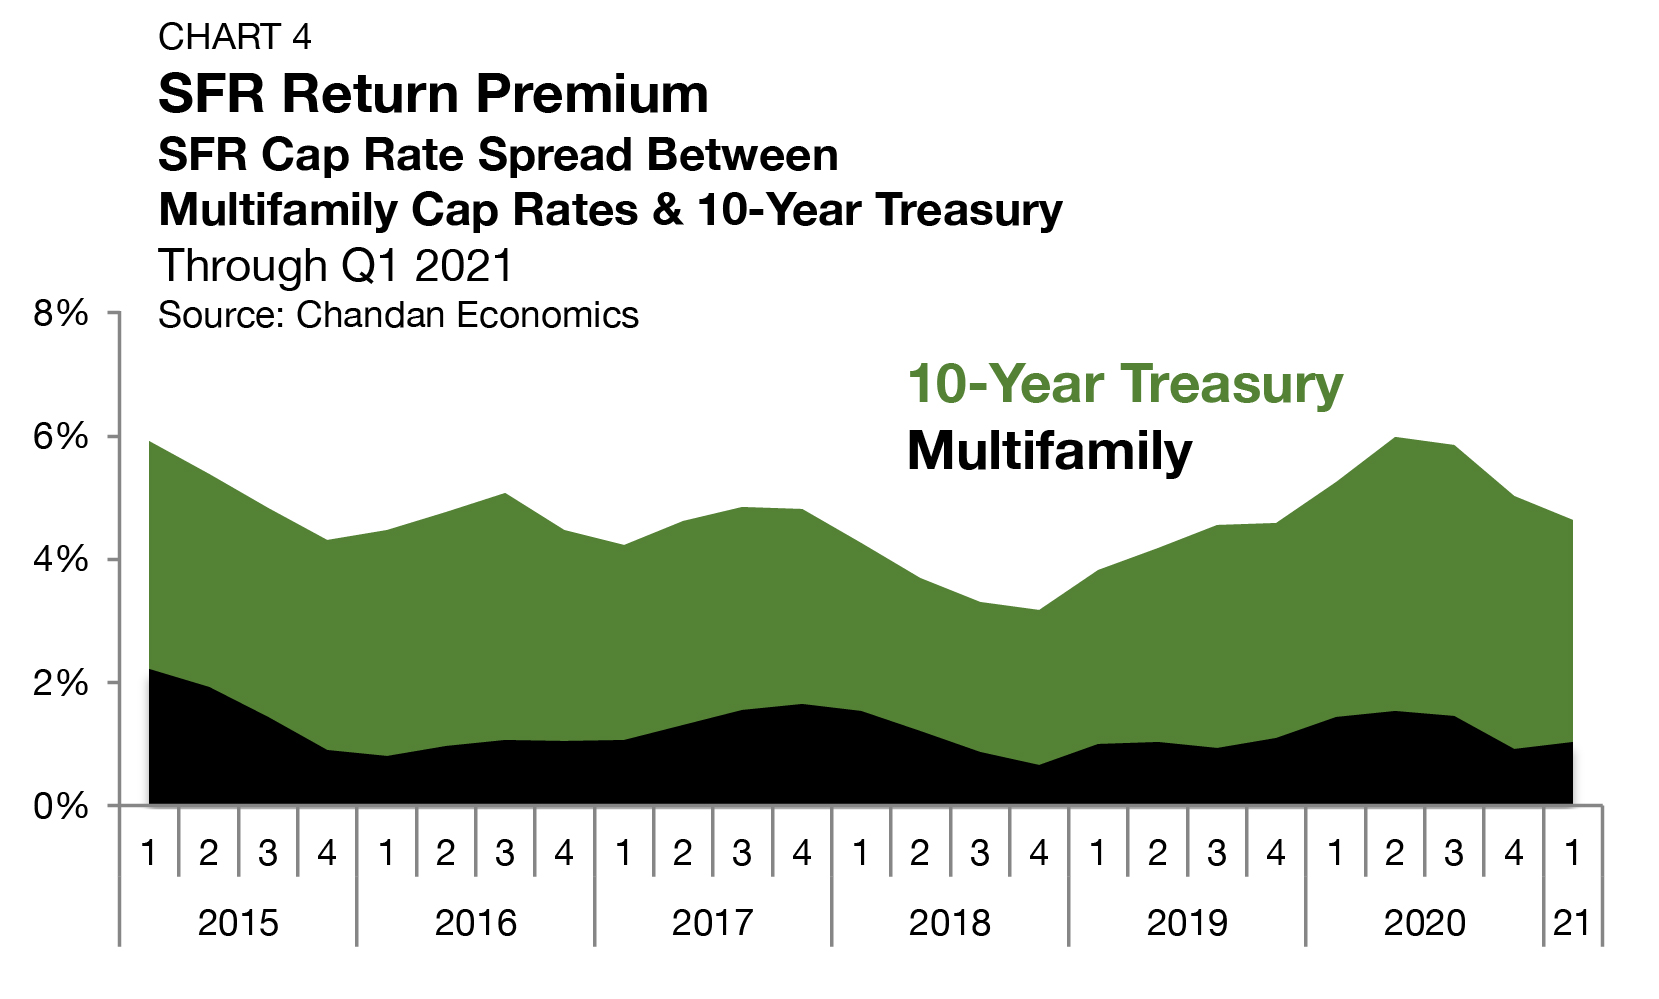
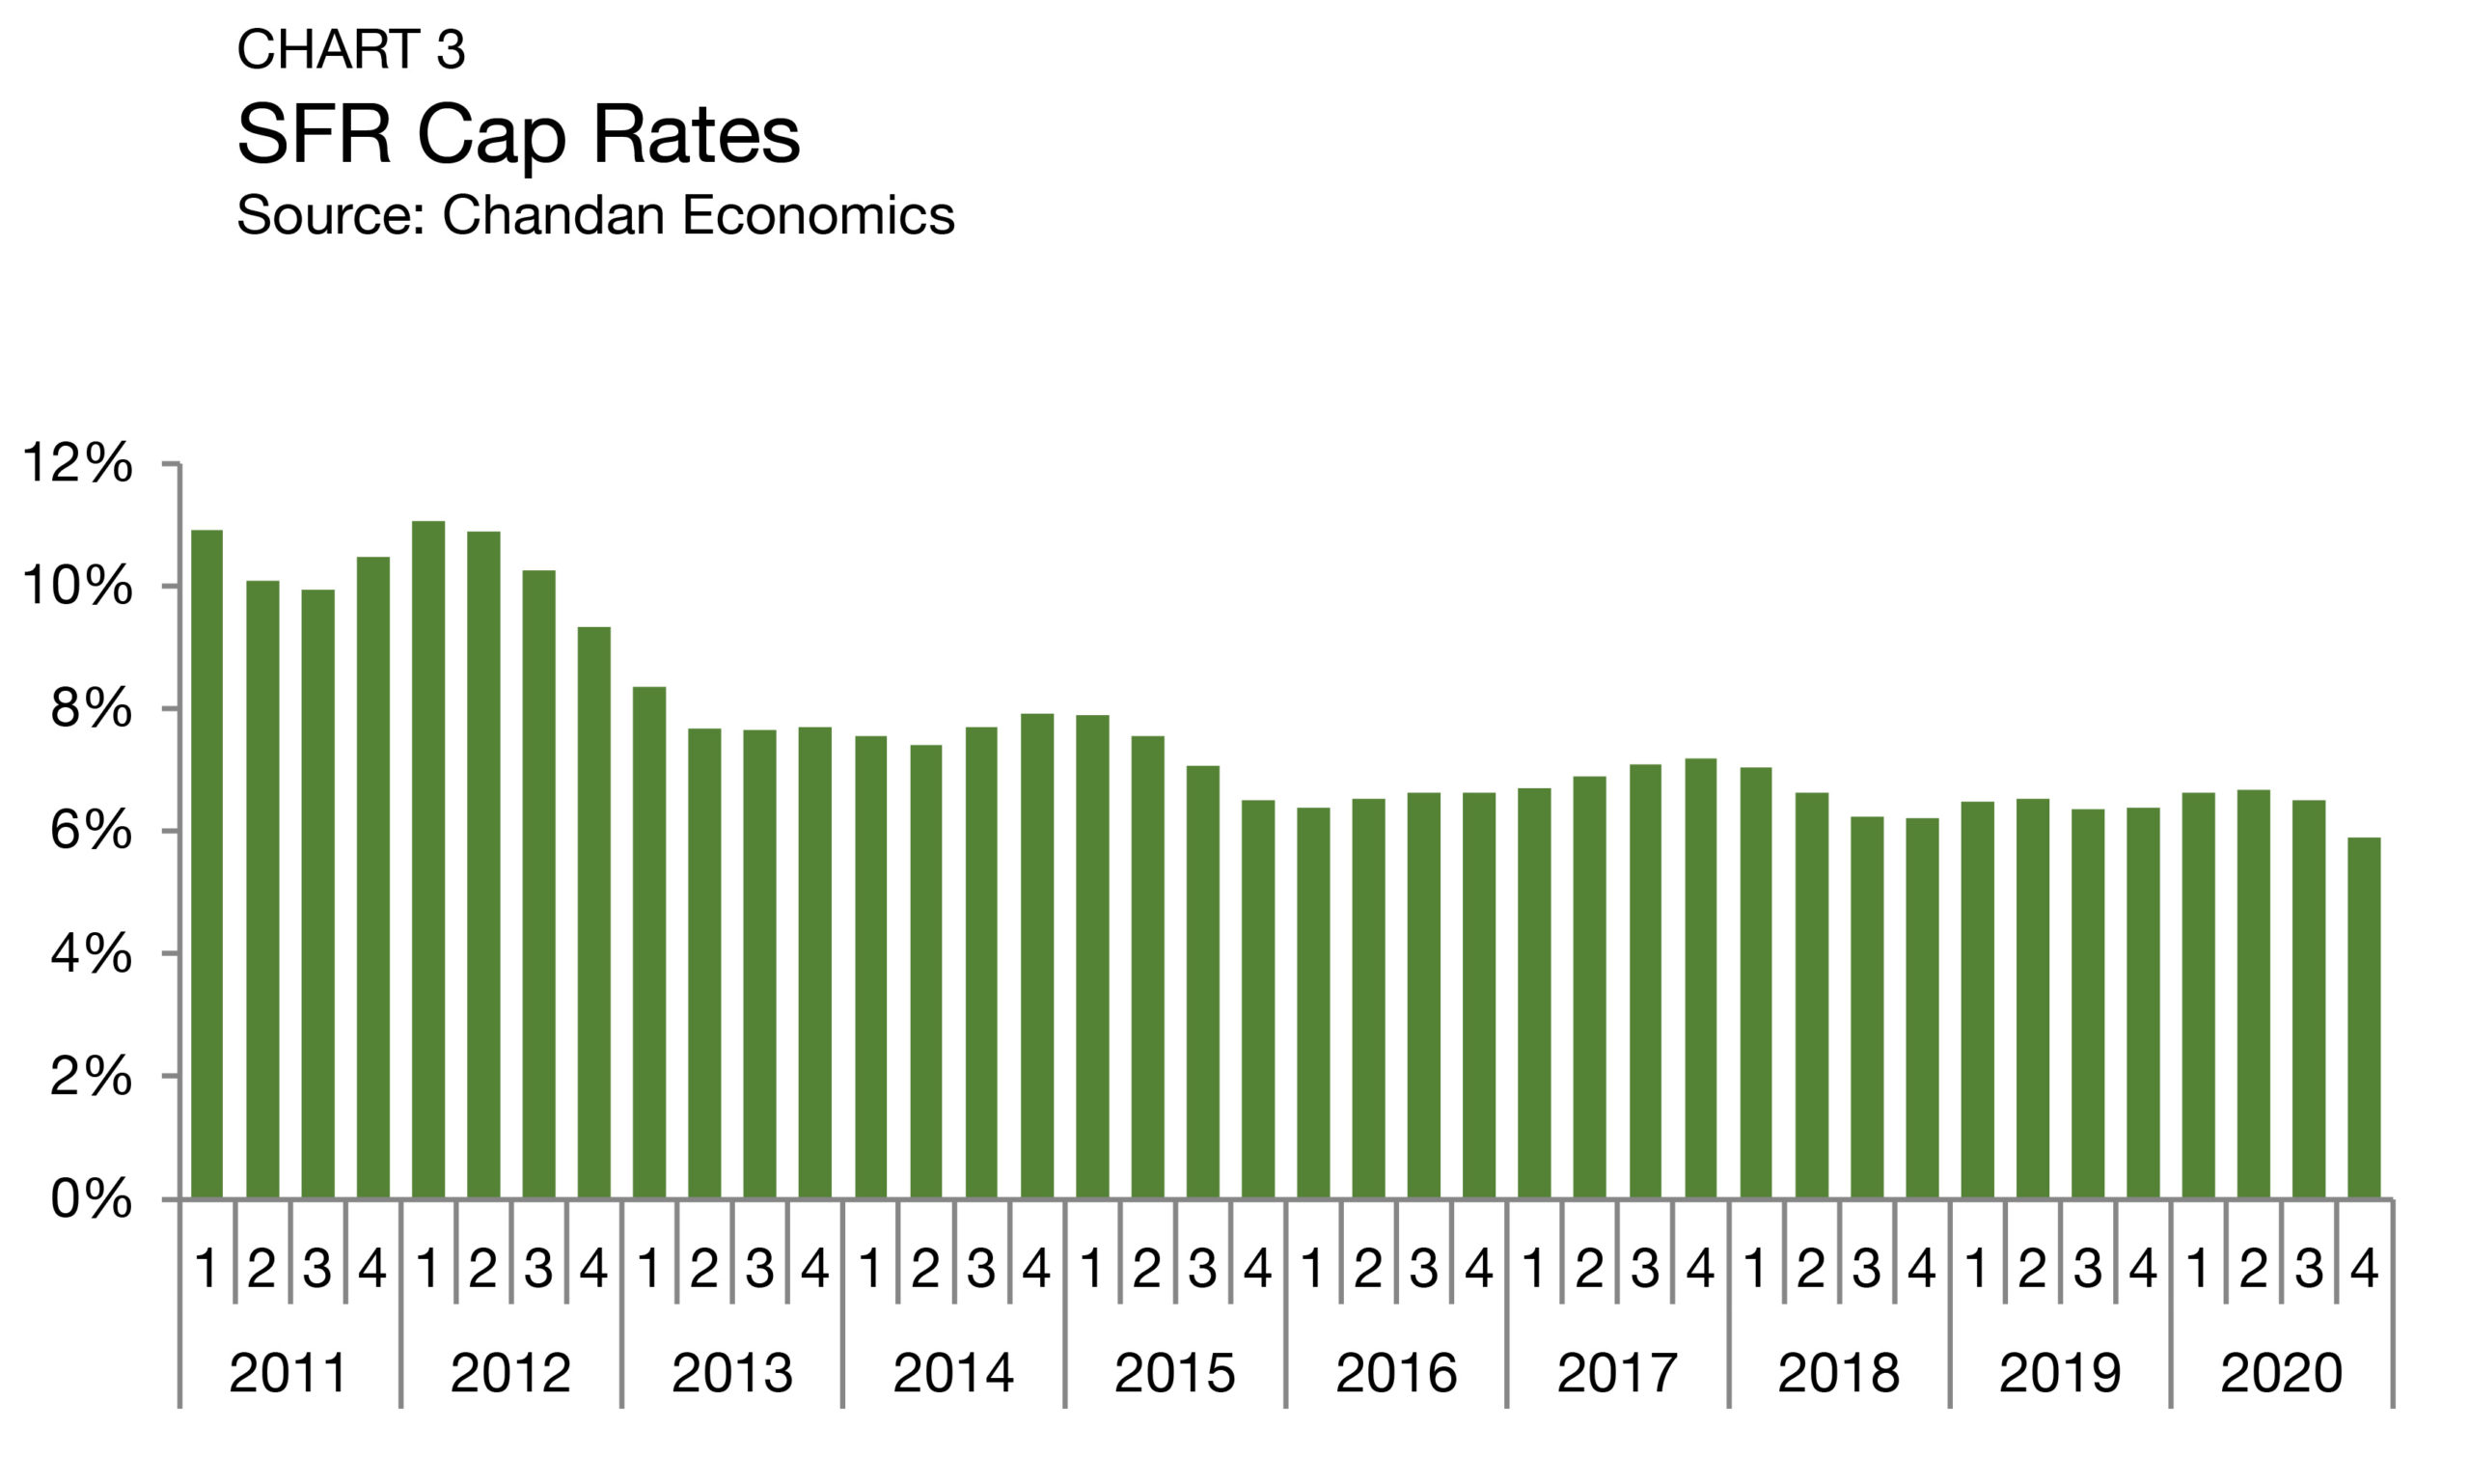
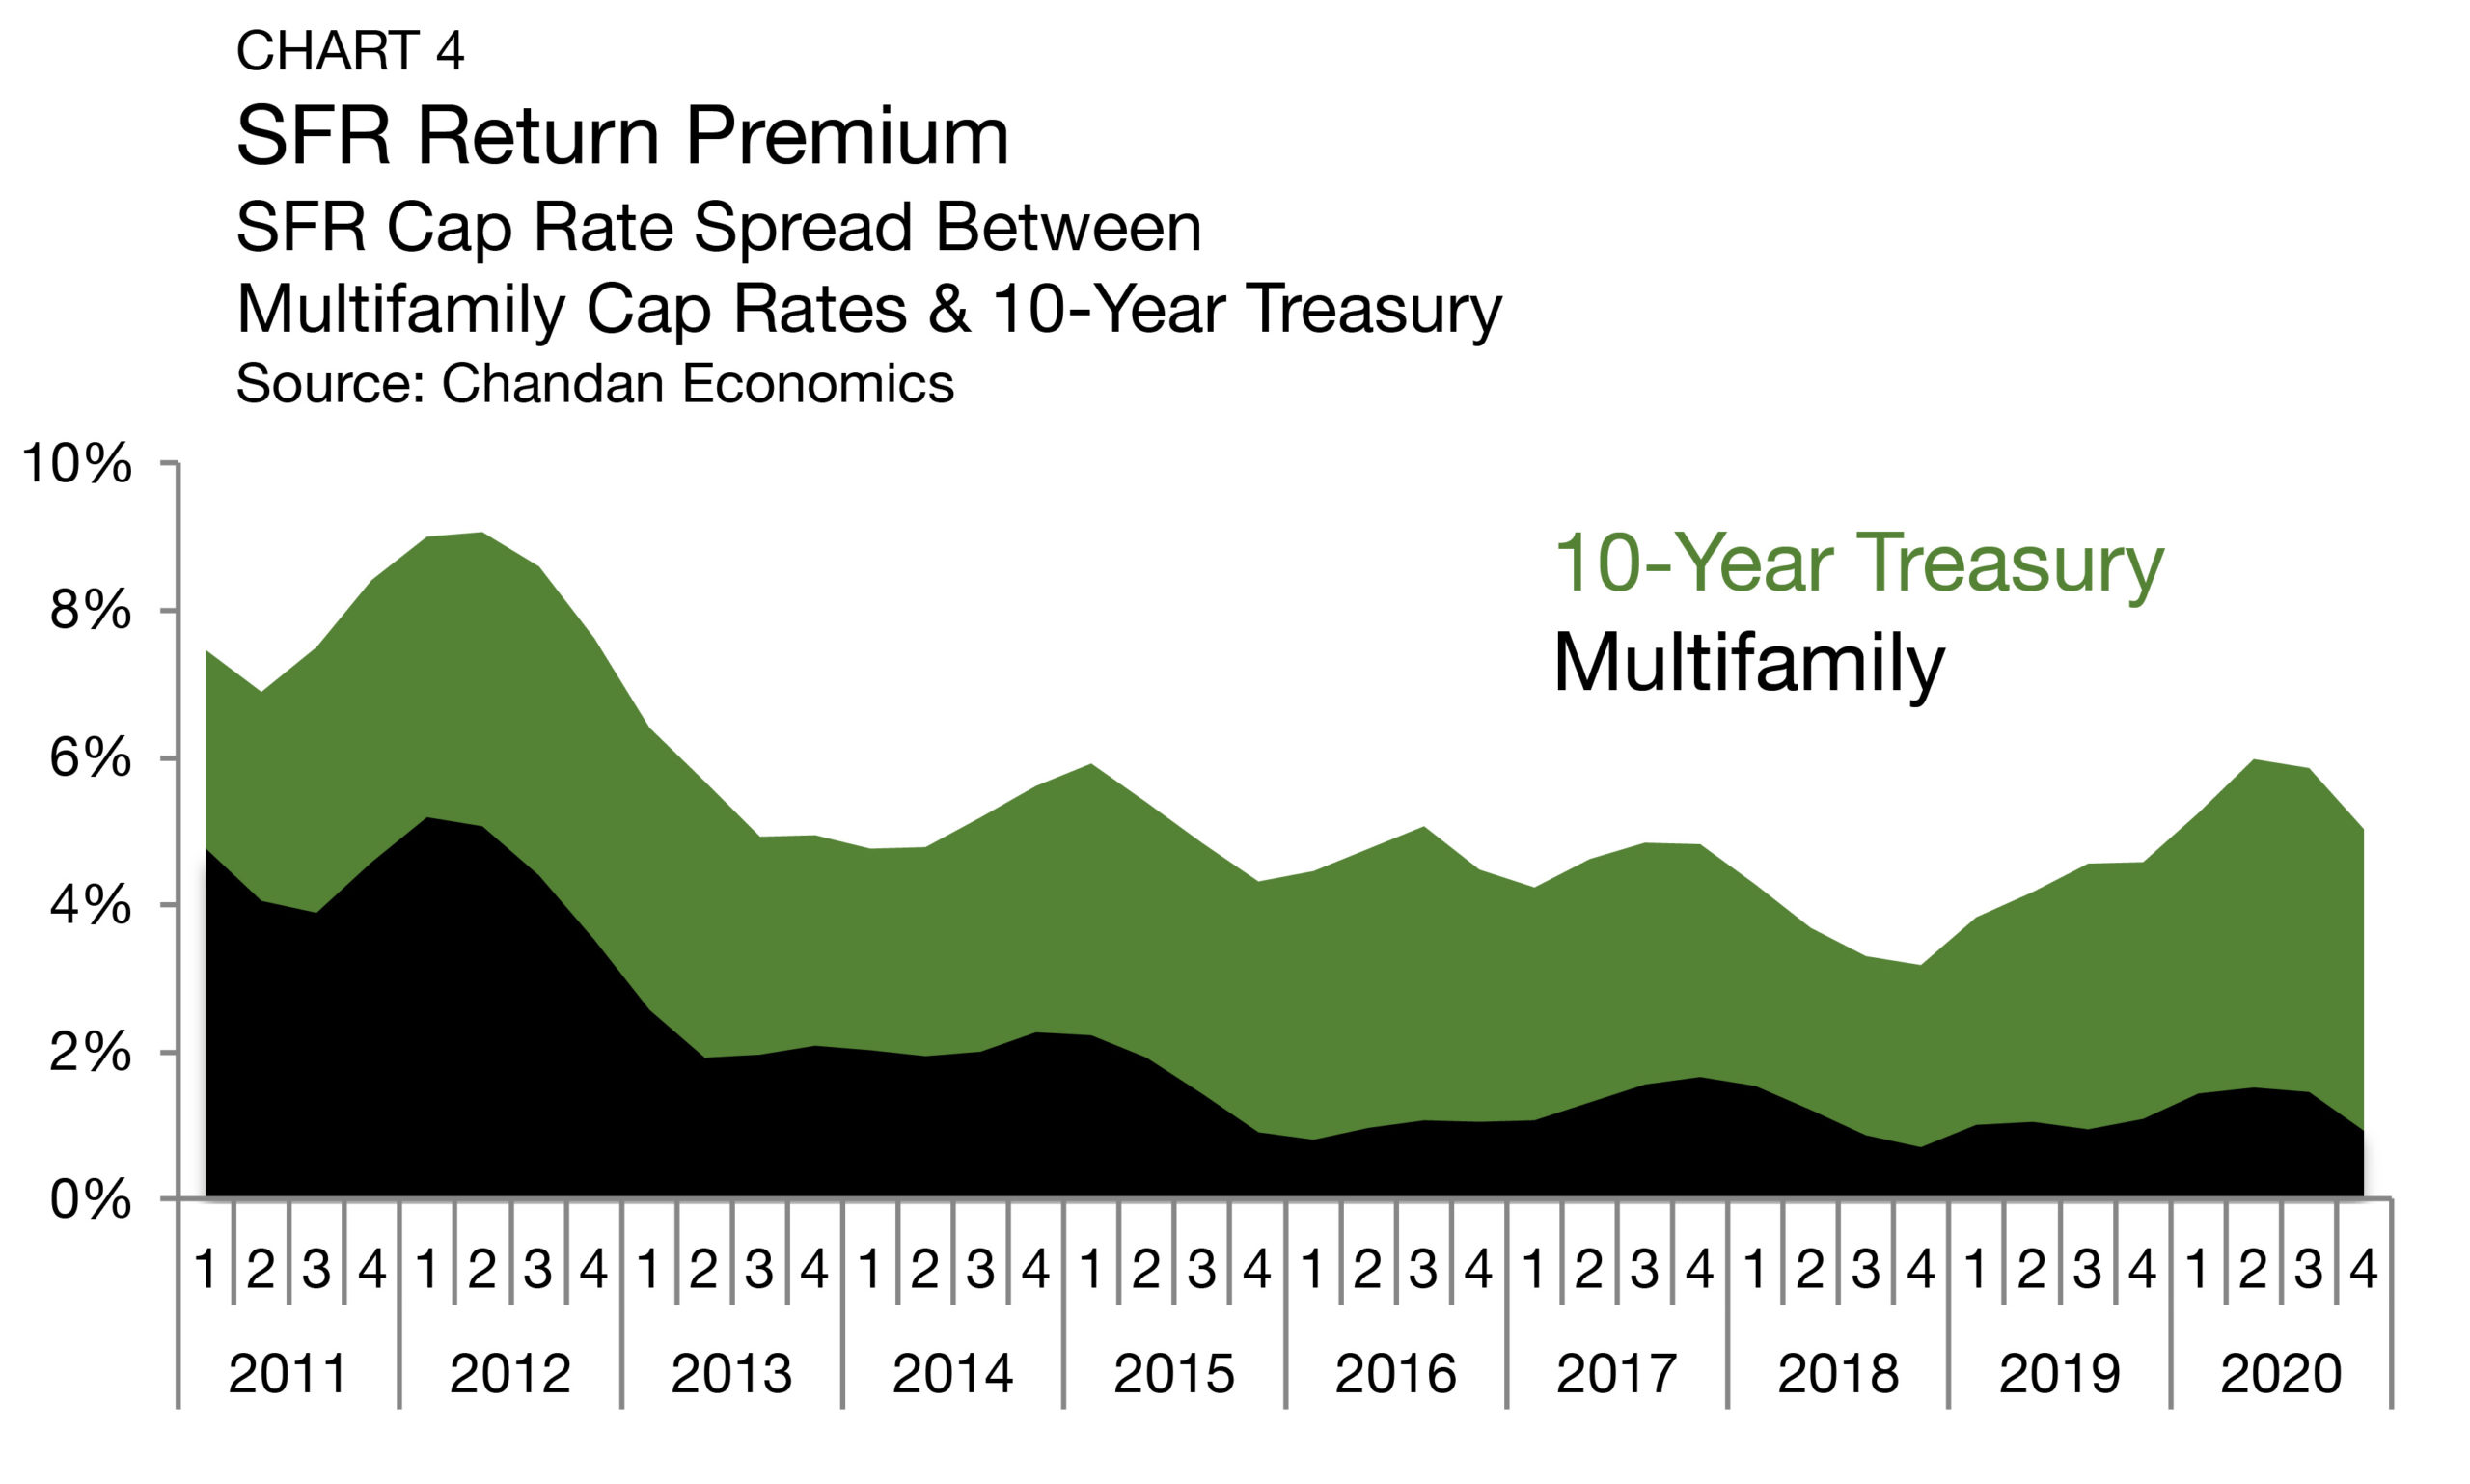
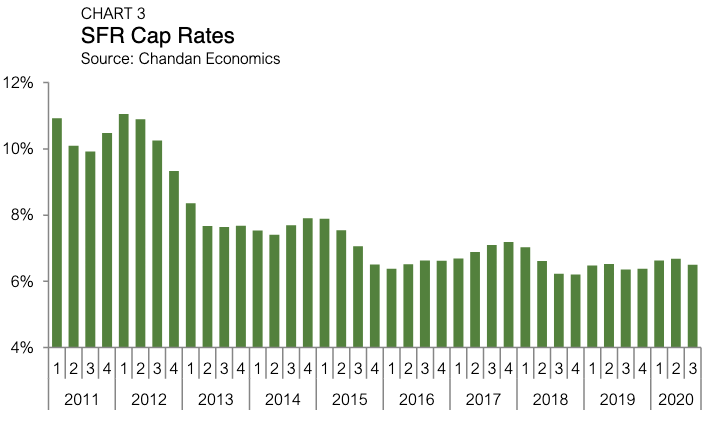
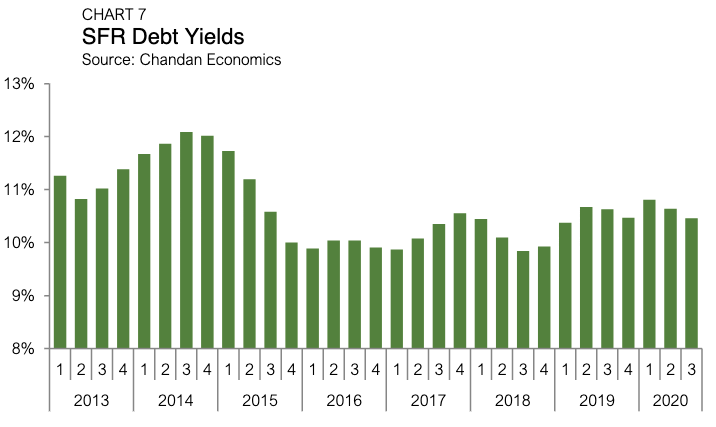
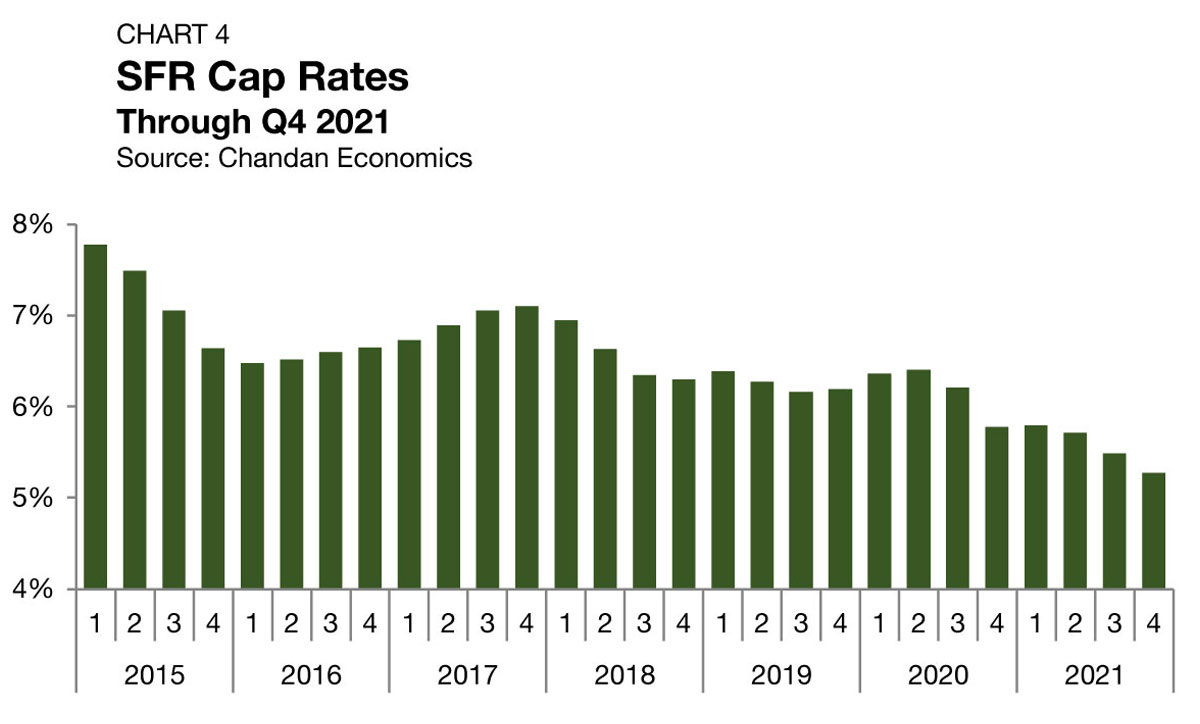
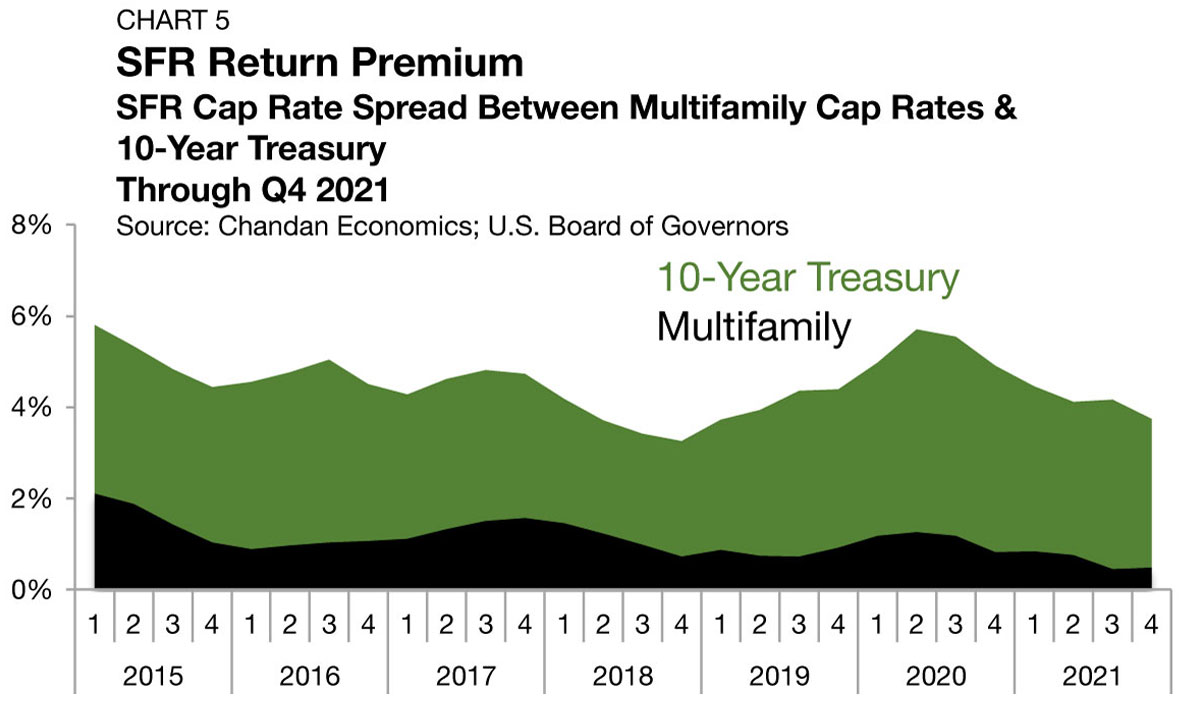
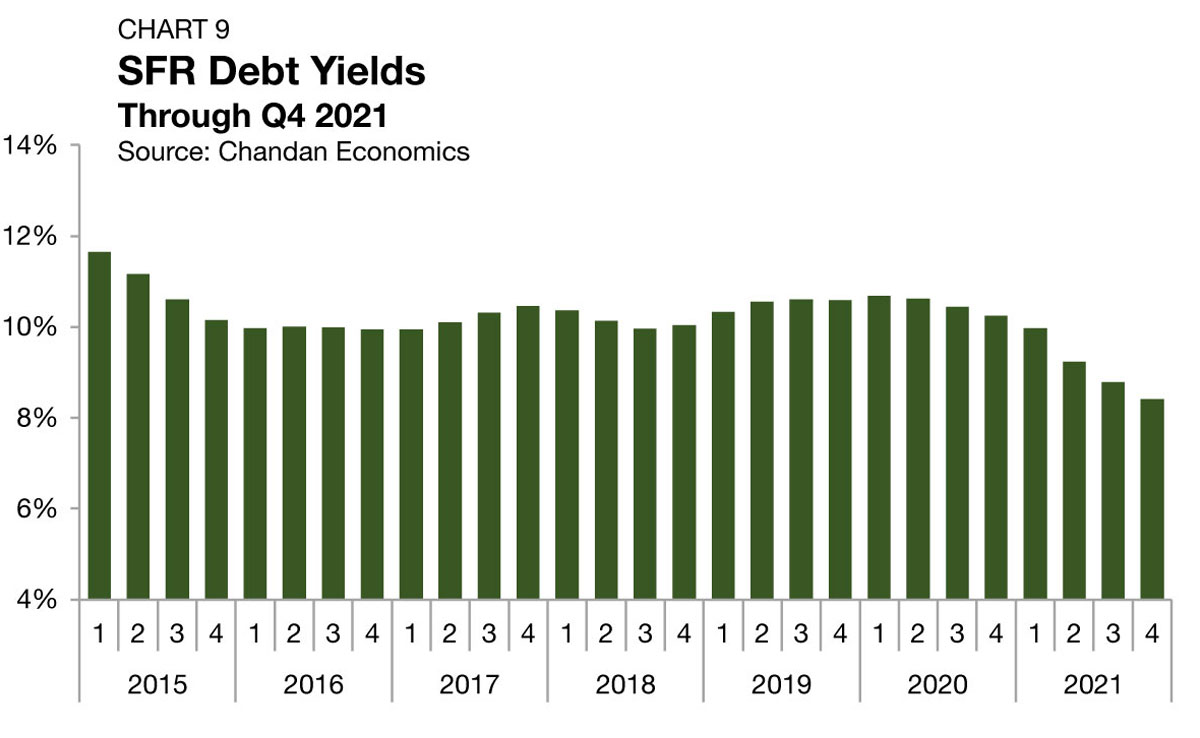
Property-level yields for SFR assets continued to compress in the fourth quarter of 2021, reflecting that growing investor demand continues to outpace the delivery of new SFR supply. Through the fourth quarter of 2021, SFR cap rates averaged 5.3%, down 21 bps from the previous quarter and down 50 bps from the same time last year (Chart 4) 2. The fourth-quarter reading marks the lowest observed cap rates since Chandan Economics began tracking the sector in 2011. Moreover, SFR cap rates have fallen for four consecutive quarters after marginal increases in 2020.
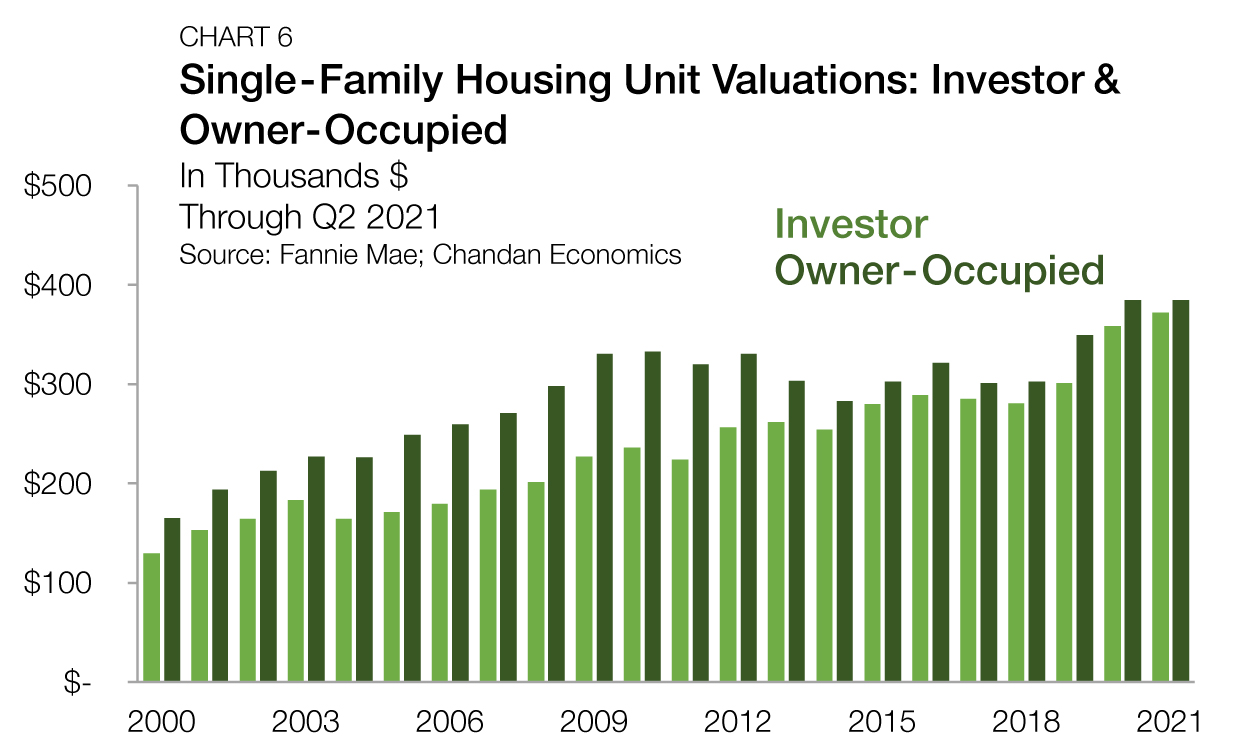
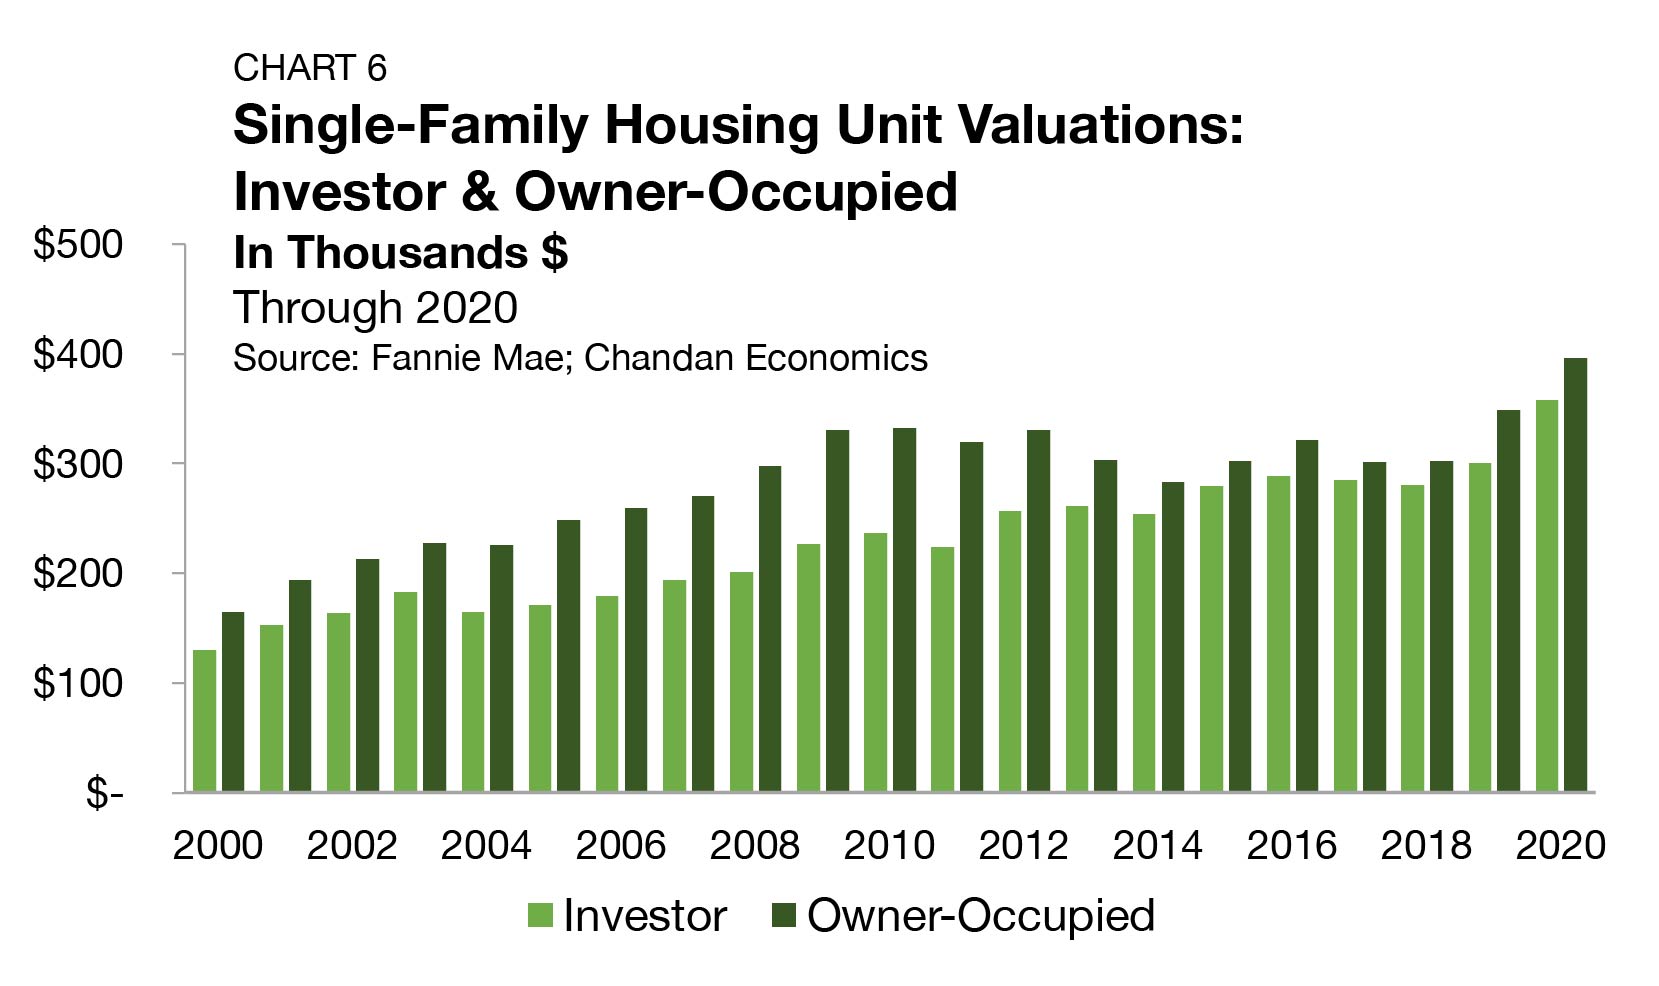
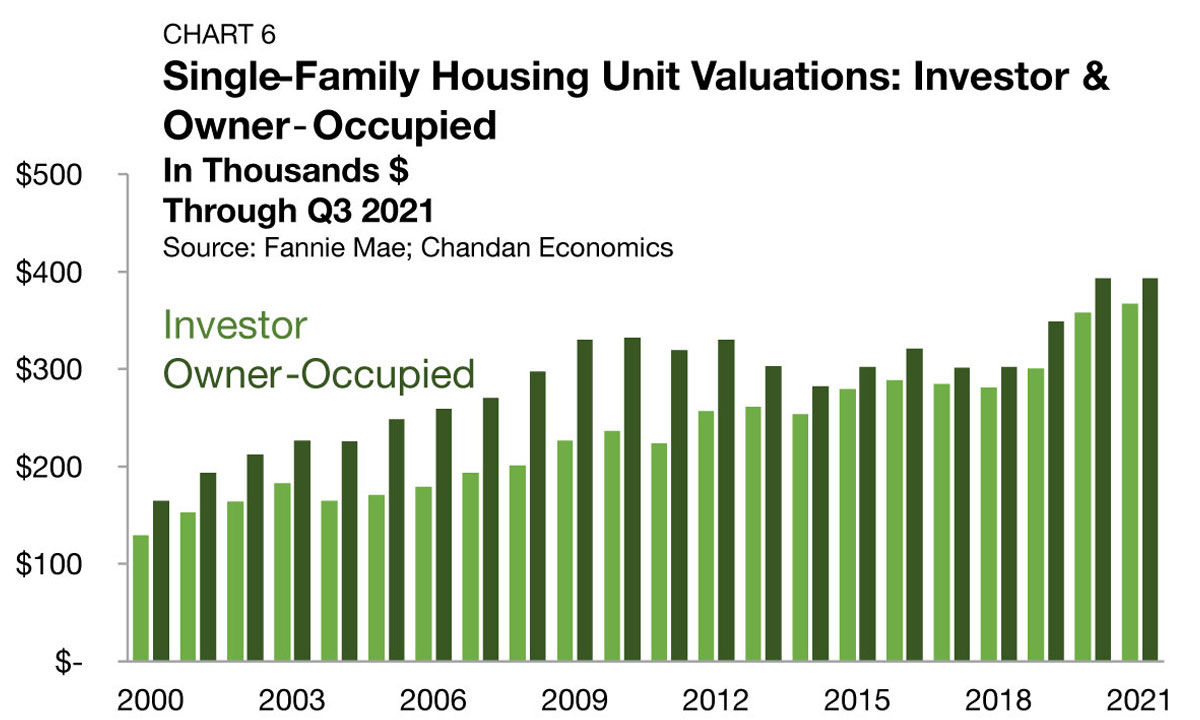
According to a Chandan Economics analysis of Fannie Mae securitized mortgages, there are material differences between the average assessed property values on mortgages originated to single-family owner-occupants versus single-family investors. Through the third quarter of 2021, the average underwritten value of a single-family investment property last year has averaged $367,250 compared to $407,387 for owner-occupied units (Chart 6).
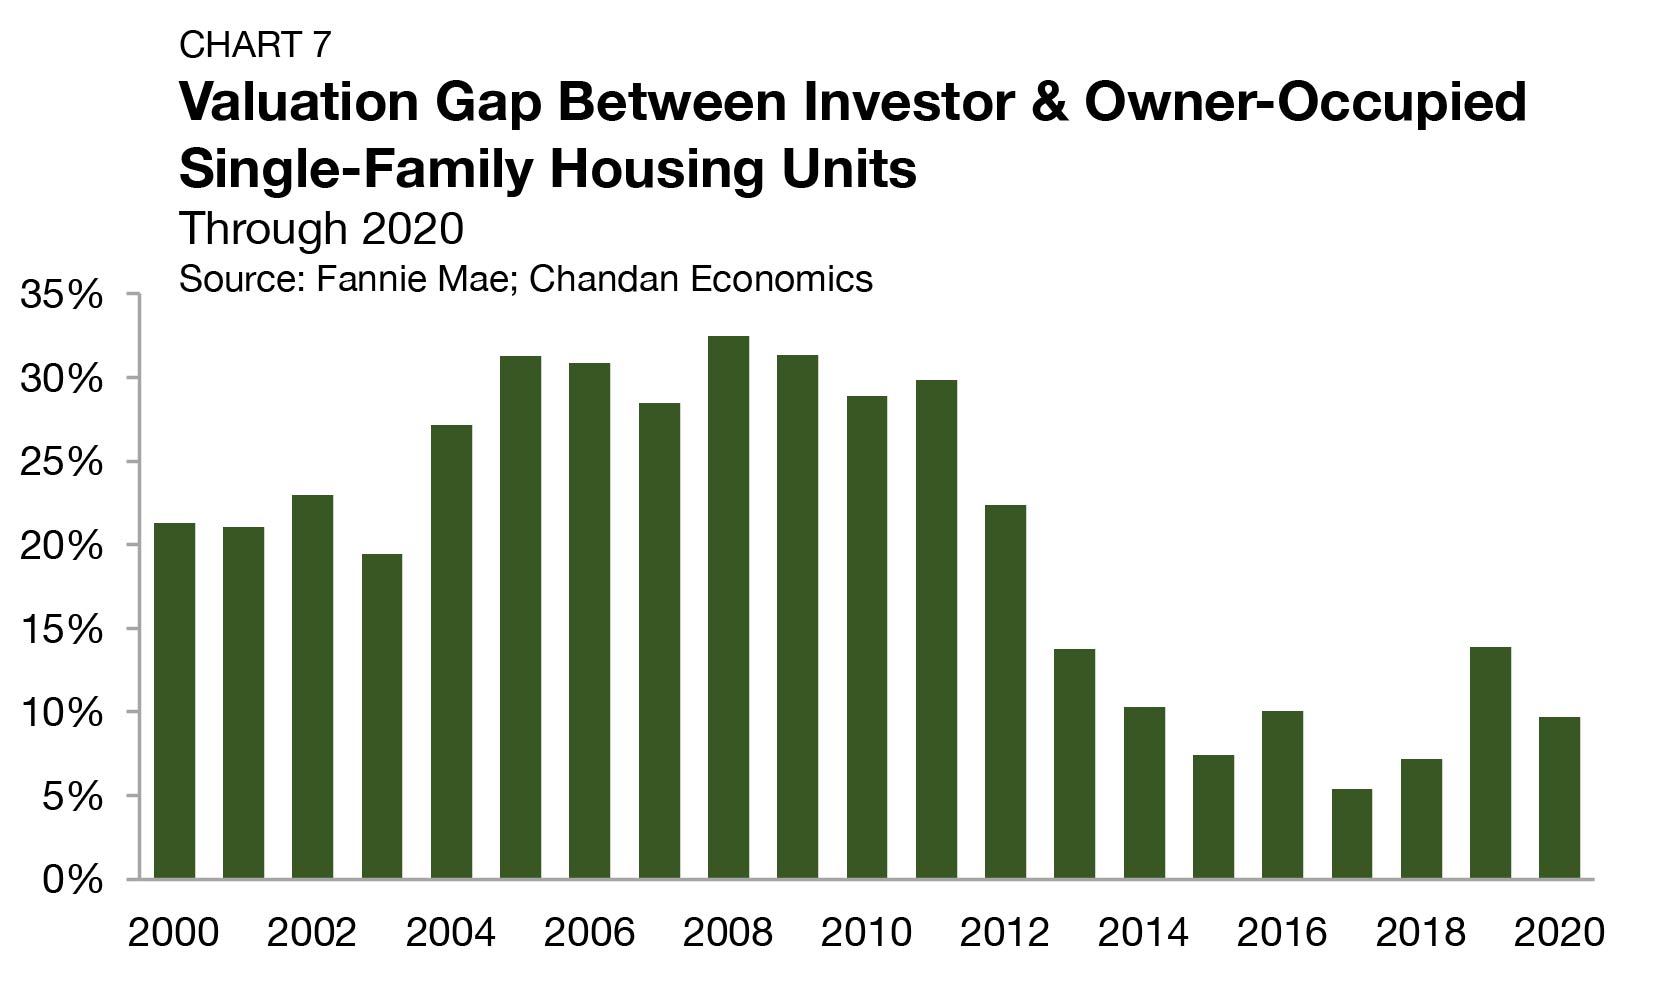
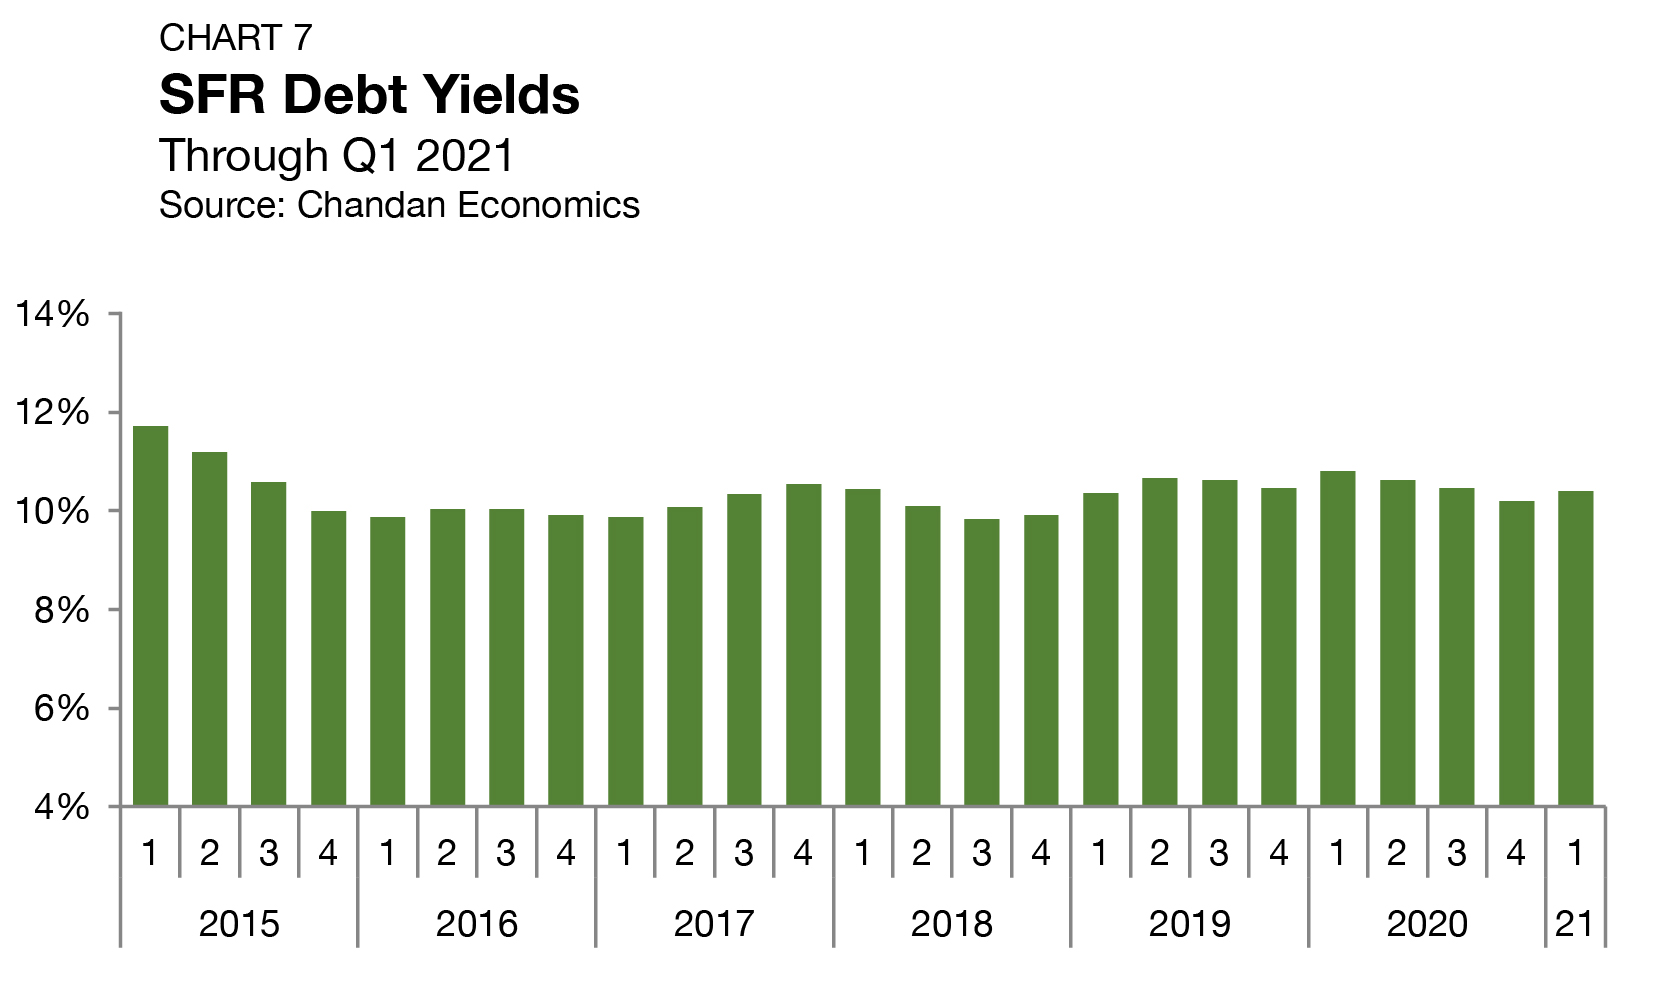
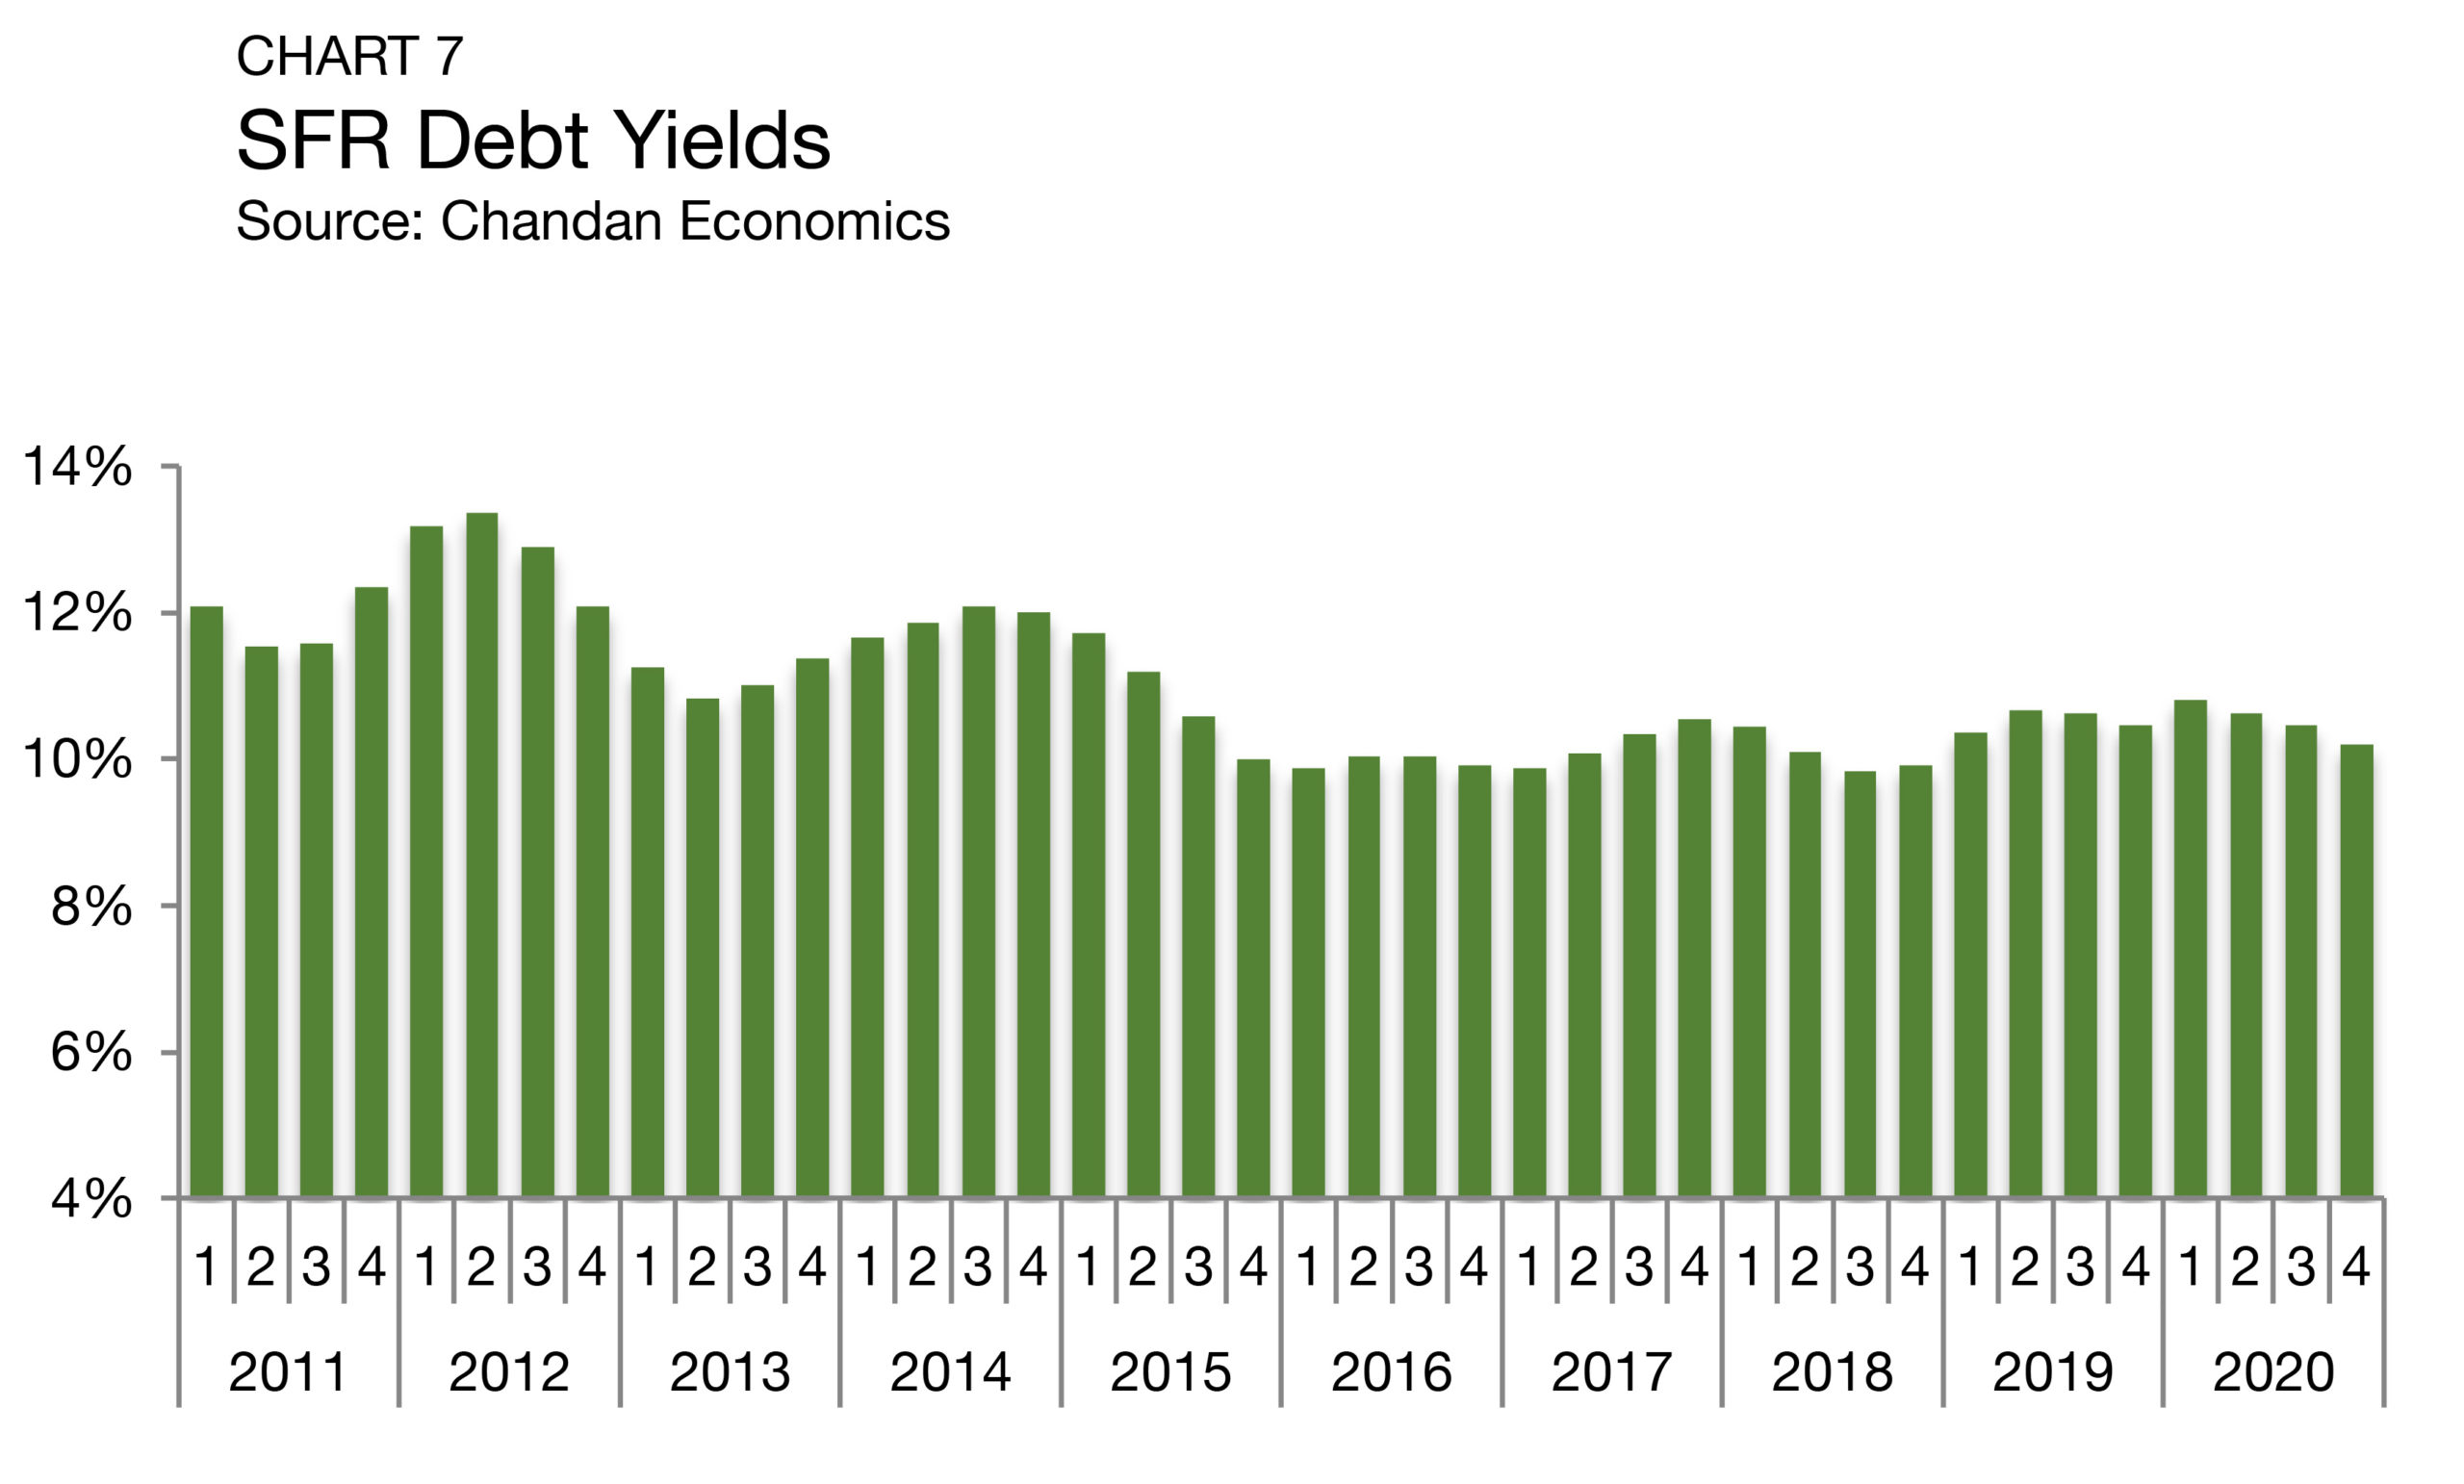
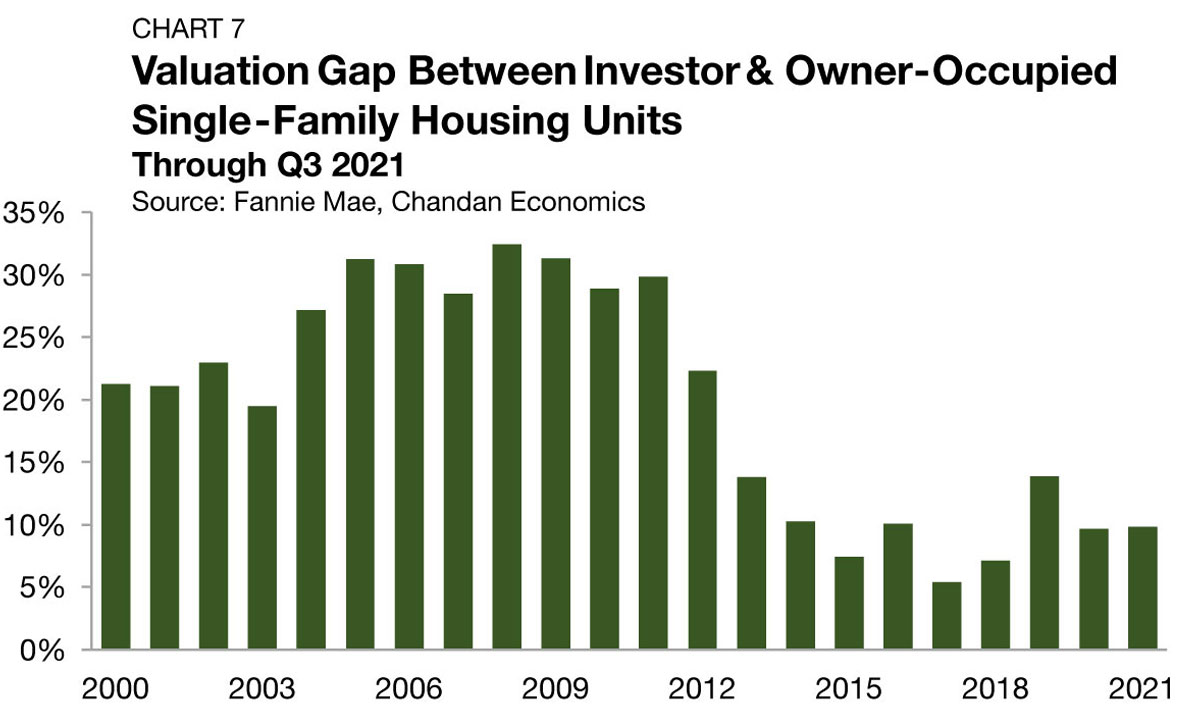
Between 2004 and 2011, the valuation gap sat in a consistent range of 27.2% to 32.5% (Chart 7). As more investors and capital entered the SFR space, discounted investment units became harder to find and competition for inventory ramped up. The valuation gap fell to an all-time low of 5.4% in 2017 before moderating in the years since. Through the third quarter of 2021, the average valuation gap this year has sat at 9.9%— a marginal 18 bps increase from the 2020 average.
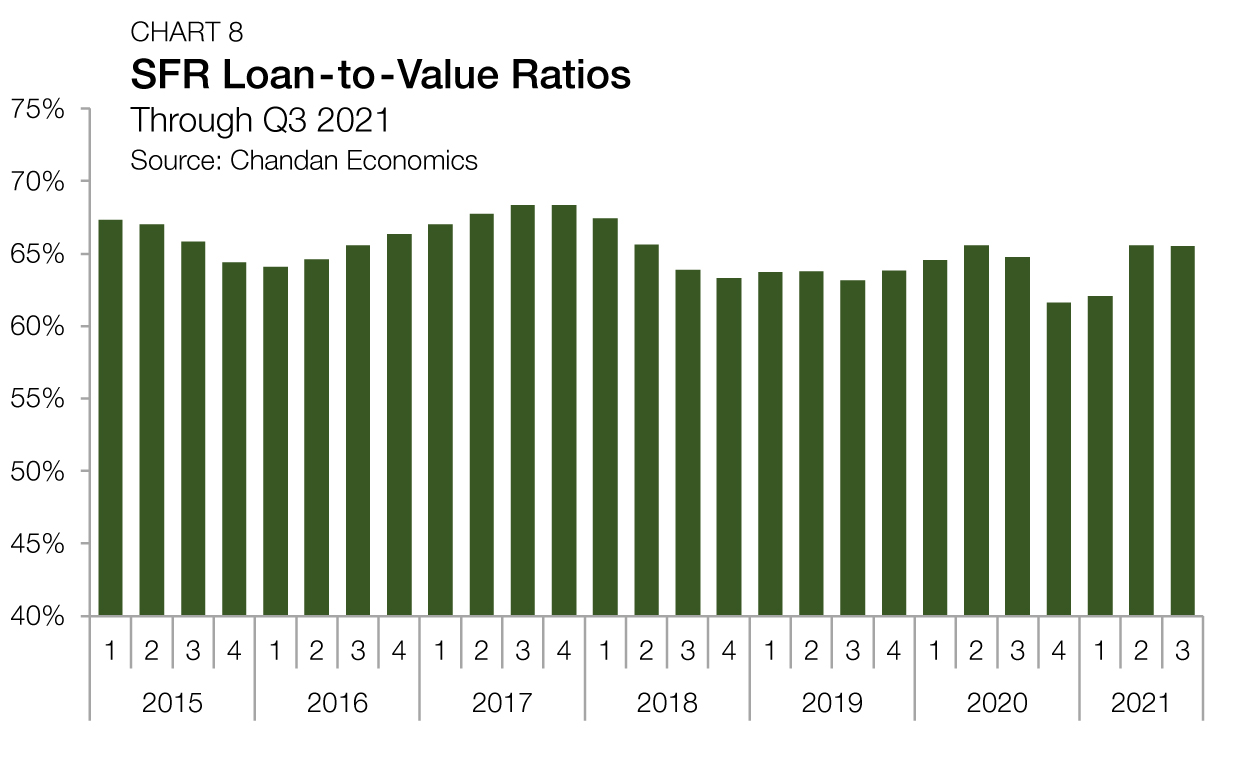
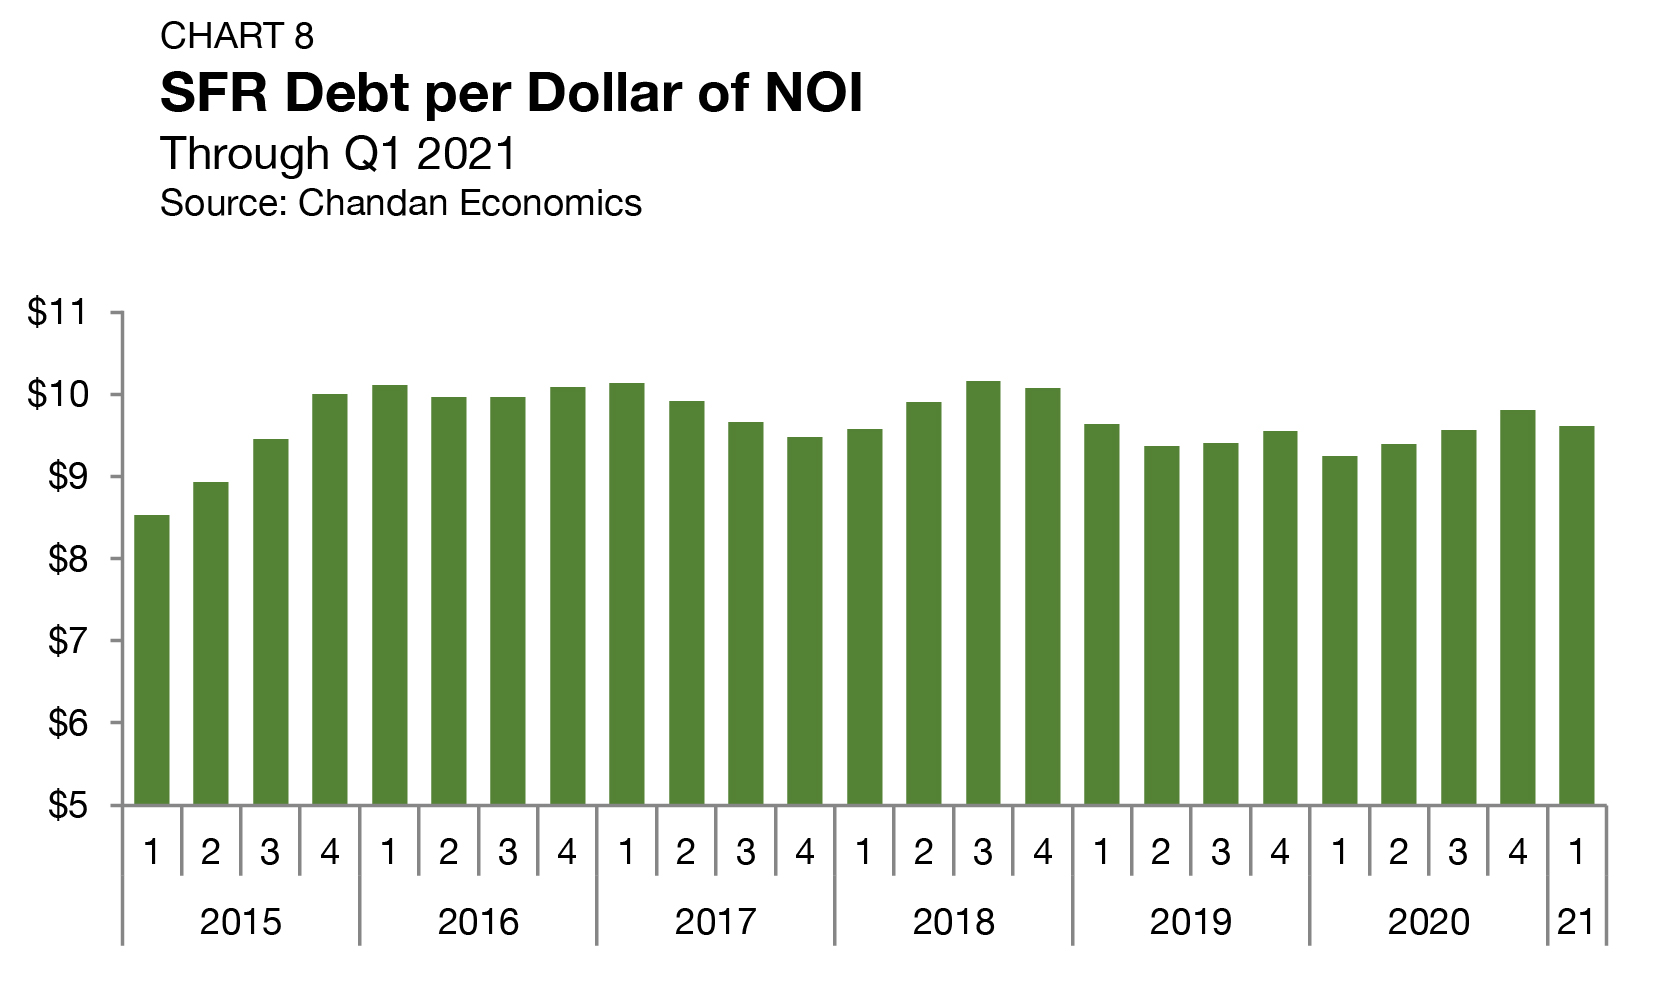
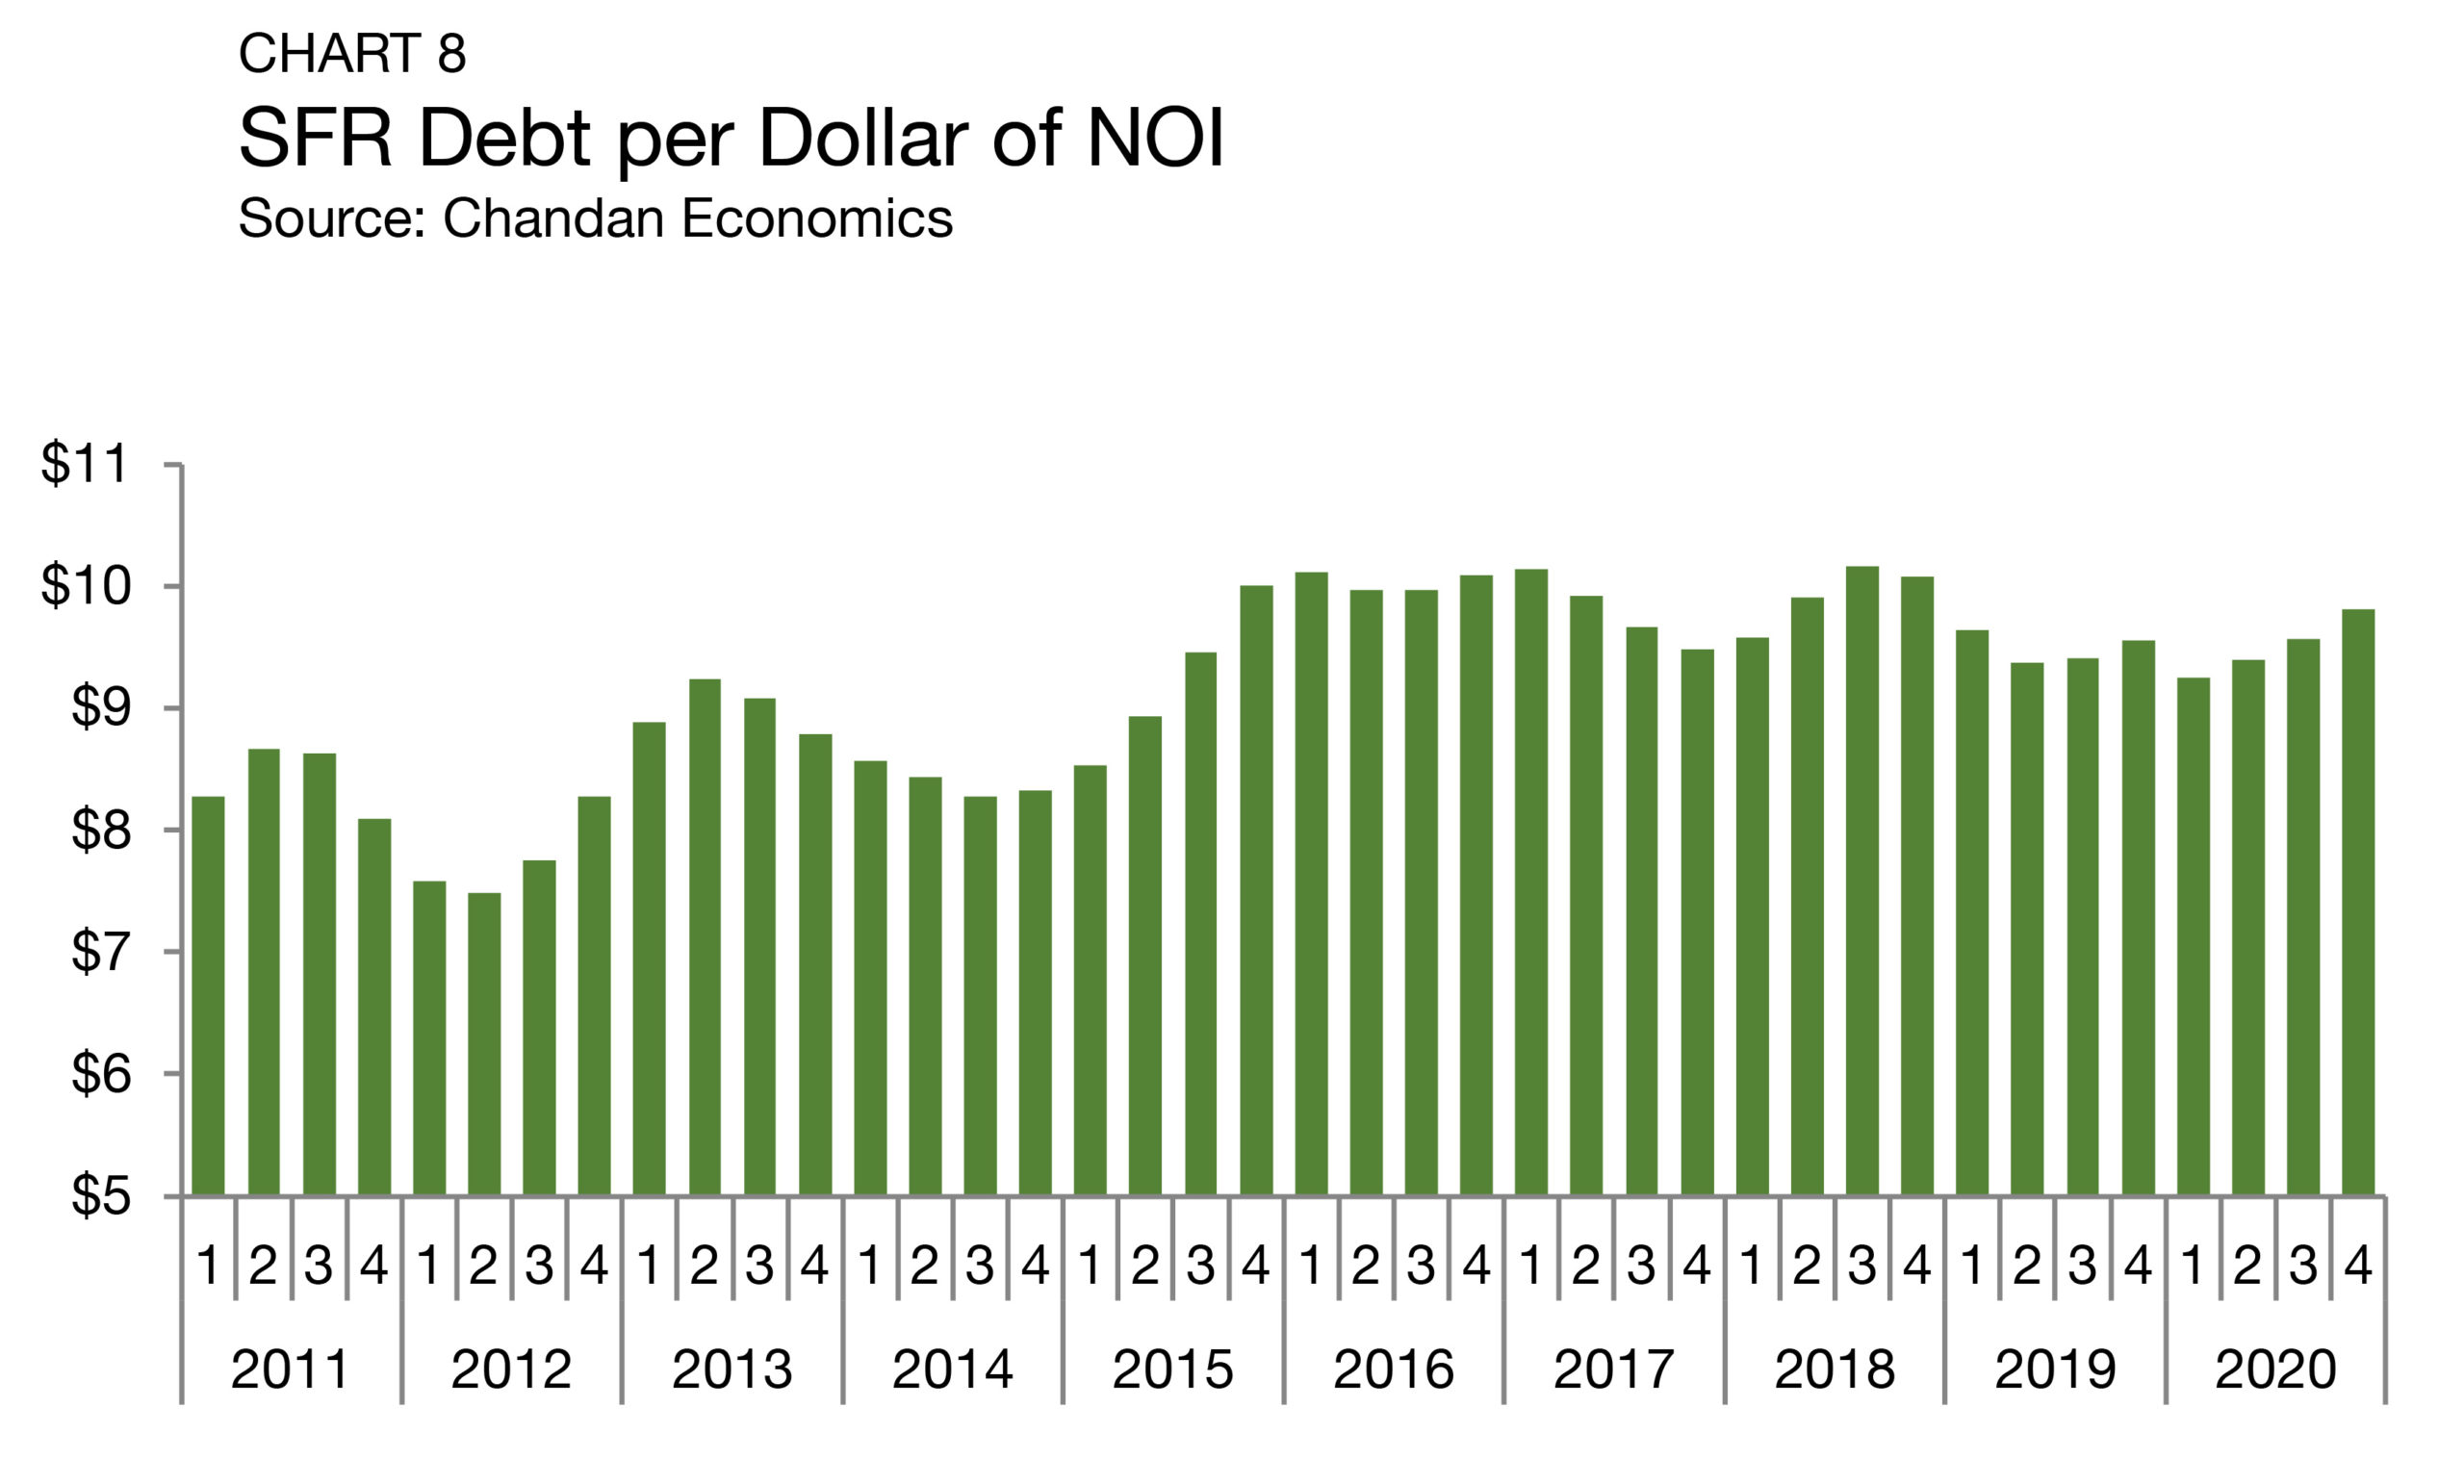
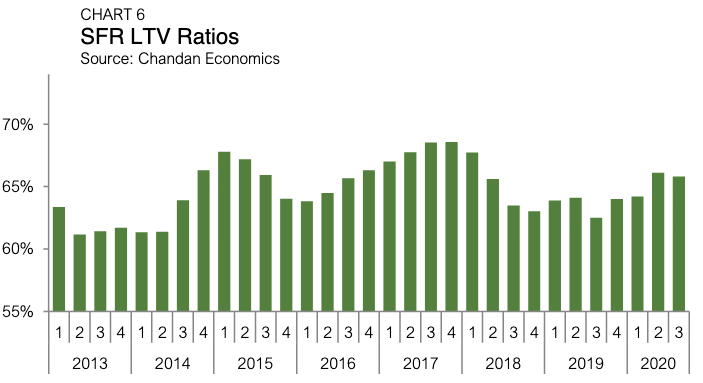
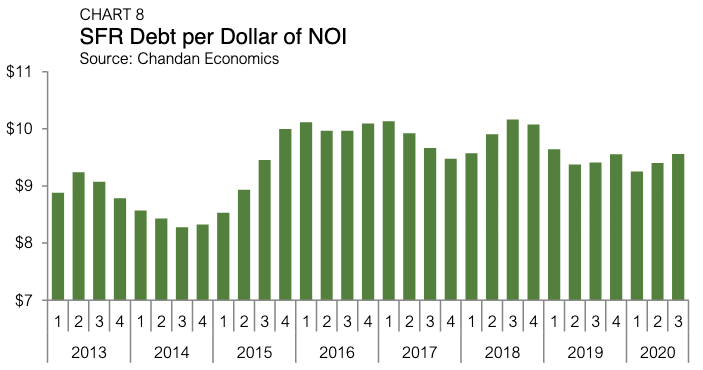
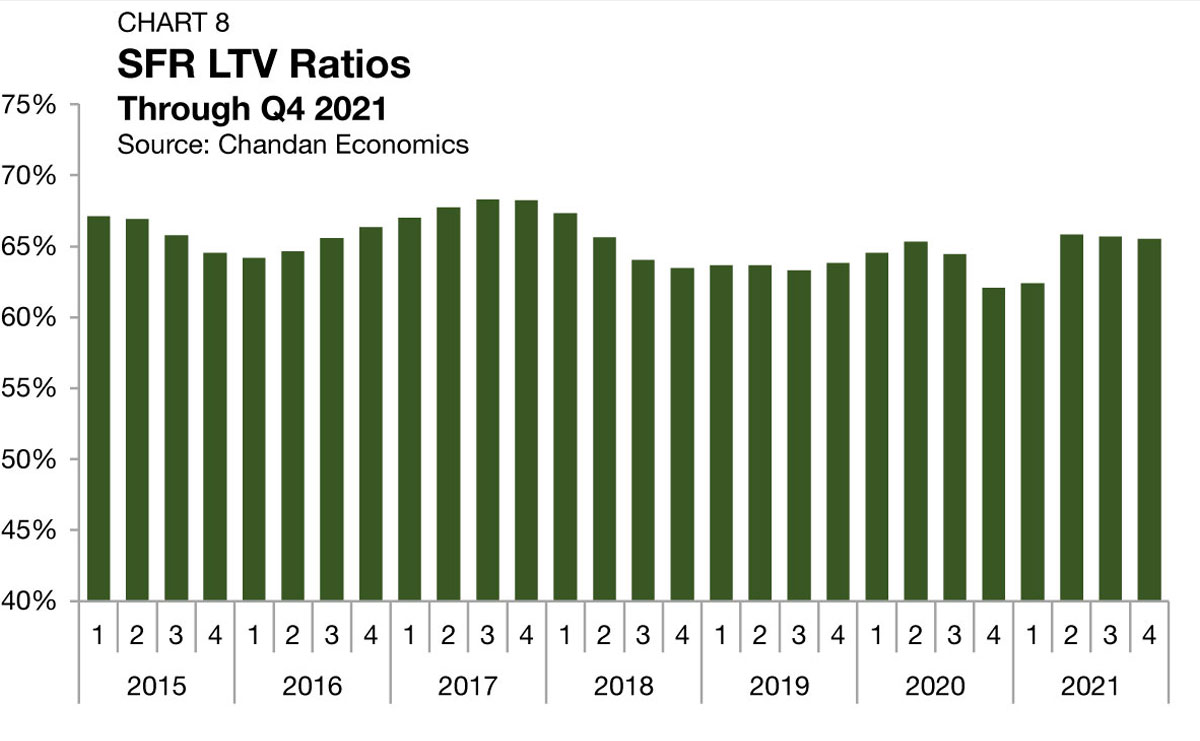
Loan-to-value ratios (LTVs), a measure of credit risk on SFR mortgages, ended the year by edging down for the second consecutive quarter, shaving off 17 bps to land at 65.5% (Chart 8). After sinking by 328 bps between the second and fourth quarters of 2020, LTVs quickly recovered back to pre-pandemic levels by mid-2021. Despite recent marginal declines, SFR LTVs remain higher than they were at the onset of the pandemic. The return and stabilization of LTVs to pre-COVID-19 levels are a welcome signal that credit risk appetites have recovered and remain aligned with the sector’s favorable outlook.
Supply & Demand Conditions
Residential Default Rates
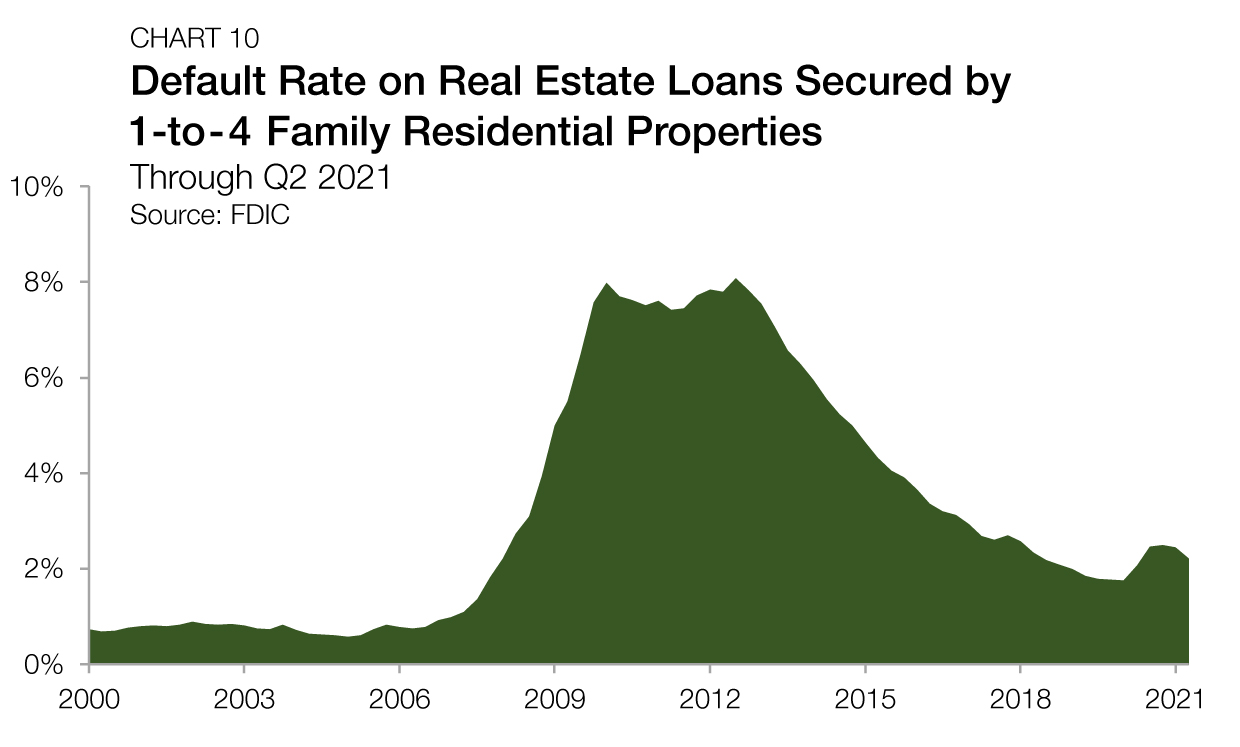
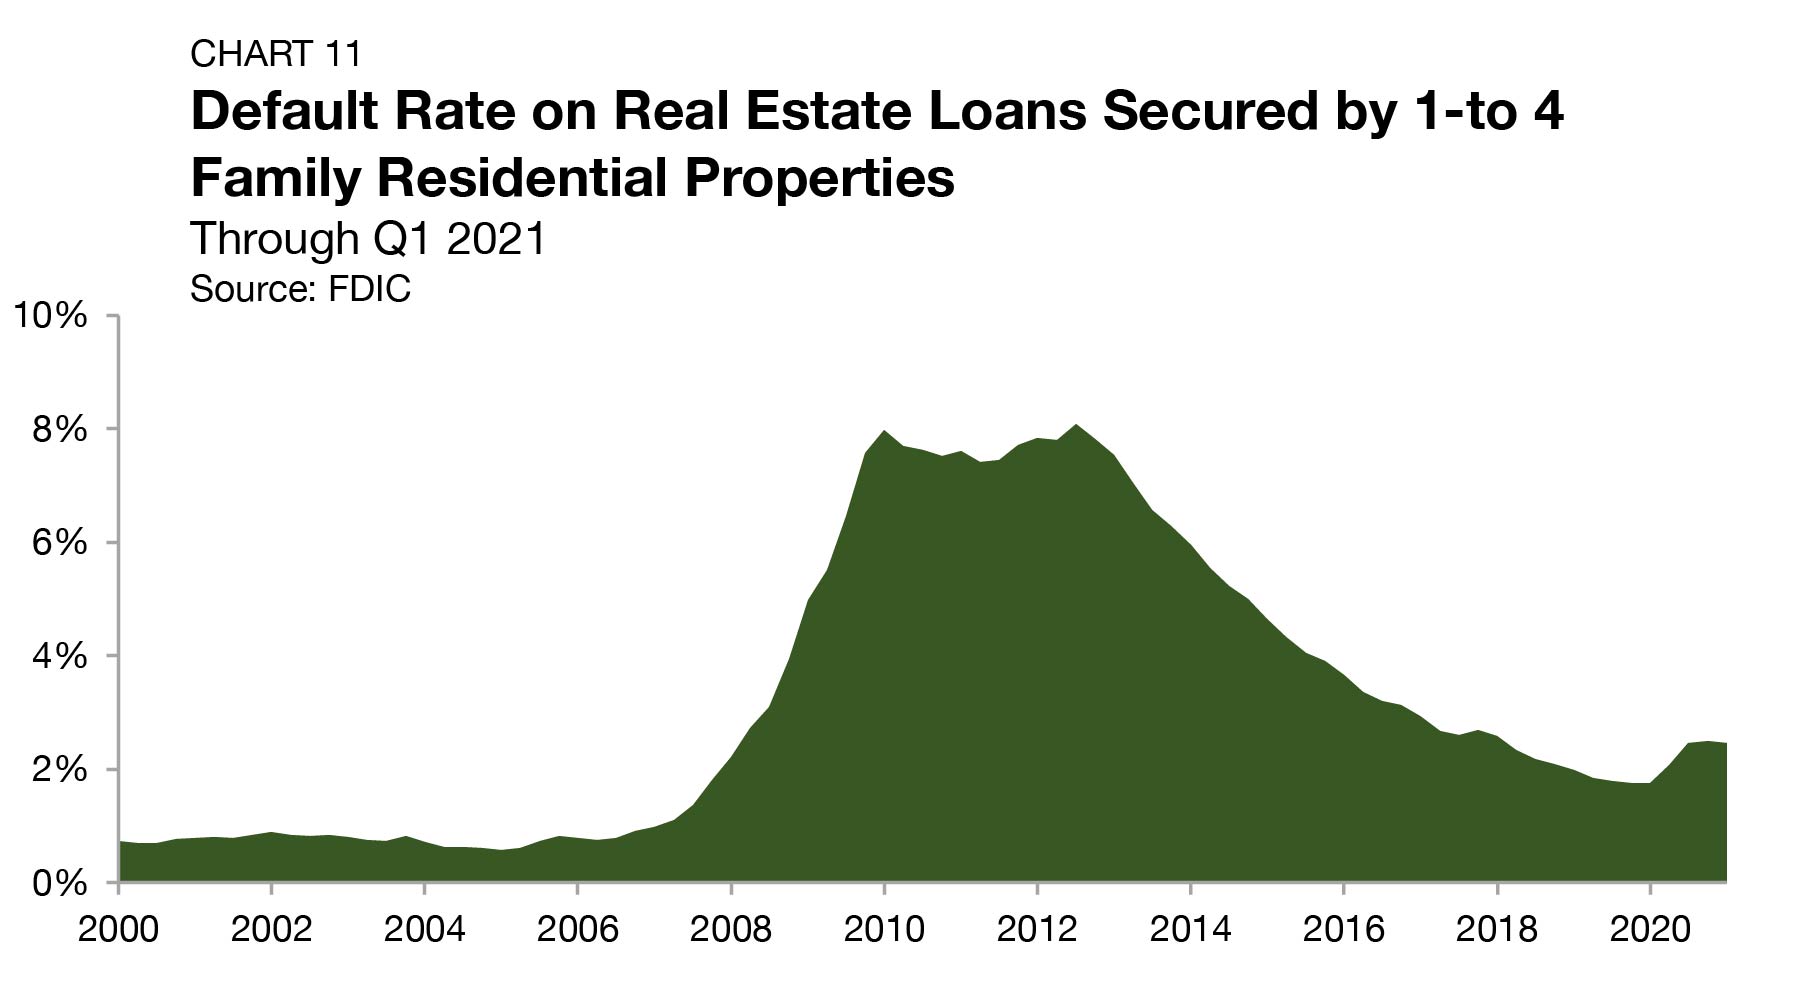
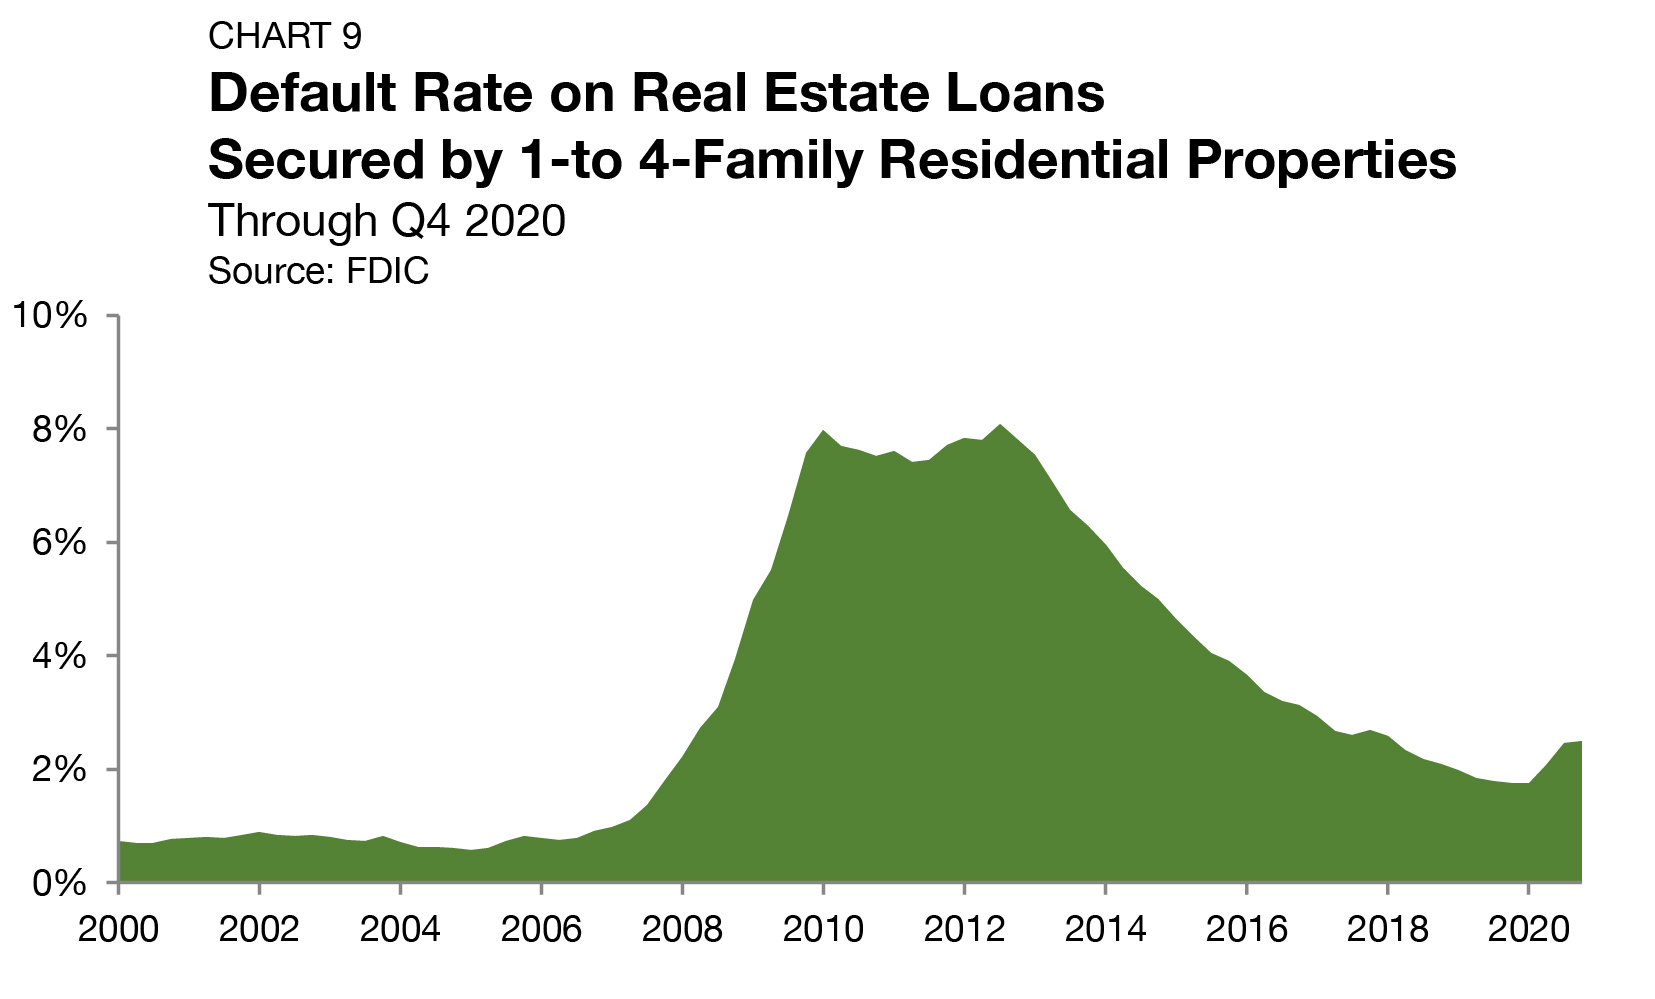
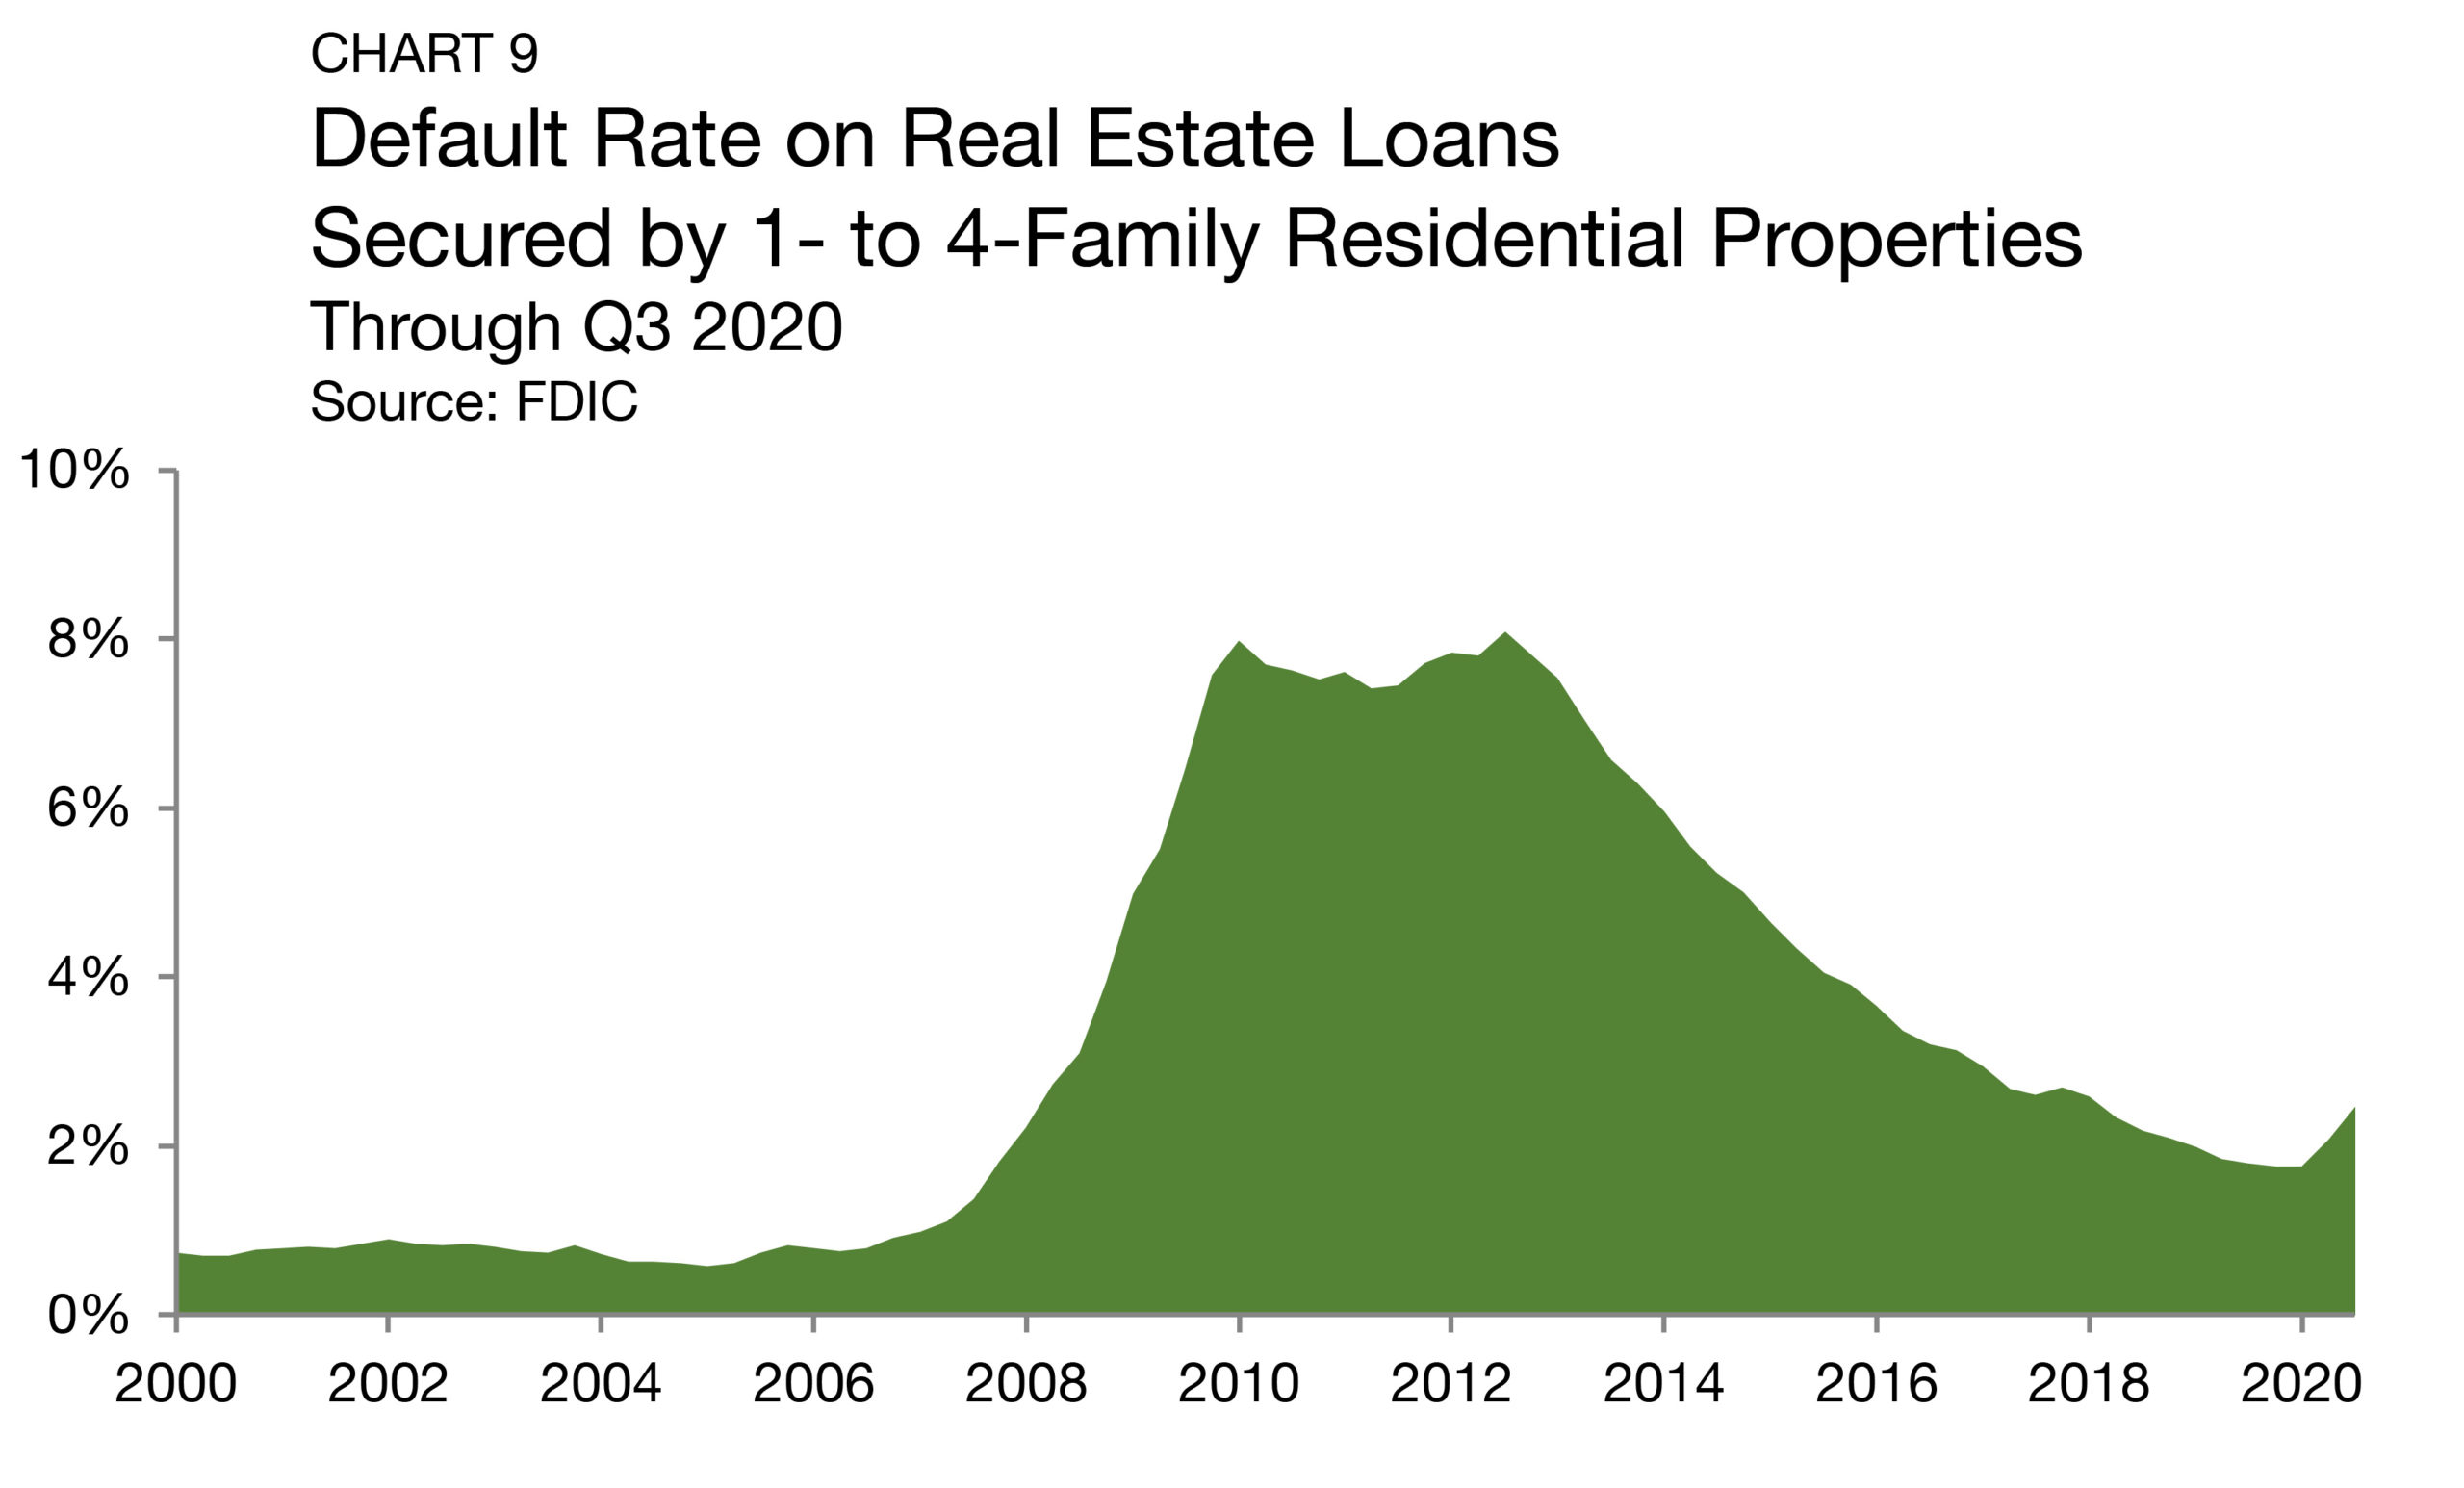
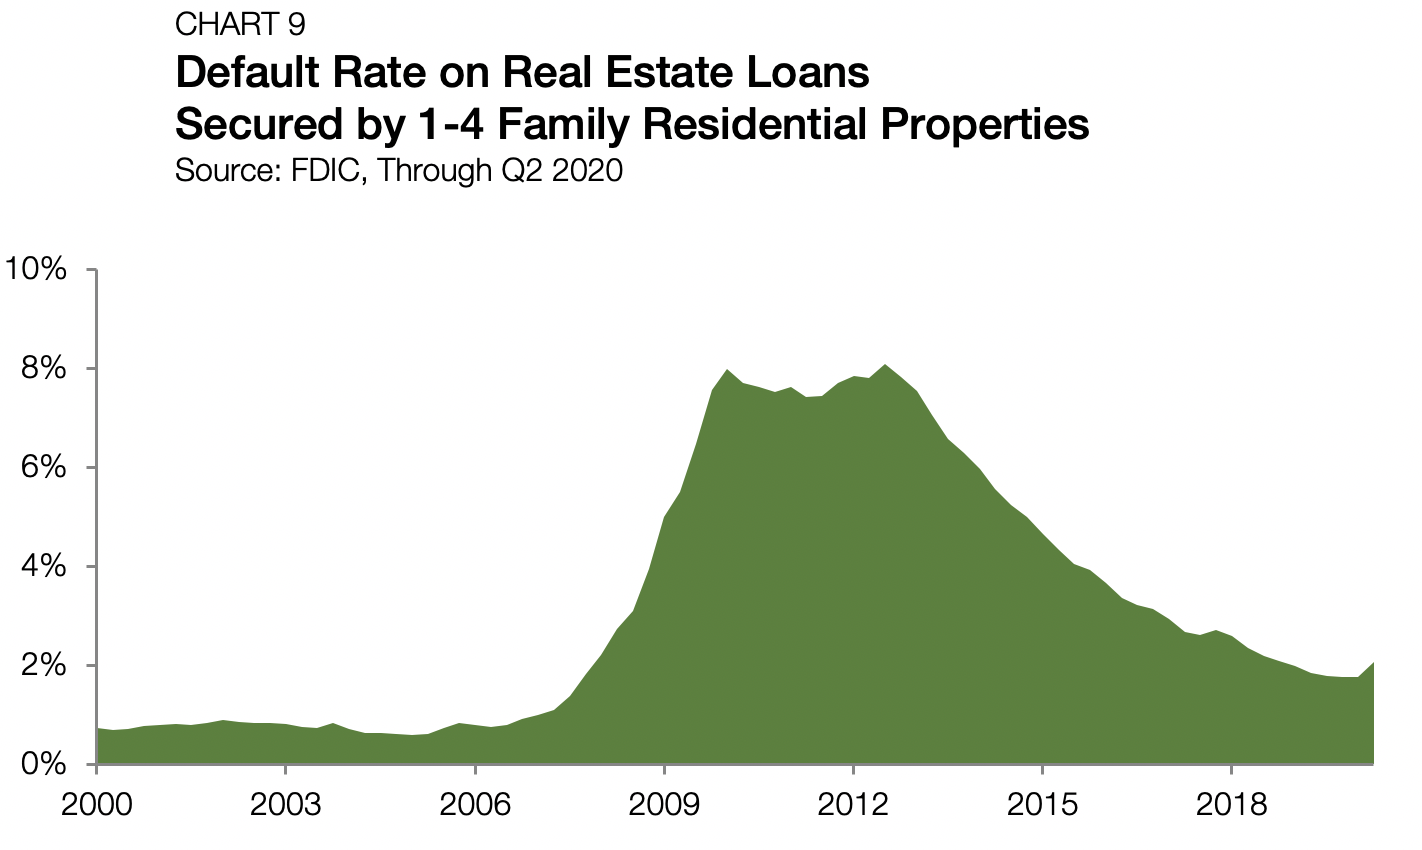
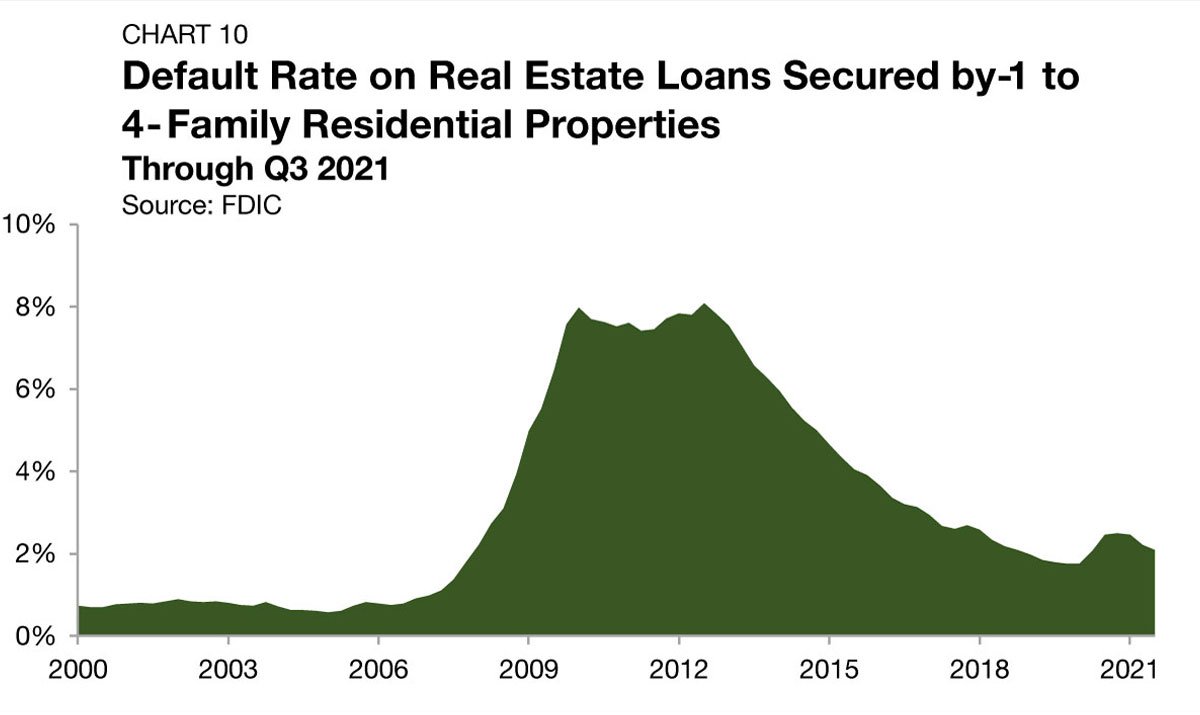
During the 2008 housing crisis, investors with available financing took advantage of the market dislocation, acquiring large portfolios of single-family assets at steep discounts. According to the Federal Deposit Insurance Corporation (FDIC), mortgage default rates peaked at 8.1% in 2012, leading to an abundance of distressed sales and the beginning of the SFR sector as we know it today (Chart 10).
When the pandemic reached the U.S. in 2020, there was concern that there might be a wave of household defaults and a housing crisis on the horizon. However, those fears never materialized. Residential default rates never rose above 2.5% during the pandemic and have now fallen for three consecutive quarters, settling at 2.1% through the third quarter of 2021. The lack of default activity during the pandemic triggered recession is a feature of housing market demand. Unlike during the Great Recession, homeowners who found themselves unable to meet their monthly mortgage payments had the option to sell their assets at favorable valuations. Moreover, federally directed forbearance also limited the scope of housing market distress, giving homeowners flexibility during the worst of the pandemic’s economic pain.
Build-to-Rent
Purpose-built SFR properties, known as build-to-rent (BTR) communities, continue to become a defining feature of the SFR sector, especially within the institutional slice of the market.
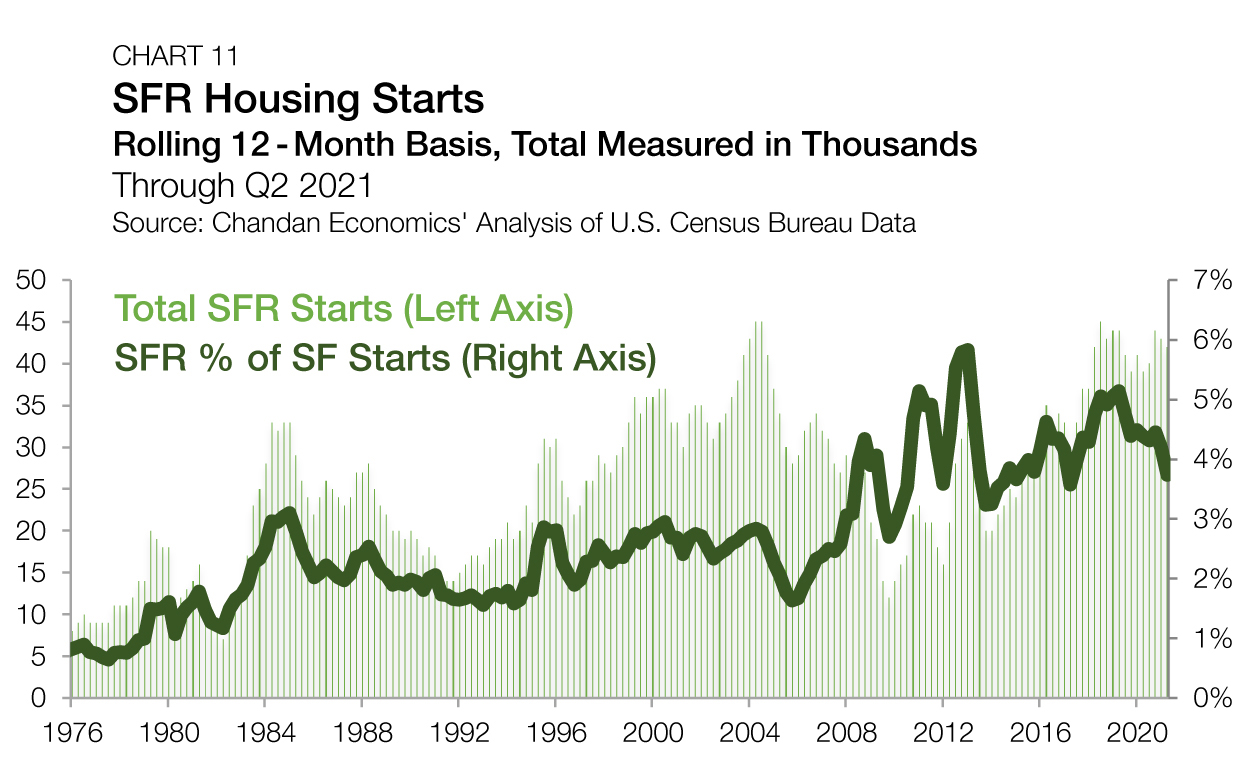
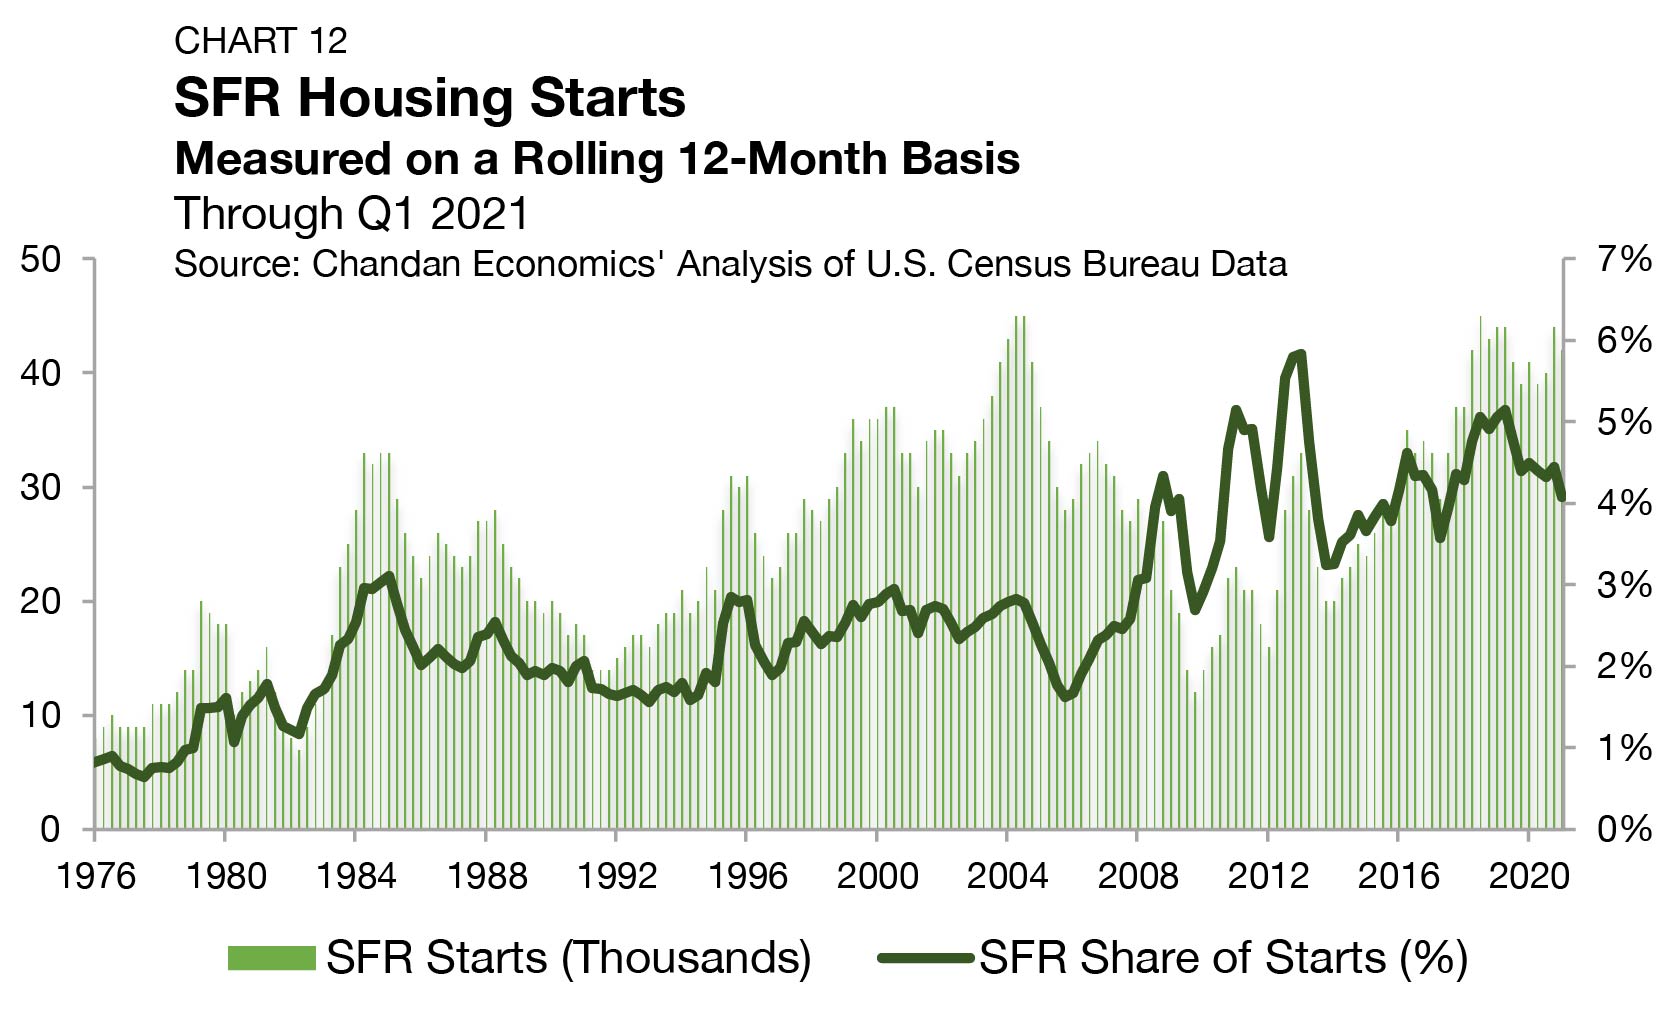
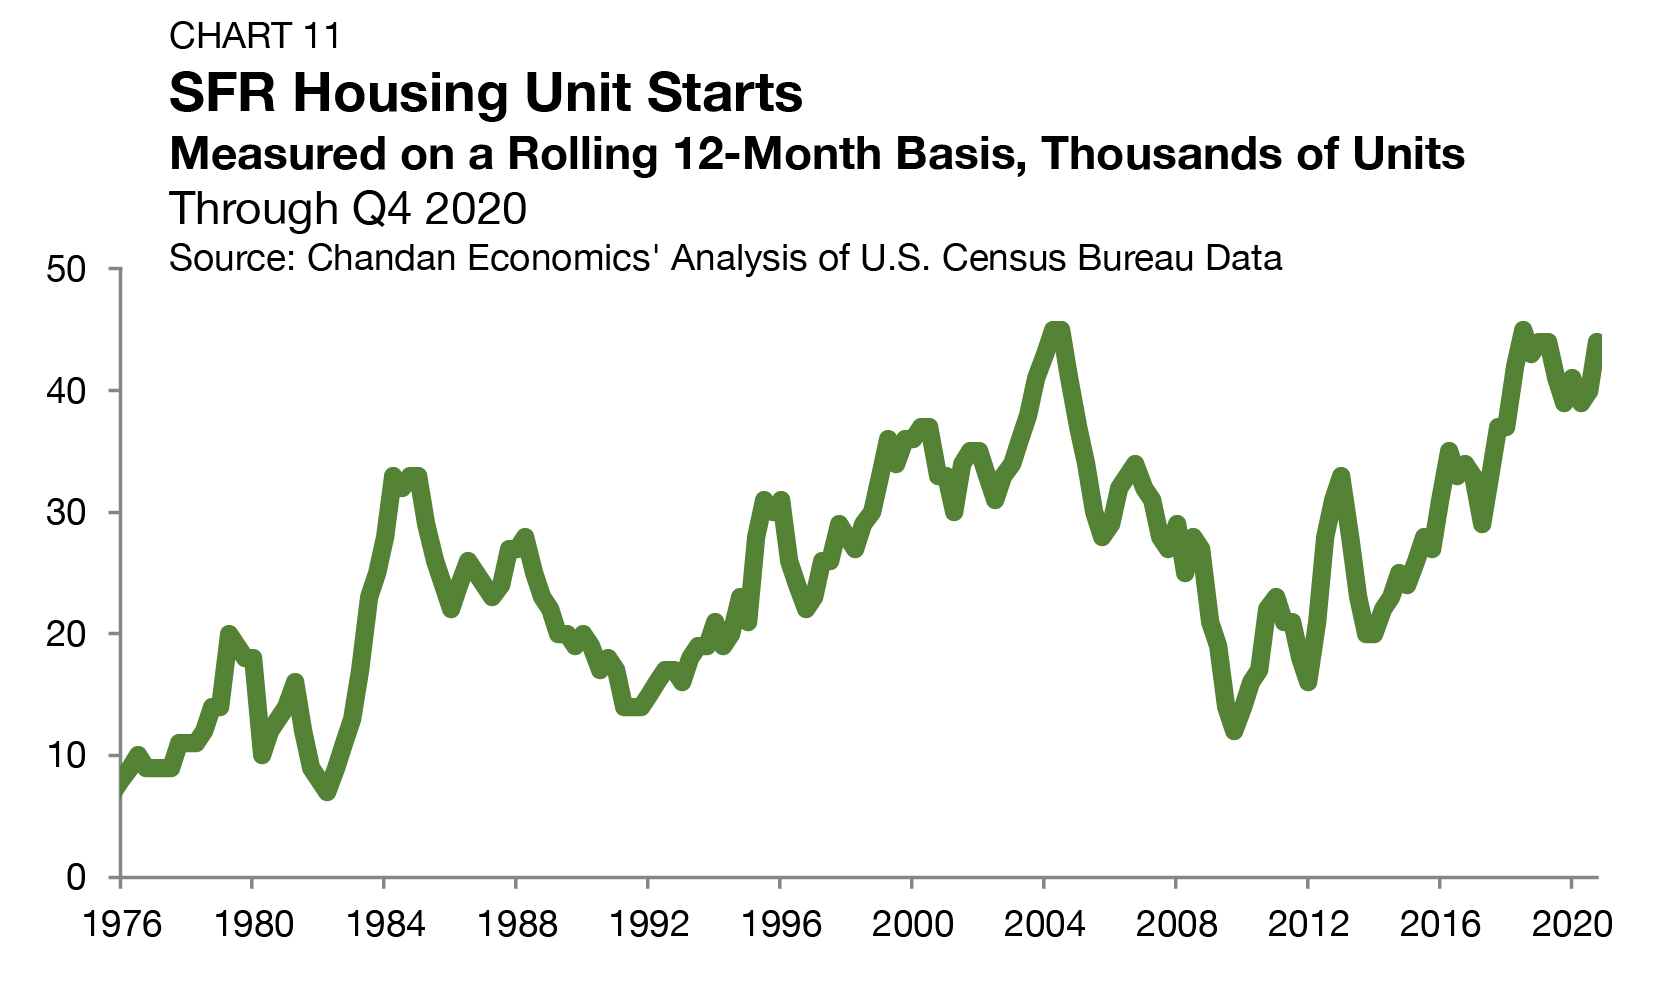
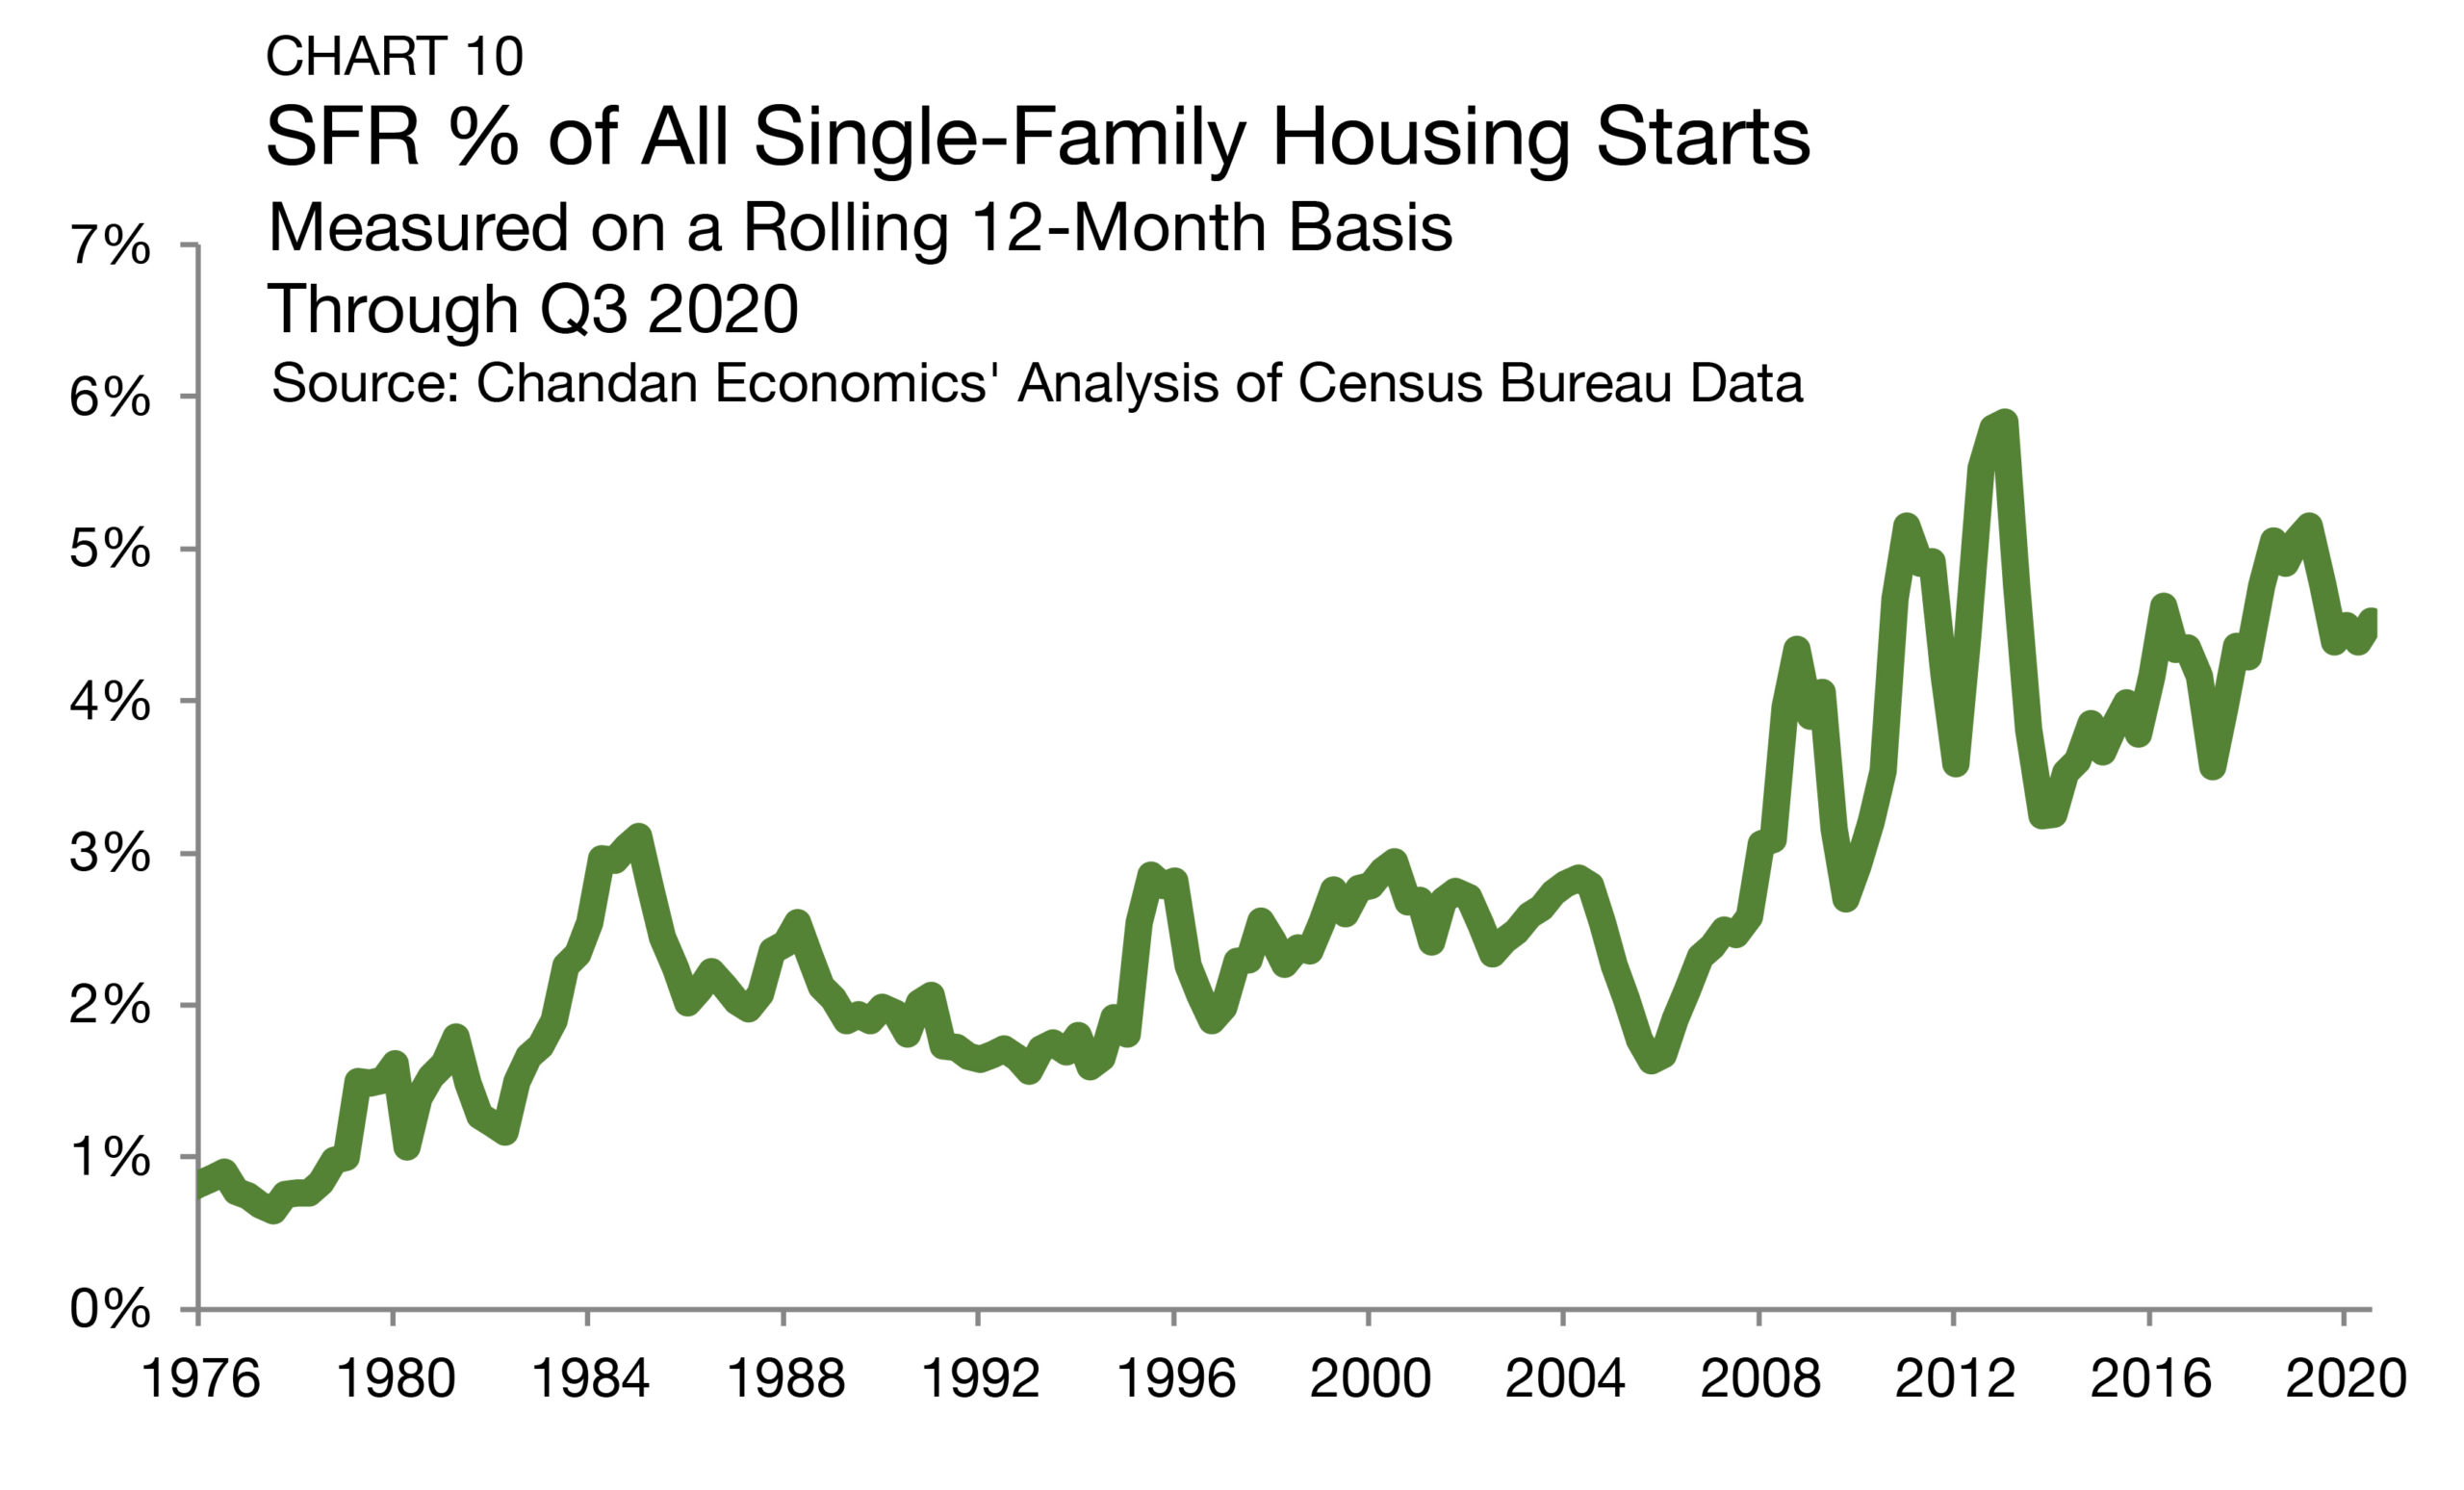
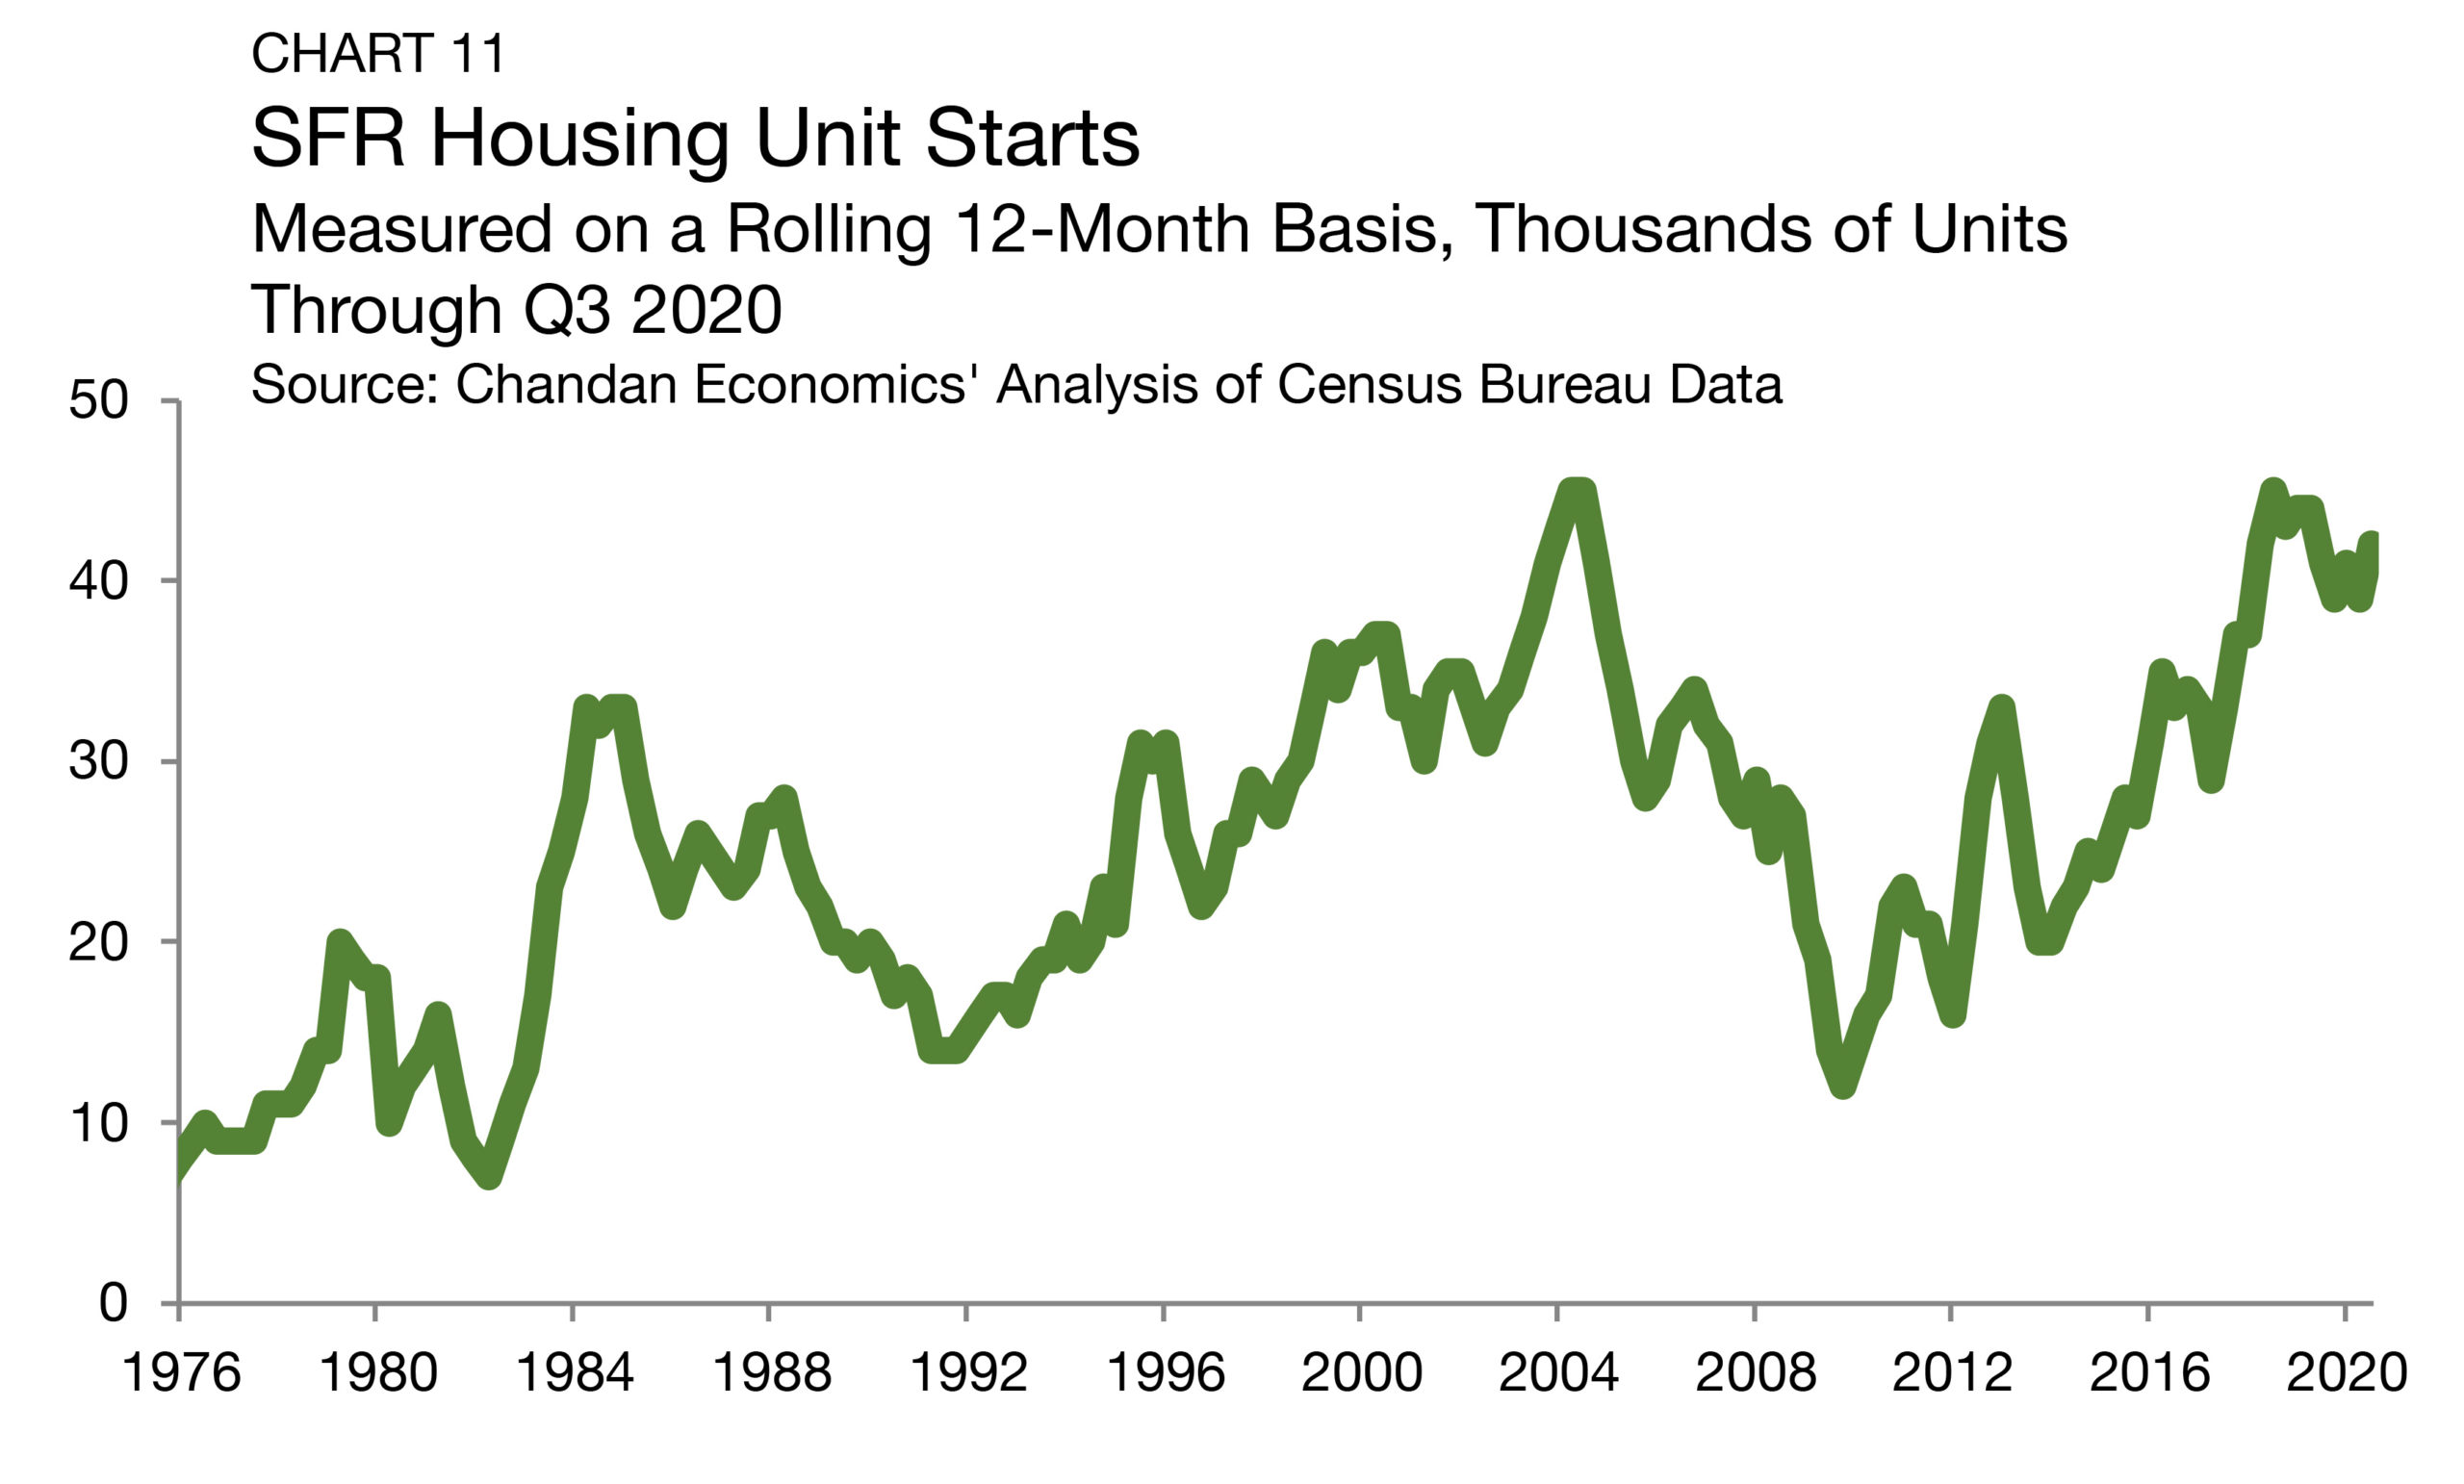
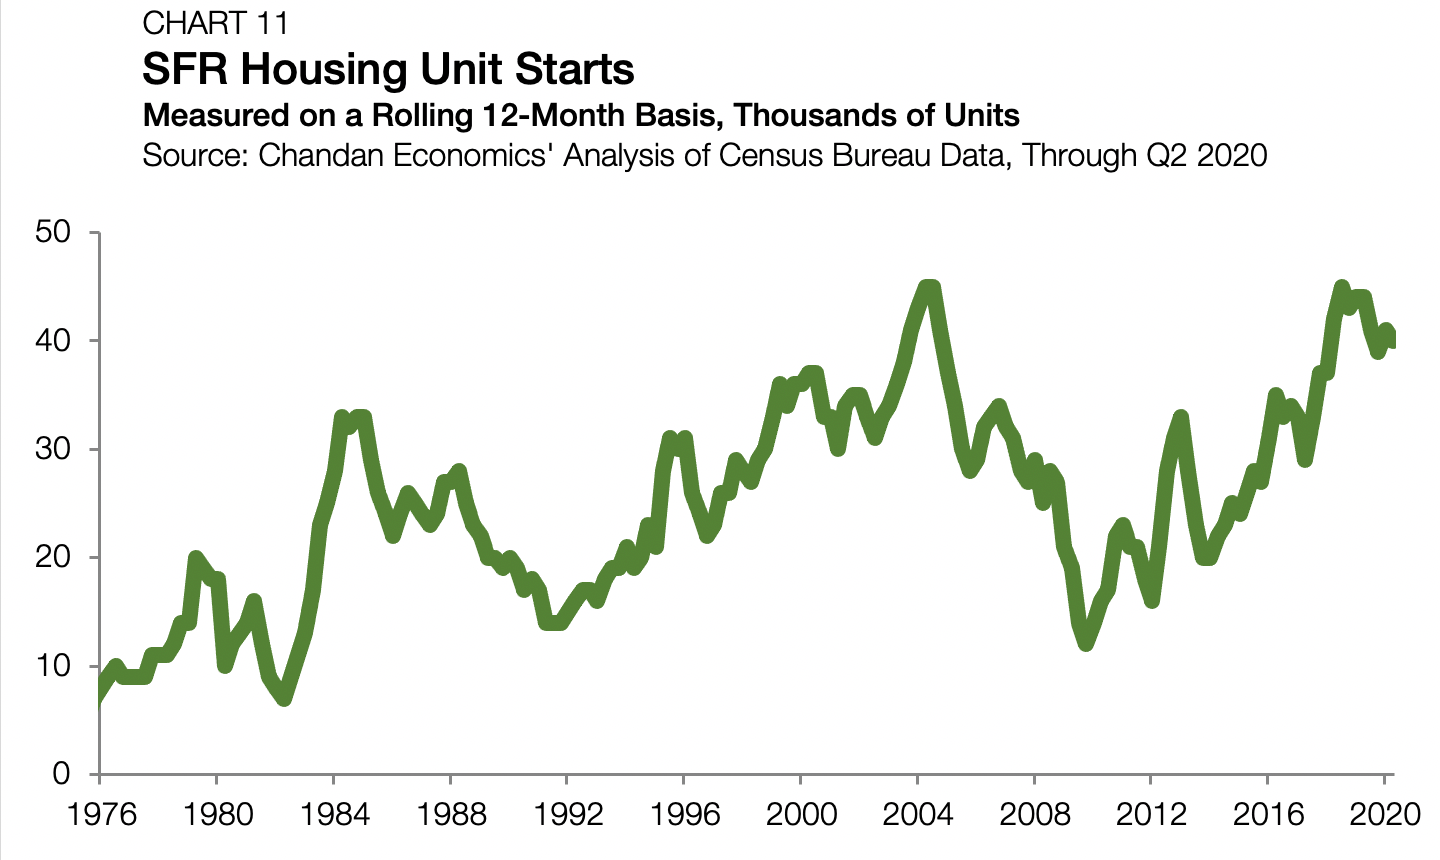
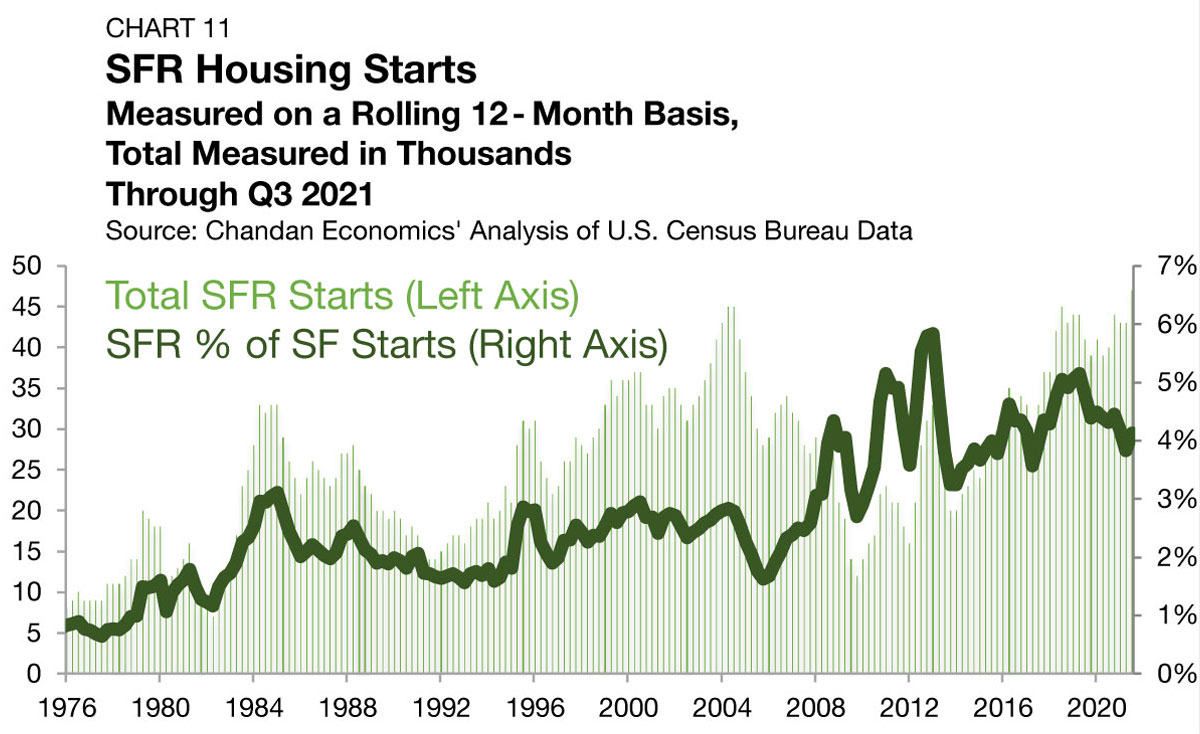
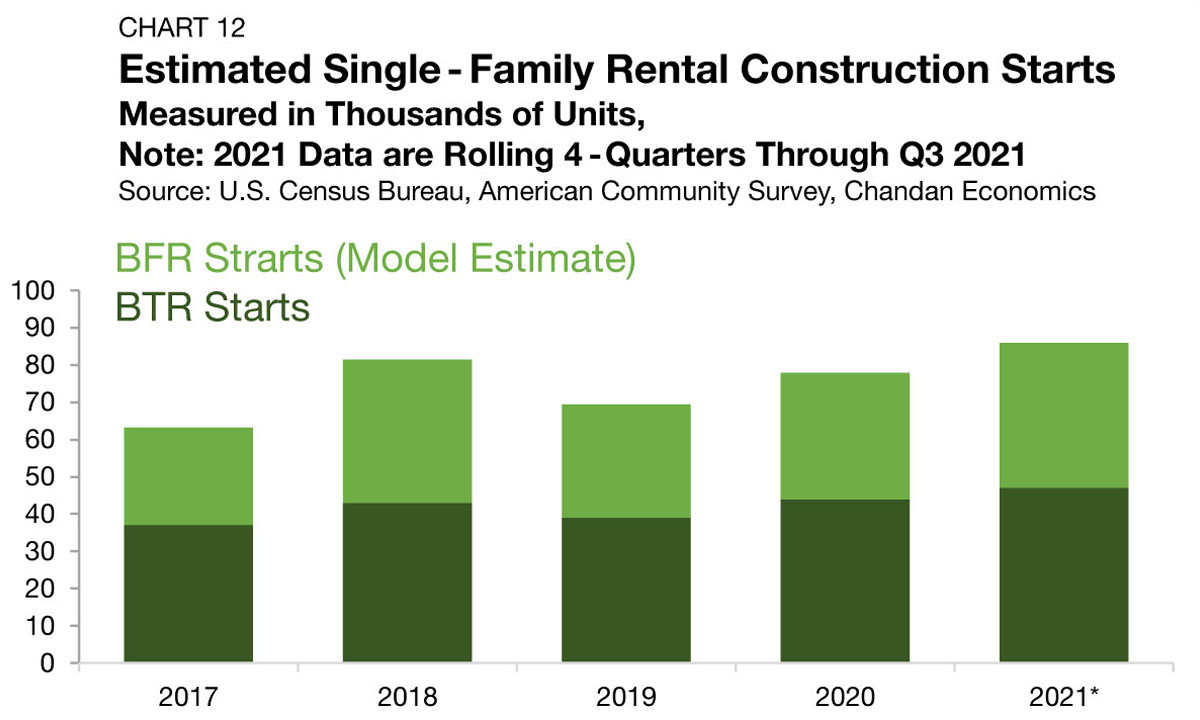
Based on an analysis of Census Bureau data, between 1975 and the start of the prior recession in 2007, BTRs accounted for a little less than 2.0% of all single-family construction starts (Chart 11). In 2013, BTR’s percentage share of construction starts reached an all-time high of 5.8%, and through the third quarter of 2021, the share remained elevated at 4.1%. BTR construction starts totaled 47,000 units through the year ending in third-quarter 2021, a 17.5% growth rate from a year earlier and a new all-time high— a significant growth rate, but one that appears
to be understated.
Tracking Demand
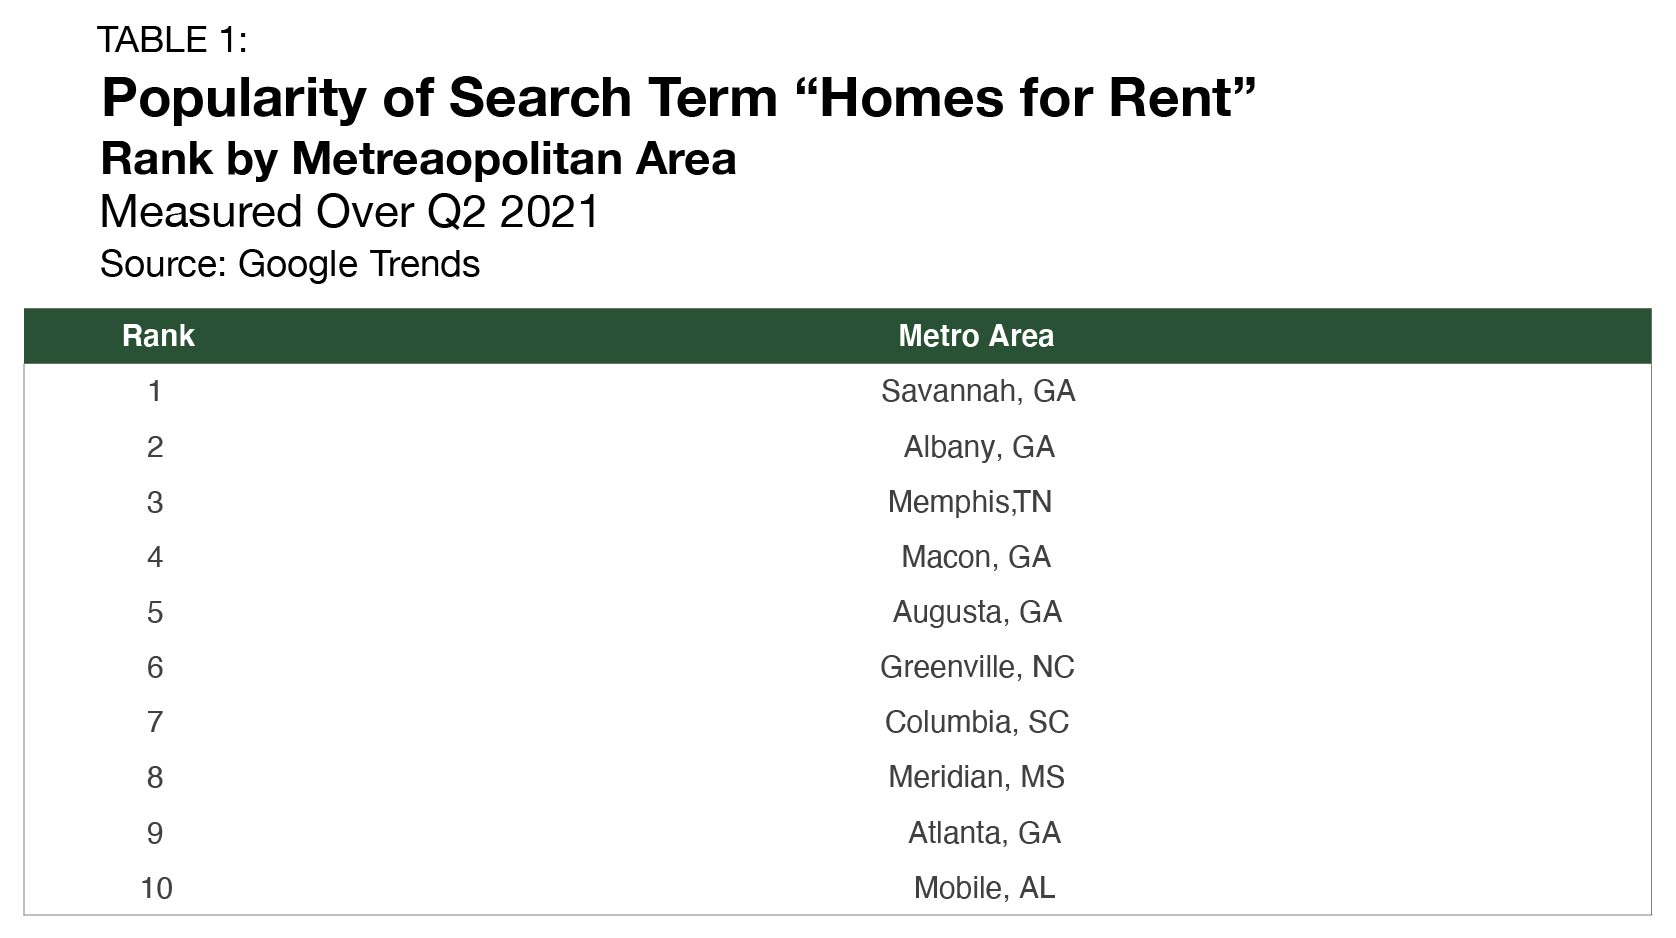
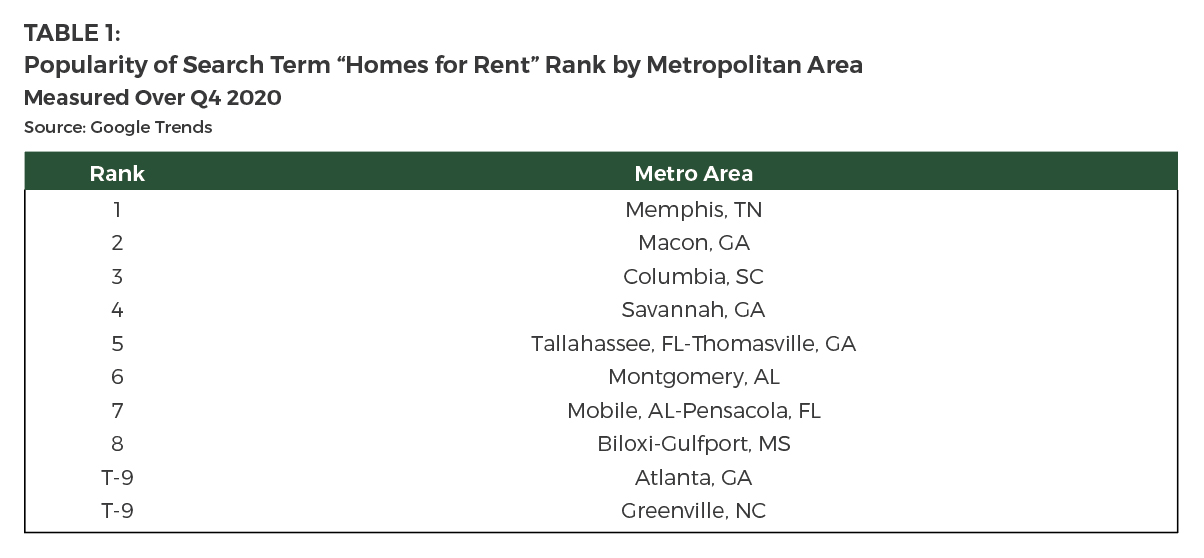
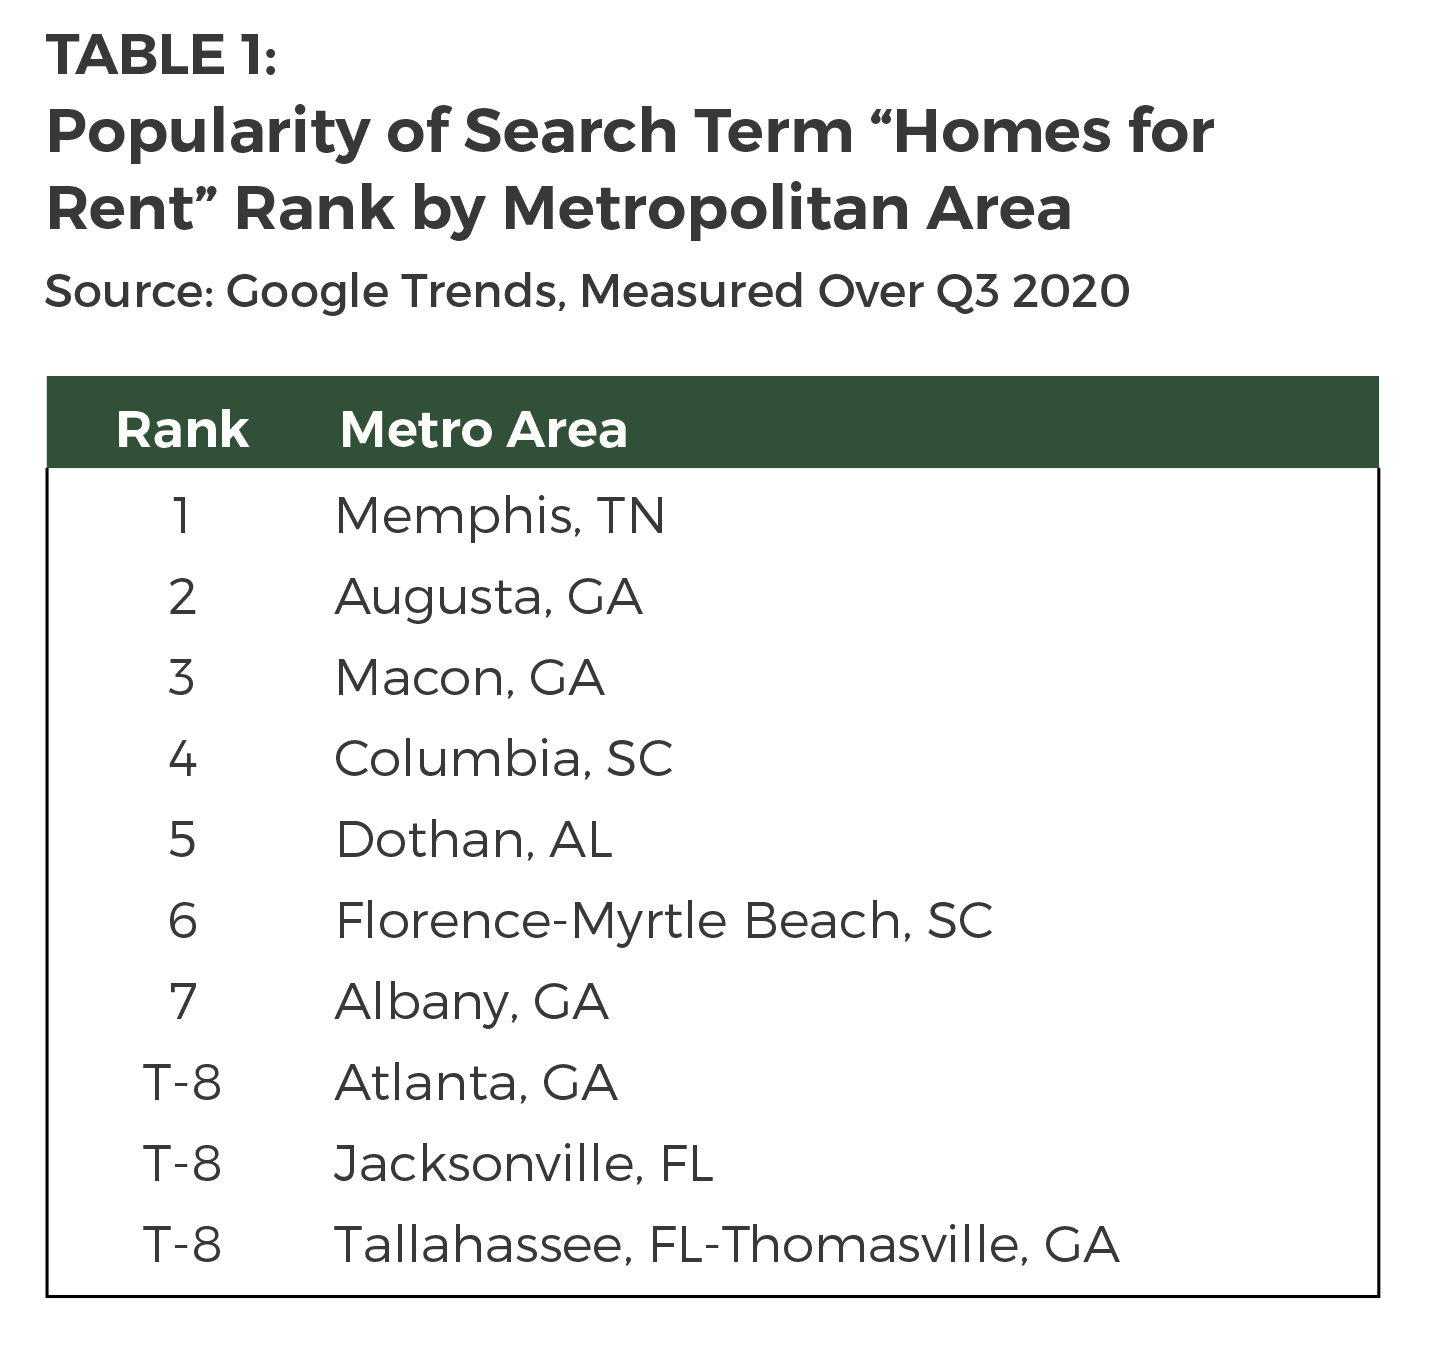
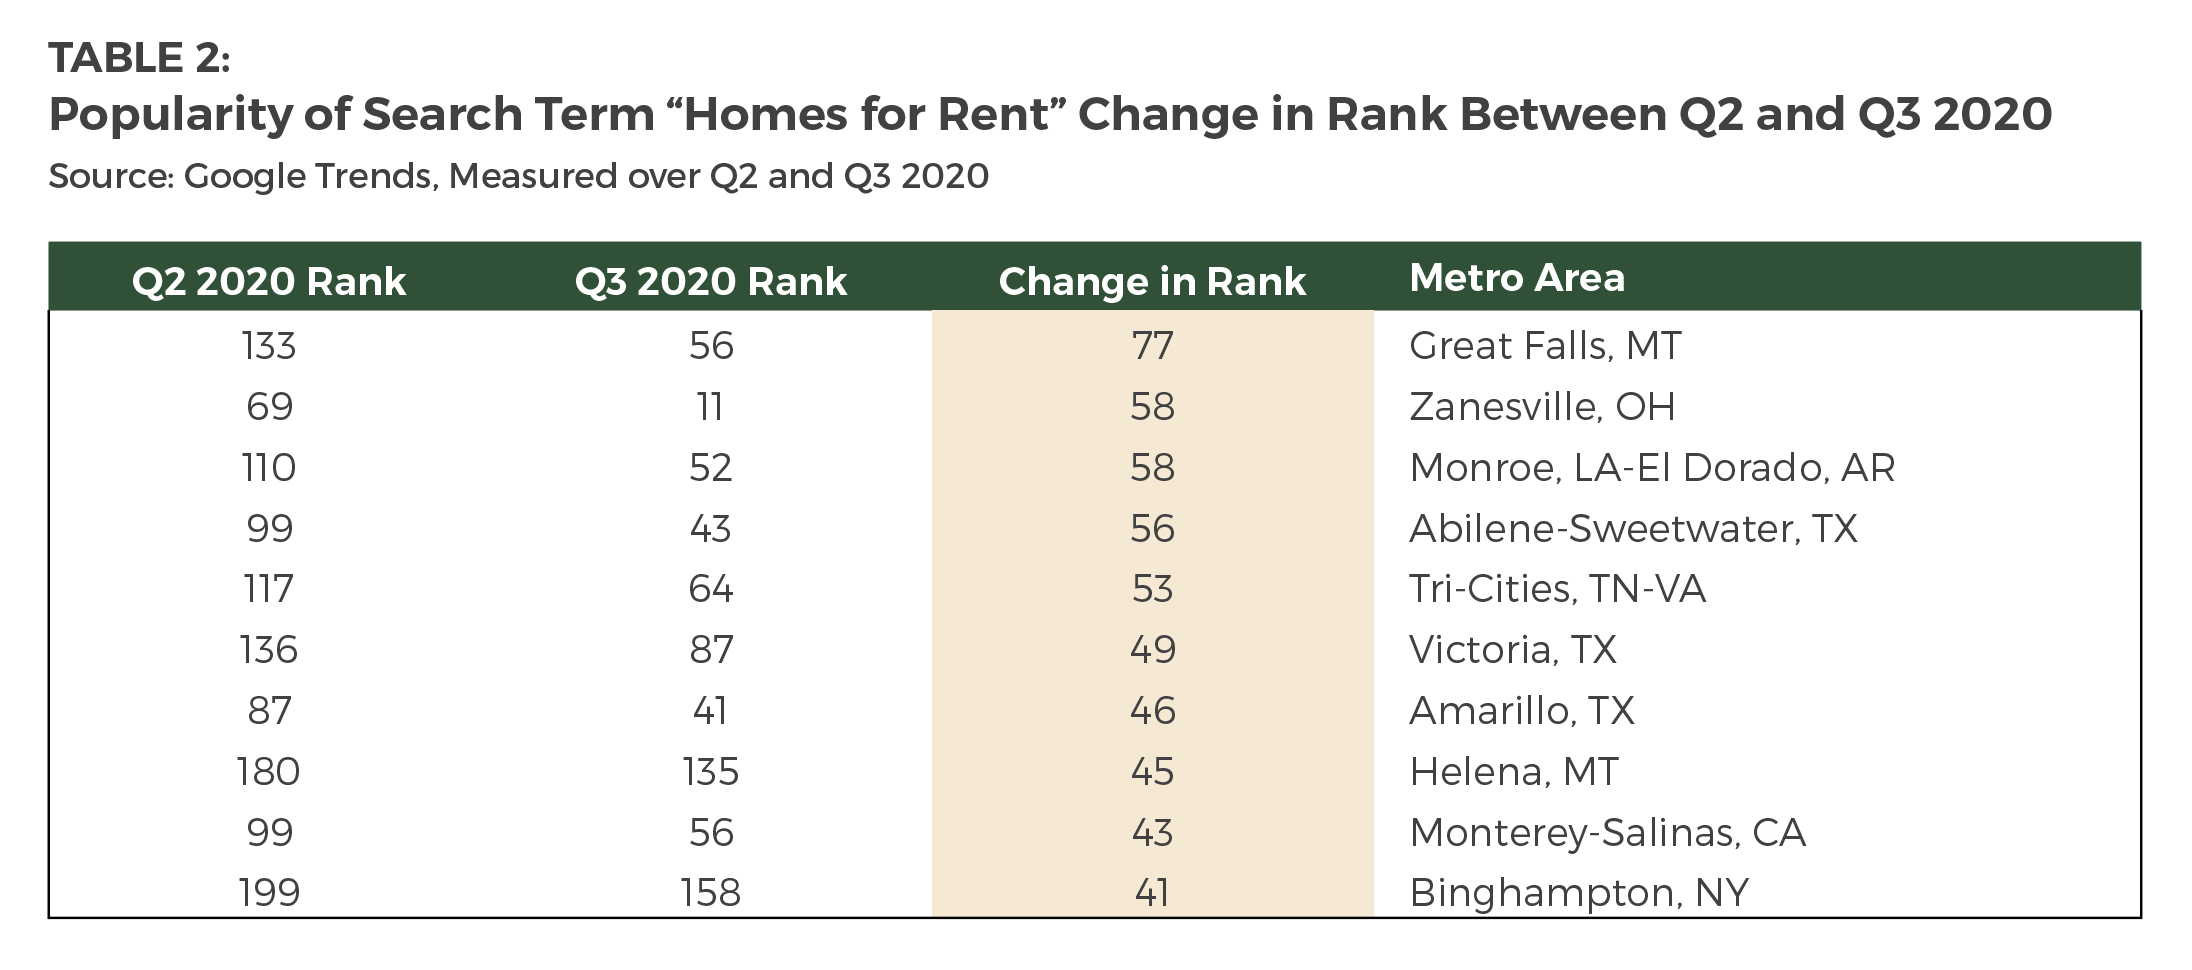
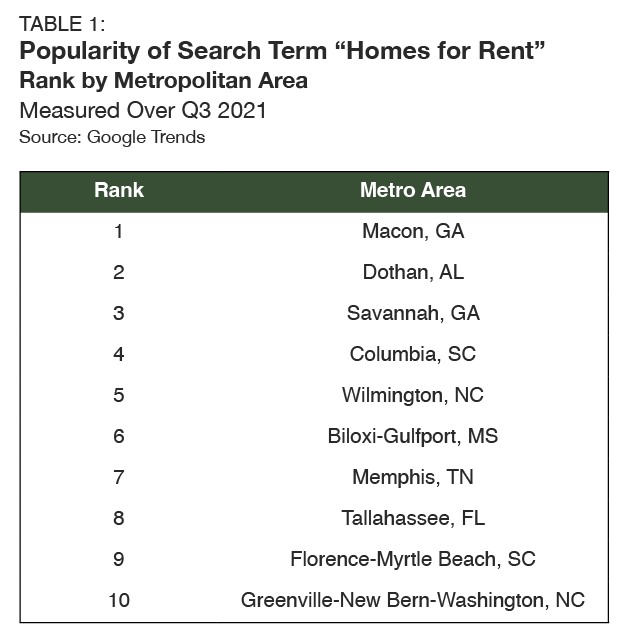
Utilizing Google Trends, the popularity of the search term “homes for rent” is leveraged as a proxy for hotspots of SFR demand. Macon, GA, was the most popular area where the term was searched during the fourth quarter of 2021, dethroning Columbus, GA, which had seen the highest search frequency in the previous period (Table 1).
The Sun Belt continues to be the U.S. epicenter for SFR demand. All of the top 10 markets searched for in the fourth quarter of 2021 are in the Sun Belt. Moreover, all ten are in the Census Bureau’s South region, which saw its resident population grow by 0.65% in 2021— 60 bps better than the Western Census region, which was the only other area of the country to see population growth last year. Among the reasons why the Sun Belt continues to attract new residents and SFR demand, affordability, lower taxes, and warmer weather all top the list.
Outlook
For more single-family rental research and insights, visit arbor.com/blog